Optimal arrangement for pressure measurement points in working chamber of earth pressure balance shield
来源期刊:中南大学学报(英文版)2012年第7期
论文作者:刘畅 屈福政 李守巨 孟庆琳
文章页码:1883 - 1891
Key words:tunneling; earth pressure balance shield; working chamber; optimal arrangement; discrete element method
Abstract: In order to exactly provide scientific basis for pressure dynamic balance control of working chamber of earth pressure balance shield (EPBS), study on optimal arrangement of pressure measurement points in working chamber was conducted. Based on mathematical description of optimal arrangement for pressure measurement points, fuzzy clustering analysis and discriminant analysis were used to divide pressure regions of nodes on bulkhead. Finally, the selection method of optimal measurement points was proposed, and by selecting d6.28 m EPBS as study object, the case study was conducted. By contrast, based on optimal arrangement scheme of pressure measurement points, through adopting weighted algorithm, the absolute error mean of equivalent pressure of working chamber is the smallest. In addition, pressure curve of optimal arrangement points presents parabola, and it can show the state of pressure distribution on bulkhead truly. It is concluded that the optimal arrangement method of pressure measurement points in working chamber is effective and feasible, and the method can provide basis for realizing high precision pressure control of EPBS.
J. Cent. South Univ. (2012) 19: 1883-1891
DOI: 10.1007/s11771-012-1222-z![]()
LIU Chang(刘畅)1, QU Fu-zheng(屈福政)1, LI Shou-ju(李守巨)2 , MENG Qing-lin(孟庆琳)1
1. School of Mechanical Engineering, Dalian University of Technology, Dalian 116024, China;
2. State Key Laboratory of Structural Analysis of Industrial Equipment
(Dalian University of Technology), Dalian 116024, China
? Central South University Press and Springer-Verlag Berlin Heidelberg 2012
Abstract: In order to exactly provide scientific basis for pressure dynamic balance control of working chamber of earth pressure balance shield (EPBS), study on optimal arrangement of pressure measurement points in working chamber was conducted. Based on mathematical description of optimal arrangement for pressure measurement points, fuzzy clustering analysis and discriminant analysis were used to divide pressure regions of nodes on bulkhead. Finally, the selection method of optimal measurement points was proposed, and by selecting d6.28 m EPBS as study object, the case study was conducted. By contrast, based on optimal arrangement scheme of pressure measurement points, through adopting weighted algorithm, the absolute error mean of equivalent pressure of working chamber is the smallest. In addition, pressure curve of optimal arrangement points presents parabola, and it can show the state of pressure distribution on bulkhead truly. It is concluded that the optimal arrangement method of pressure measurement points in working chamber is effective and feasible, and the method can provide basis for realizing high precision pressure control of EPBS.
Key words: tunneling; earth pressure balance shield; working chamber; optimal arrangement; discrete element method
1 Introduction
Since tunneling with the earth pressure balance shield (EPBS) originally appeared in Japan, more and more EPBS have been applied in tunnels, such as metro and municipal engineering. During tunneling construction, operators calculate pressure of working chamber through observing pressure values which come from pressure sensors on bulkhead, and contrast setting values of support pressure. Then, control parameters are adjusted to realize pressure balance control of working chamber in order to ensure tunnel face stability and avoid up-warping or collapse of the ground surface [1]. For setting support pressure reasonably, LECA and DORMIEUS [2] studied failure mode on tunnel face by using plasticity limit theory. Then, the maximal and minimal support pressures which ensured tunnel face stability were presented [3-4]. At the same time, based on limit equilibrium theory, limit support pressure which was adopted to avoid collapse of tunnel face was given [5-6]. With the development of computer technology, many researchers obtained limit support pressure of tunnel face by numerical simulation method [7-8]. Moreover, YEH [9] presented automatic control method of pressure balance based on BP (back-propagation) network, and his method successfully passed construction test in 1997. According to flow balance principle, YANG et al [10] established pressure control method for working chamber of EPBS, and relevant experiment result showed that this method was effective and feasible.
Studies mentioned above mainly emphasize on stability analysis of tunnel face and pressure balance control theory of working chamber. However, there are less studies about arrangement of pressure measurement points in working chamber, and reasonable arrangement scheme of pressure sensors on bulkhead is not presented. Because support pressure of tunnel face cannot be measured directly, it is only obtained according to pressure calculation value of working chamber indirectly. However, pressure calculation value of working chamber is closely related to the arrangement of pressure measurement points. Thus, lack of study on arrangement of pressure measurement points would cause the phenomenon that support pressure is not reflected factually. It cannot supply basis for pressure balance control reasonably and exactly. This condition reduces safety and efficiency of tunneling construction to some extent. So, it is necessary to study arrangement of pressure measurement points on bulkhead in order to make observed value of sensors reflect pressure of working chamber accurately. Then, it offers references to pressure dynamic balance control of working chamber and high efficiency of tunneling. At present, influenced by some factors such as operational environment and geological condition, detailed pressure distribution of working chamber cannot be obtained. Thus, there is not sufficient data to support arrangement of pressure measurement points, and the arrangement of pressure measurement points mainly depends on experience in design of EPBS. DEM (discrete element method) is a numerical method which simulates nonlinear problems about large strain and flow of geotechnical materials and so on. This method has been widely applied to simulating interaction between geotechnical materials and machine structure [11-16]. Therefore, DEM can be used to simulate pressure field of working chamber in order to obtain pressure values of bulkhead. It gives a basis for optimal arrangement of pressure measurement points.
In this work, definition and calculation method of equivalent pressure of working chamber are presented, and mathematical model of optimal arrangement of pressure measurement points is given at the same time. Then, according to the pressure of nodes from numerical method, fuzzy clustering analysis method is used to divide feasible region into some representative pressure regions. Based on BP network, discriminant analysis is used to categorize nodes of infeasible region into the pressure region mentioned above. Finally, optimal arrangement scheme of pressure measurement points is obtained through choosing key points from every pressure region. These works should give a theoretical basis to the design of EPBS and pressure control of working chamber.
2 Mathematical description of optimal arrangement of pressure measurement points in working chamber
2.1 Definition and calculation of equivalent pressure of working chamber
During construction, support pressure supplied by muck needs to keep balance with water-earth pressure of tunnel face in order to ensure stability of tunnel face (Fig. 1). Because support pressure and pressure of working chamber are all single equivalent value in construction, they are defined as equivalent support pressure and equivalent pressure of working chamber, respectively, in this work. The latter is also defined as equivalent pressure of bulkhead. The two equivalent pressures are all influenced by respective pressure distribution state.
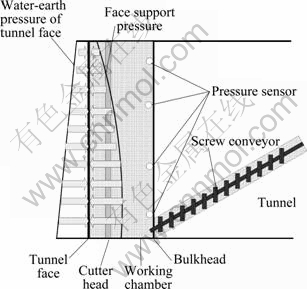
Fig. 1 Pressure balance theory of EPBS
Failures of tunnel face mainly present collapse and up-warping of ground surface. Thereby, support pressure should be in the range of limit support pressure of the two failure types. According to related theoretical analysis, the mechanical relation of acting on tunnel face by support pressure should satisfy [2-6]
 (1)
(1)
where ![]() is the load range of tunnel face stability, A is the area of tunnel face, pf(x, y) is pressure distribution function on tunnel face, and
is the load range of tunnel face stability, A is the area of tunnel face, pf(x, y) is pressure distribution function on tunnel face, and ![]() is equivalent support pressure and influenced by pressure distribution of muck on tunnel face.
is equivalent support pressure and influenced by pressure distribution of muck on tunnel face.
In existing idea, designer and operator supposed that support pressure distribution is linear. At the same time, they also supposed that distribution type and magnitude of support pressure and pressure on bulkhead are identical. Thus, pressure of central position of bulkhead is used as support pressure in advance in order to adjust control parameters. However, pressure on bulkhead is actually unequal to tunnel face pressure and its distribution is nonlinear [11, 13-14]. So, the later hypothesis is not valid, and there is insufficiency while support pressure obtained by existing method is used as control basis. Due to the influence of factors such as cutter head structure, pressure on bulkhead is unequal to tunnel face pressure, and relation between these two is
 (2)
(2)
where a is pressure transfer coefficient which relates to some factors such as machine structure, geological condition, a?(0,1]. ![]() is the equivalent pressure of working chamber. Dp is the pressure difference between bulkhead and tunnel face.
is the equivalent pressure of working chamber. Dp is the pressure difference between bulkhead and tunnel face.
Same as equivalent support pressure, equivalent pressure of working chamber is influenced by pressure distribution on bulkhead and equal to average pressure of bulkhead theoretically:
![]() (3)
(3)
where pb(x, y) is the pressure distribution function on the bulkhead; ![]() is the average pressure of bulkhead. If pressure distribution is linear, equivalent pressure of working chamber is equal to pressure of central position of bulkhead.
is the average pressure of bulkhead. If pressure distribution is linear, equivalent pressure of working chamber is equal to pressure of central position of bulkhead.
During tunneling construction, equivalent pressure of working chamber is the function of pressure of each measurement point. According to pressure distribution on bulkhead in vertical direction, bulkhead can be divided into n pressure regions, DAi (i=1, 2, 3, …, n). Moreover, average pressure of each pressure region is represented by pressure of a certain node in this region:
![]() (4)
(4)
where DAi is the area of the i-th pressure region and satisfies ![]() . pi is the pressure of a certain node in the i-th pressure region.
. pi is the pressure of a certain node in the i-th pressure region.
In Eq. (4), area of each pressure region reflects influence degree on equivalent pressure of working chamber from each node pressure. Let weight be
![]() (5)
(5)
Substituting Eq. (5) into Eq. (4), there is
![]() (6)
(6)
Based on Eqs. (2)-(6), equivalent support pressure could be obtained, and the key of solution is that the area of each pressure region and the weights of observed points are given reasonably. It is directly related to arrangement of pressure measurement point.
2.2 Establishment of objective function
On bulkhead, there are numerous candidate points which could be used to install sensors. In this work, these candidate points are defined as nodes. Due to restriction of shield structure, pressure sensors could not be installed on some regions of bulkhead. That is to say, nodes of these regions could not be the candidate locations for arrangement of pressure measurement points. Whether pressure sensors could be installed or not, bulkhead is classified into feasible and infeasible regions. As shown in Fig. 2, personnel lock Dif1, slewing bearing region of cutter head Dif2 and screw conveyor inlet Dif3 are all infeasible regions. The three infeasible regions are constraint conditions of optimal arrangement of pressure measurement points. The equivalent pressure of working chamber is obtained by the pressure of measurement points. This value should be quite close to the average pressure of bulkhead. For analyzing and comparing conveniently, mean absolute error ![]() between equivalent pressure of working chamber and average pressure of bulkhead is used to estimate the rationality of arrangement scheme:
between equivalent pressure of working chamber and average pressure of bulkhead is used to estimate the rationality of arrangement scheme:
![]() (7)
(7)
where m is the sampling number for pressure. It is not difficult to find that while ![]() is small, equivalent pressure
is small, equivalent pressure![]() is close to average pressure
is close to average pressure ![]() of bulkhead in construction. This indicates that arrangement scheme of sensors is much more reasonable.
of bulkhead in construction. This indicates that arrangement scheme of sensors is much more reasonable.
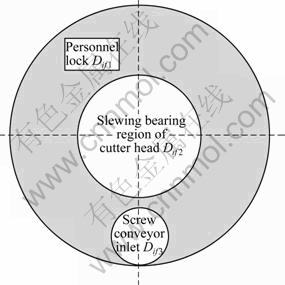
Fig. 2 Schematic diagram of bulkhead
In a word, the purpose of arrangement of pressure measurement points is to search reasonable locations (xi, yi) (1≤i≤n) to install sensors in feasible region, and then minimize mean absolute error of equivalent pressure. It can be described as mathematical model as follows:
 (8)
(8)
According to the analyses above, arrangement of pressure measurement points should meet the following requirements: 1) The measurement points should be definite representative of the pressure region; 2) The pressure of measurement points should be close to mean pressure of their respective pressure region. This shows that the key of satisfying above requirements is the confirmation of location of measurement points and the pressure regions which are represented by the measurement points. Based on pressure value of each node on bulkhead, the pressure value is obtained by simulating the pressure field of working chamber.
3 Division of pressure region
3.1 Division method of pressure region
Realization of the arrangement of the pressure measurement points relies on division of pressure region to bulkhead, and then the weights are presented reasonably by Eq. (6). However, there are two problems about division for pressure region with occurrence of infeasible regions Difk (k=1, 2, 3): 1) Some information of pressure field would be lost if influences of nodes of these regions are ignored in optimization process; 2) A certain pressure region might be in infeasible region in course of division for pressure region, but this condition is unfeasible in design. To solve the above problems, feasible region is divided into some representative pressure regions by using fuzzy clustering method. The nodes of infeasible region are categorized into these representative pressure regions by discriminant analysis in order to divide pressure regions for the whole bulkhead. The division process is shown in Fig. 3.
3.2 Division for nodes of feasible region
For n nodes of feasible region, a given sample set X={x1, x2, …, xn} is a data set of observed pressure of nodes in these regions, in each of which, xi=(xi1, xi2, …, xim) (i=1, 2, …, n) is observed vector of pressure of node i. This vector is multi-dimensional vector which is composed by pressure observed in a certain period of time among tunneling construction. Parameter m is the sampling number for pressure. Based on data of observed pressure of nodes, c pressure regions are divided according to fuzzy partition matrix U which is gotten by fuzzy clustering analysis. Fuzzy partition matrix U is described as
 (9)
(9)
where uhi?[0,1], represents the membership of the i-th node relative to the h-th cluster. The characters of uhi are as follows:
![]() ,
, ![]() (10)
(10)
FCM (fuzzy c-means) algorithm transforms solution of fuzzy membership matrix into a nonlinear programming problem with constraints. The objective function of FCM is to minimize the within-group sum of squared error [16]:
![]() (11)
(11)
where q is weighting exponent, V=(v1, v2, …, vc)T is cluster center, and ![]() denotes Euclidean distance between pressure node i and the k-th cluster center vk.
denotes Euclidean distance between pressure node i and the k-th cluster center vk.
On the assumption that optimal fuzzy partition matrix is U* which is gotten by iterative calculation, in this matrix, if the membership of a pressure node relative to a certain cluster center is maximum, the pressure node is categorized into this cluster: "xi?X in the i-th column of U*, if ![]() =max(
=max(![]() ) (1≤t≤c), node i should be categorized into pressure region h.
) (1≤t≤c), node i should be categorized into pressure region h.
3.3 Classification of pressure nodes of infeasible region
Theoretically, FCM can classify nodes of all regions straightly. Then, optimal pressure measurement points are obtained. But, when the data of infeasible region are too concentrated, this region may turn into one pressure region. The optimal pressure measurement points obtained in this condition are infeasible. In order to the avoid above-mentioned phenomenon, in allusion to feasible region and infeasible region, different classification methods are adopted in this work. Discriminant analysis is used to categorize nodes of infeasible region. Virtually, process of discriminant analysis is that c pressure regions which are divided from feasible region are served as target regions, and nodes of infeasible region are categorized into these target regions. In this work, three-layer BP network with multi-input and multi-output is used to conduct discriminant analysis [17-18]. The topological structure of network is shown in Fig. 4.
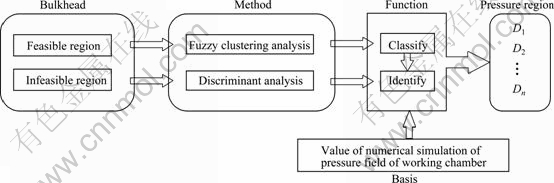
Fig. 3 Flow chart of division for pressure region
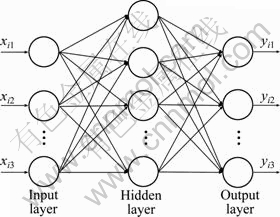
Fig. 4 Topological structure of three-layer BP network
In Fig. 4, m is the number of neurons of input layer. xi=(xi1, xi2, …, xim), is the pressure observed vector of node i. yi=(yi1, yi2, …, yic), is network output of node i, and it expresses pressure region that the node belongs to. c is the number of neurons of output layer, and it expresses the number of target region. If network input xi belongs to the h-th target region, there is
![]() (12)
(12)
4 Choice of pressure measurement points
According to the last classification results, center vector of every pressure region is calculated. For pressure region Di which has k nodes, its center vector is
![]() (13)
(13)
Theoretically, in each pressure region, node nearest to center vector should be chosen to be the key node. However, this node might be in infeasible region of bulkhead. Considering the requirement that the chosen nodes try to stand for the pressure region to which the chosen nodes belong, nodes which have minimum distance to center vector and are in feasible region are selected as final optimal arrangement points. Let pressure region Di include k nodes which belong to feasible region. If node s is the optimal arrangement point, then there is a condition:
![]() (14)
(14)
5 Case study
5.1 Simulation of pressure field of working chamber
In this work, a 6.28 m (diameter) EPBS employed in a certain project of metro is used as research object. DEM is used to simulate the pressure field of working chamber in order to obtain pressure values of bulkhead. The geometric model of numerical simulation is shown in Fig. 5. The cutter head open ratio is 32%, the length of working chamber is 0.9 m, the diameter of screw conveyor is 0.7 m, the pitch is 0.56 m, and the inclination angle is 22°.
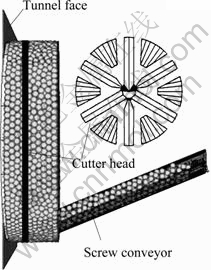
Fig. 5 Geometric model of EPBS
In numerical simulation, the particle diameter is 0.2 m, and the number of particles is about 12 000. The parameters of particles are shown as follows: the contact stiffness (normal and tangential contact stiffness Kn and Ks) is 100 kN/m, contact-bond strength (normal and tangential contact-bond strength Fcn and Fcs) is 0.3 N and friction coefficient fu is 0.5. Interactive relationship of each parameter is shown in Fig. 6.

Fig. 6 Contact model of conditioned soil
In tunneling construction, the tunnel depth is 20 m, the advance speed is 60 mm/min, the rotary speed of cutter head is 2 r/min and the rotary speed of screw conveyor is 10 r/min. According to the working conditions above, simulation parameter is set and numerical simulation of pressure field of working chamber is carried through. The comparison between simulation results and construction data are given in Table 1. Because the result of pressure simulation of observed points is similar with observed value of field, it is feasible and effective to simulate and analyze the pressure of working chamber by DEM.
Pressure distribution on bulkhead is nonlinear in vertical direction and the pressure gradient of upper part of bulkhead is larger than the pressure gradient of lower part. According to Fig. 7, due to the difference of pressure distribution at different time, pressure values are dynamically changed. So, the pressure of nodes in a certain period should be used as basis for division of pressure regions. The average pressures of bulkhead and tunnel face are extracted. By calculating in the light of Eq. (2), the pressure transfer coefficient is equal to 0.6.
5.2 Result of arrangement
On the whole bulkhead, 349 nodes are laid. The interval between horizontal and vertical directions of each node is 0.3 m equally, as shown in Fig. 8, and infeasible regions include 96 nodes. Otherwise, five triangular nodes are actual locations of pressure measurement points of the shield. Their coordinates are given in Table 1. The pressure values of nodes above could be obtained according to the simulation results. Because there are a lot of nodes, the pressure values are not listed detailedly here.
According to Table 1 and Fig. 8, existing pressure measurement points 2 and 3, 4 and 5 are placed symmetrically, and observed values of the two sensors in
each group are similar. The above phenomenon indicates that the two sensors laid symmetrically belong to the same pressure region. According to analysis, five pressure measurement points on bulkhead could merely represent three pressure regions in existing scheme. It is shown that pressure measurement point and pressure region is not in one-to-one correspondence in existing scheme. Therefore, in order to compare with existing arrangement scheme of pressure measurement points conveniently and estimate the validity of arrangement method in this work, bulkhead should be divided into three pressure regions to complete optimal arrangement of pressure measurement points.
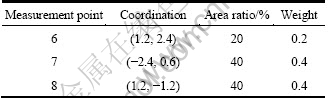
Firstly, based on the pressure sample value of each node of feasible region, FCM is used to divide feasible region into three target pressure regions. Secondly, classification results of 176 nodes of feasible region are input into BP network as learning samples, and network is used to achieve setting learning precision of 10-6 through training. Then, the rest data of nodes are input into network, and correct rate of test set is 98%. This shows that established network could be used to classify the pressure region of nodes of infeasible region. Finally, pressure observed vectors of nodes of infeasible region are input into network, and discriminant analyses of pressure regions of these nodes are completed. The three pressure regions D1, D2 and D3 are obtained finally (Fig. 9), and thereinto D1 is composed of D11 and D12. According to Eq. (14), the optimal positions of pressure measurement points are 6, 7 and 8. The coordinates of each node and region areas which these nodes stand for are given in Table 2.
Table 1 Comparison between simulation results and construction data
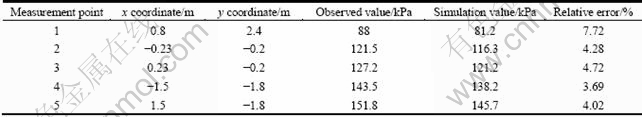
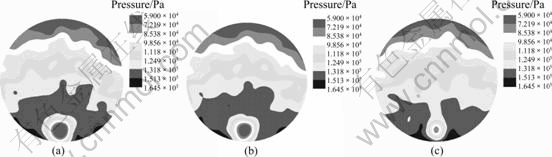
Fig. 7 Pressure distribution on bulkhead at different time

Fig. 8 Arrangement chart of pressure nodes on bulkhead
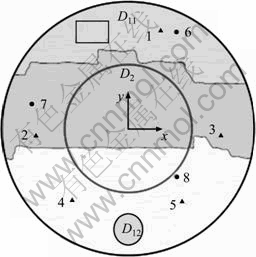
Fig. 9 Diagram of optimal pressure measurement points
Table 2 Result of optimal arrangement
5.3 Discussion
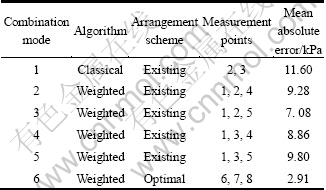
The calculated value of equivalent pressure of working chamber is mainly affected by algorithm of equivalent pressure, selection of calculated reference point, arrangement scheme of pressure measurement points and so on. In order to analyze and compare adequately, mean absolute error ![]() of equivalent pressure is calculated according to the combination mode of Table 3. The weighted algorithm for equivalent pressure of working chamber is shown in Eq. (6). However, classical algorithm considers that equivalent pressure is equal to mean pressure of measurement points 2 and 3 (Fig. 8):
of equivalent pressure is calculated according to the combination mode of Table 3. The weighted algorithm for equivalent pressure of working chamber is shown in Eq. (6). However, classical algorithm considers that equivalent pressure is equal to mean pressure of measurement points 2 and 3 (Fig. 8):
![]() (15)
(15)
The mean absolute errors obtained by weighted algorithm are all smaller than those obtained by classical algorithm. This illuminates that the new computing method of equivalent pressure of working chamber is comparatively exact. The foundation of classical algorithm is the linear distribution of pressure in working chamber. This algorithm ignores the influence on equivalent pressure of working chamber from observed values of other pressure measurement points. But, according to simulation results and actual data, the pressure distribution of working chamber is parabolic. The average pressure of bulkhead is smaller than mean pressure of measurement points 2 and 3. It will cause an increase of mean absolute error of equivalent pressure.
On the other hand, if screw conveyor revolves fast, a mass of muck is discharged and then the lower part of working chamber is empty. The pressure of measurement points of lower part will present downtrend. Under this condition, classical algorithm considers that control parameter is not necessary to be adjusted as long as the pressure of observed points of middle part of bulkhead satisfies set value. So, some abnormal working conditions may occur. However, equivalent pressure obtained by weighted algorithm is smaller than experience value. It is helpful to adjust control parameter of EPBS in time, and then abnormal working conditions are prevented. Thereby, it offers assurance to safety of tunneling.
Compared with other combination modes, the mean absolute error is decreased by 58%-75% in combination mode 6. This is to say, optimal arrangement scheme of pressure measurement points is feasible. Because Euclidean distance between optimal arrangement points and center vector of pressure region is small, these points can represent the mean pressure of the region much more in tunneling construction. So, the mean absolute error of equivalent pressure of working chamber is the smallest in this method. In a word, location of optimal arrangement points should be considered in design of EPBS in order to install pressure sensors.
In vertical direction, the widths of region D1, D2 and D3 are 1.5, 2.1 and 2.7 m, respectively. It is closely linked to the influence on pressure variation of bulkhead from discharging muck by screw conveyor. Due to smaller influence on region D1 from discharging muck, vertical pressure gradient of region D1 is large. This causes that Euclidean distances among nodes of region D1 are relatively large. Thus, the width of region D1 is the smallest in vertical direction. With the influence on other pressure regions from discharging muck increasing, vertical pressure gradient becomes smaller. This causes that Euclidean distances among nodes of the other pressure regions decrease. And then, the vertical widths of regions D2 and D3 increase gradually. Thus, pressure distribution on bulkhead is close to parabola, as shown in Fig. 10. The mean point of each pressure region should be in upper part of the pressure region. However, existing measurement points of regions D2 and D3 are all in lower part of each pressure region, and the pressure of existing measurement points is larger than mean pressure of each region. So, the equivalent pressure calculated by existing observed points is larger.
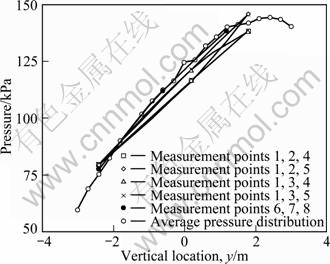
Fig. 10 Curves of pressure distribution
Table 3 Mean absolute error
The pressure variation on bulkhead reflected by different combinations of observed points are shown in Fig. 10. By contrast, pressure values on bulkhead reflected by existing measurement points present linearity variation. However, pressure curve shown by optimal arrangement points is similar to parabola, and it can show the state of pressure distribution on bulkhead truly. Thereby, in order to reflect information of pressure distribution in working chamber, arrangement points obtained by optimal method are also used as pressure measurement points.
6 Conclusions
1) Using d6.28 m EPBS as study object, pressure distribution of working chamber is obtained by adopting discrete element method. Compared to construction data, numerical simulation method is feasible, and pressure transfer coefficient between working chamber and tunnel face is 0.6.
2) Through comparing mean absolute error of equivalent pressure of working chamber, it can be found that equivalent pressure obtained by weighted algorithm is comparatively exact. Moreover, validity of this algorithm is proved from the view of construction control. Using optimal arrangement scheme as calculation basis, the mean absolute error of equivalent pressure is the smallest by adopting weighted algorithm. This indicates that the optimal arrangement method of pressure measurement points of working chamber is feasible.
3) Under influence of discharging muck by screw conveyor, pressure distribution of working chamber presents parabola, and then pressure measurement point should be in upper part of each pressure region. At the same time, pressure curve of optimal arrangement of pressure measurement points presents parabola, and it can show the state of pressure distribution on bulkhead truly.
References
[1] BABEBDERERDE S. Tunnelling machines in soft ground: A comparison of slurry and EPB shield systems [J]. Tunnelling and Underground Space Technology, 1991, 6(2): 169-174.
[2] LECA E, DORMIEUS L. Upper and lower bound solutions for the face stability of shallow circular tunnels in frictional material [J]. Geotechnique, 1990, 40(4): 581-606.
[3] LEE I M, NAM S W. The study of seepage forces acting on the tunnel lining and tunnel face in shallow tunnels [J]. Tunnelling and Underground Space Technology, 2001, 16(1): 31-40.
[4] LEE I M, NAM S W, JAE H A. Effect of seepage force on tunnel face stability [J]. Canadian Geotechnical Journal, 2003, 40(2): 342-350.
[5] ANAGNOSTOU G, KOVAR K. Face stability conditions with earth-pressure-balanced shields [J]. Tunnelling and Underground Space Technology, 1996, 11(2): 165-173.
[6] BROERE W. Tunnel face stability new CPT application [D]. Delft: Delft University of Technology, 2001.
[7] HUANG Zheng-rong, ZHU Wei, LIANG Jing-hua, QIN Jian-she. A study on the limit support pressure at excavation face of shield tunneling [J]. China Civil Engineering Journal, 2006, 39(10): 112-116. (in Chinese)
[8] KIM S H, TONON F. Face stability and required support pressure for TBM driven tunnels with ideal face membrane-Drained case [J]. Tunnelling and Underground Space Technology, 2010, 25(5): 526-542.
[9] YEH I C. Application of neural networks to automatic soil pressure balance control for shield tunneling [J]. Automation in Construction, 1997, 5: 421-426.
[10] YANG Hua-yong, SHI Hu, GONG Guo-fang, HU Guo-liang. Earth pressure balance control for EPB shield [J]. Science in China Series E: Technological Sciences, 2009, 52(10): 2840-2848.
[11] NEZAMI E G, HASHASH Y M A, ZHAO Da-wei, GHABOUSSI J. Simulation of front end loader bucket-soil interaction using discrete element method [J]. International Journal for Numerical and Analytical Methods in Geomechanics, 2007, 31: 1147-1162.
[12] CLEARRY P W. DEM simulation of industrial particle flows: Case studies of dragline excavators, mixing in tumblers and centrifugal mills [J]. Powder Technology, 2000, 109: 83-104.
[13] MELIS M AYNAR M J, MEDINA RODRIGUEZ L E. Discrete numerical model for analysis of earth pressure balance tunnel excavation [J]. Journal of Geotechnical and Geoenvironmental Engineering, 2005, 131(10): 1234-1242.
[14] WU Li, QU Fu-zheng. Discrete element simulation of mechanical characteristic of conditioned sands in earth pressure balance shield tunneling [J]. Journal of Central South University of Technology, 2009, 16(6): 1028-1033.
[15] WU Li, QU Fu-zheng, SUN Wei1, LI Shou-ju, LIU Chang. Discrete numerical model for analysis of chamber pressure of earth pressure balance shield machine [J]. Chinese Journal of Geotechnical Engineering, 2009, 28(5): 553-557. (in Chinese)
[16] GAO Xin-bo, XIE Wei-xin. Advances in theory and applications of fuzzy clustering [J]. Chinese Science Bulletin, 2000, 45(11): 961-970.
[17] PALIWAL M, KUMAR U A. Neural networks and statistical techniques: A review of applications [J]. Expert Systems with Applications, 2009, 36(1): 2-17.
[18] YOON Y, JR G S, MARGAVIO T M. A comparison of discriminant analysis versus artificial neural networks [J]. Journal of the Operational Research Society, 1993, 44(1): 51-60.
(Edited by YANG Bing)
Foundation item: Project(2007CB714006) supported by the National Basic Research Program of China
Received date: 2011-04-28; Accepted date: 2011-09-19
Corresponding author: LIU Chang, PhD Candidate; Tel: +86-13795197556; E-mail: lc_dlut@yahoo.cn

