J. Cent. South Univ. (2012) 19: 2286-2290
DOI: 10.1007/s11771-012-1273-1
Characteristics of humin fractions associated with inorganic minerals obtained by NaOH, and NaOH assisted with anthraquinone extraction procedures
HAN Gui-hong(韩桂洪), JIANG Tao(姜涛), HUANG Yan-fang(黄艳芳),
ZHANG Yuan-bo(张元波), LI Guang-hui(李光辉)
School of Minerals Processing and Bioengineering, Central South University, Changsha 410083, China
? Central South University Press and Springer-Verlag Berlin Heidelberg 2012
Abstract: The differences in XRD patterns, elemental compositions, FT-IR spectra and TG-DSC curves of extract residues obtained by NaOH, and NaOH assisted with anthraquinone (AQ) extraction procedures were studied. The extract residues are mainly comprised of humin fractions associated with inorganic minerals. XRD analysis shows that there is no typical peak of organic carbon because those organic humin fractions appear as a highly disordered substance. The peak of quartz is dominant. The elementary analysis shows that assistant AQ in NaOH solution can break the link of organic humic substances with inorganic minerals. And aromatization degree of humin fractions obtained by NaOH is smaller than that obtained by NaOH assisted with AQ. FT-IR analysis displays that various groups exist in those two humin fractions obtained by different extraction procedures. There are some differences in FT-IR curves between two humin fractions. TG-DSC analysis shows that thermal decomposition occurs during the heating of testing samples. By contrast, the humin fractions associated with inorganic minerals obtained by NaOH possess a higher thermal decomposition range.
Key words: organic binder; humin fraction; infrared spectrum; oxidized pellets
1 Introduction
Various binders are traditionally employed to the pelletizing process of fine iron concentrates [1-2]. Lots of organic binders involving in cellulose, starch and gum have been applied in the pelletizing process in Lab. Pelletizing results showed that the quality of green pellets was obviously enhanced by organic binder [3-4]. But those binders are characterized by great cost. Recently, one novel type of organic humic substances- based binder (namely MHA binder) has been proved by laboratory studies and industrial applications to be fitted for producing oxidized pellets in China [5-6]. Therefore, MHA binders are considered as a suitable replacement for the existing organic binders or inorganic bentonite.
MHA binders can be prepared from lignite, weathered coal, and peat by adopting NaOH extraction procedure [7-8]. As well known, the main humic fractions of lignite are fulvic acids (soluble under all pH conditions), humic acids (insoluble under acid conditions) and humin fractions associated with inorganic minerals (insoluble in any pH condition) [9]. In general, MHA binders are composed of alkali soluble humic substances (fulvic and humic acids). Humin fractions associated with inorganic minerals as residue are removed from the extract mixture by filtering. Because of low extraction yields of humic substances from inferior lignite with NaOH, a new extraction procedure using NaOH assisted with anthraquinone (AQ) was developed to improve the extraction yields. The characteristics of assistant AQ improving the extraction process of humic substances from lignite and the functional mechanisms of AQ have been discussed in former documents [7]. The differences in characteristics of MHA binders obtained from different extraction procedures have also been studied. Study results showed that the MHA binder obtained in the presence of 0.75% (mass fraction) AQ possesses more groups of ―COOR and ―COOH than the MHA binder obtained without AQ. And assistant AQ can prevent soluble humic substances from being destroyed into insoluble fractions by NaOH [10]. The extracted residues are mainly composed of humin fractions associated with inorganic minerals. However, the characteristics of extract residues have not been fully studied.
In this work, the differences in XRD patterns, elemental compositions, FT-IR spectra and TG-DSC curves of extract residues obtained by NaOH, and NaOH assisted with AQ extraction procedures were mainly studied. These findings would be beneficial to further understanding of the function of AQ.
2 Materials and methods
2.1 Materials
The humin fractions associated with inorganic minerals were respectively obtained by NaOH, and NaOH assisted with AQ extraction procedures from a lignite sample. The extraction procedures have been given in detail in Ref. [8]. The separation procedure of humin fractions associated with inorganic minerals by NaOH is described by the following steps. Under the condition of extraction temperature 100 ℃, extraction time 60 min, solid-liquid ratio 1:3, stirrer speed 600 r/min, NaOH-to-lignite ratio 12%, the humin fractions associated with inorganic minerals were separated from the extract mixture by filtering, and then named as Humin-1 subsequently. The separation procedure of humin fractions associated with inorganic minerals by NaOH assisted with AQ is described as follows. Under the condition of extraction temperature 80 ℃, extraction time 30 min, solid-to-liquid ratio 1:3, stirrer speed 600 r/min, NaOH-to-lignite ratio 9%, assistant AQ dose 0.75%, the humin fractions associated with inorganic minerals were separated from the extract mixture by filtering, and then named as Humin-2 subsequently. Then, the two humin fractions associated with inorganic minerals were dried at 60 ℃ to a constant weight and ground to <75 μm in grain size for further analysis.
2.2 Experimental methods
The samples were analyzed by XRD (3014-Z2) for determination of the phase composition.
The elementary analysis of sample was conducted by Model PE2400 CHN Hydrocarbon Elemental Analyzer. Fly ash was obtained when sample was heated at 750 ℃ for 4 h in a muffle furnace.
The infrared spectra of samples were recorded by adopting a Model FTS740 series Fourier Transform Infrared Spectrometer from Digilab operating in the range of 4 000-400 cm-1. The KBr pellet technique was adopted for recording the spectrum. Approximately 1 mg sample was thoroughly mixed with 100 mg of spectroscopic grade KBr and pressed into pellets for recording the spectrum.
For TG-DSC testing, one-hundred milligram of each sample was placed into an aluminium crucible in a NETZSCH STA 409 Simultaneous Thermal Analyser. Al2O3 was used as reference material. Samples were heated from ambient temperature up to 1 200 ℃ at a constant rate of 5 ℃/min in a 150 cm3/min flow of nitrogen (N2).
3 Results and discussion
3.1 Characteristics of humin fractions associated with inorganic minerals by XRD and elementary analysis
The XRD patterns of humin fractions associated with inorganic minerals are shown in Fig. 1.
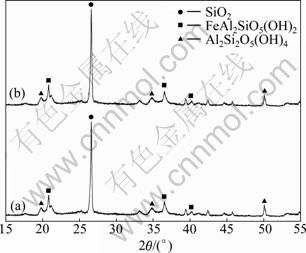
Fig. 1 XRD patterns of humin fractions associated with inorganic minerals: (a) Humin-1; (b) Humin-2
From Fig. 1, the XRD pattern of Humin-1 is similar to that of Humin-2. There is no peak of organic carbon. The results indicate that those organic humin fractions can not be observed because those organic humin fractions appear as a highly disordered substance. The peak of quartz (SiO2) at 2θ=27° is dominant in the XRD patterns. The results in Fig. 1 indicate that the inorganic minerals are mainly composed of quartz.
The elementary analysis result of humin fractions associated with inorganic minerals is listed in Table 1. It further confirms that the inorganic minerals appear mainly in the forms of quartz. And the content of quartz in Humin-2 is much higher than that in Humin-1. As mentioned before in Ref. [10], the MHA binder extracted in the presence of assistant AQ owns less inorganics than that extracted without assistant AQ. Therefore, it can be concluded that the assistant AQ in NaOH solution can also destroy the link of organic humic substances with inorganic minerals besides protecting those fractions of soluble organic humic substances.
C/H atomic ratio is a measurement of aromatization degree of organic matter. Aromatization degree increases with the increase of C/H ratio [11-12]. It can be calculated that, C/H ratio of humin fractions in Humin-1 is 3.71 and C/H ratio of humin fractions in Humin-2 is 4.19. It is shown that aromatization degree of humin fractions in Humin-1 is smaller than that in Humin-2. These results reveal that the MHA binder obtained in the presence of assistant AQ has a higher aromatization degree than that obtained without AQ. And this conclusion has been confirmed in former study [10].
Table 1 Elementary analysis result of humin fractions associated with inorganic minerals (mass fraction, %)

3.2 Characteristics of humin fractions associated with inorganic minerals by FT-IR analysis
The characteristics of humin fractions associated with inorganic minerals were researched by means of FT-IR spectroscopy. The FT-IR results of Humin-1 and Humin-2 are respectively shown in Figs. 2 and 3.
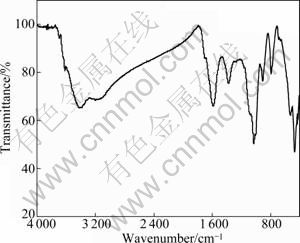
Fig. 2 FT-IR of humin fractions associated with inorganic minerals obtained by NaOH
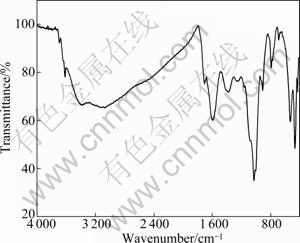
Fig. 3 FT-IR of humin fractions associated with inorganic minerals obtained by NaOH assisted with AQ
The explanations for main adsorption peaks of Humin-1 in Fig. 2 are summarized in Table 2. It can be seen from Fig. 2 that those absorption peaks at 3 425 cm-1 and 3 167 cm-1 in Humin-1 are attributed to stretching of ―OH groups. The absorption peaks at 1 729 cm-1 and 1 579 cm-1 are respectively attributed to aromatic ―C=C in benzene ring and ―COO-. The absorption peak at 1 380 cm-1 is mainly attributed to C―O and ―OH of ―COOH. The absorption peaks at 1 053, 527 and 478 cm-1 are mainly caused by Si―O of inorganic matters. Absorption peak at 785 cm-1 is mainly responsible for C―O of phenolic groups and aromatic C―H.
Table 2 Explanations for adsorption peaks of humin fractions associated with inorganic minerals obtained by NaOH
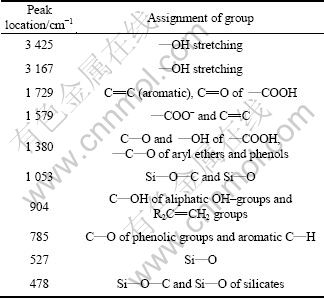
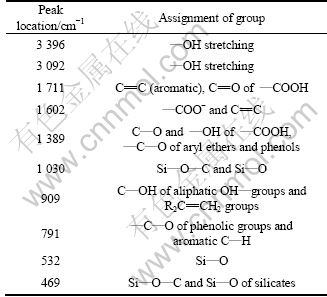
The explanations for main adsorption peaks of Humin-2 in Fig. 3 are summarized in Table 3. As shown in Fig. 3, the absorption peaks at 3 396 cm-1 and 3 092 cm-1 in Humin-2 are attributed to stretching of ―OH groups. The absorption peaks at 1 711 cm-1 and 1 602 cm-1 are respectively attributed to aromatic ―C=C in benzene ring and ―COO-. The absorption peak at 1 380 cm-1 is mainly attributed to C―O and ―OH of ―COOH. The absorption peaks at 1 030, 532 and 469 cm-1 are mainly caused by Si―O of inorganic matters. The absorption peak at 791 cm-1 is mainly responsible for C―O of phenolic groups and aromatic C―H.
Compared Humin-1 with Humin-2, there are differences in FT-IR characteristics. The relative peak intensity reflects the relative amount of each group in FT-IR spectrum [13-16]. The spectra in Figs. 2 and 3 show that adsorption peak around 3 400 cm-1 for Humin-2 is weaker than that for Humin-1. This indicates that Humin-1 possesses much more organic fractions of humic substances with ―OH. In addition, the adsorption peak at 1 053 cm-1 in Fig. 2 is weaker than adsorption peak at 1 030 cm-1 in Fig. 3. The result indicates that Humin-2 possesses much more inorganic fractions with Si―O. This is in accordance with XRD and elementary analysis.
Table 3 Explanations for adsorption peaks of humin fractions associated with inorganic minerals obtained by NaOH assisted with AQ
3.3 Characteristics of humin fractions associated with inorganic minerals by TG-DSC analysis
The characteristics of humin fractions associated with inorganic minerals were also studied by means of TG-DSC technology. The TG-DSC results of Humin-1 and Humin-2 are respectively displayed in Figs. 4 and 5.
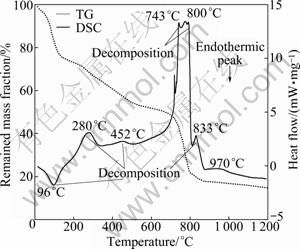
Fig. 4 TG-DSC of humin fractions associated with inorganic minerals obtained by NaOH
As displayed in Fig. 4, the TG-DSC curves indicates the loss of adsorbed water of Humin-1 (endothermic reactions at 96 ℃), some thermal decomposition (endo- thermic effects at 100-280 ℃, and 280-452 ℃), continuing intense thermal decomposition (endothermic effects at 452-743 ℃, and exothermic reactions at 743- 800 ℃), and last thermal decomposition (endothermic effects around 833 ℃). The mass loss of 22% is a result of dehydration of the Humin-1 (up to 100 ℃); the mass loss of 28% is due to combustion and decomposition reactions of Humin-1 (100-743 ℃); continuing combustion and decomposition of residual Humin-1 (743-833 ℃) is responsible for the max mass loss of 32%; the inorganic minerals (ash) of Humin-1 are about 18%.
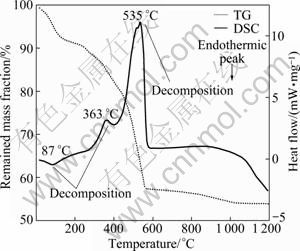
Fig. 5 TG-DSC of humin fractions associated with inorganic minerals obtained by NaOH assisted with AQ
As shown in Fig. 5, the TG-DSC curve shows the loss of adsorbed water of Humin-2 (endothermic reactions at 87 ℃), a spot of thermal decomposition (endothermic effects at 100-363 ℃), and continuing intense thermal decomposition (endothermic effects at 363-535 ℃). The mass loss of 8% is a result of dehydration of the Humin-2 (up to 100 ℃); the mass loss of 17% is because of combustion and decomposition reactions of Humin-2 (100-500 ℃); continuing strong combustion and decomposition of residual Humin-2 (500-535 ℃) is responsible for the max mass loss of 32%; the inorganic minerals (ash) of Humin-2 are about 53%.
Compared with TG-DSC of Humin-2, it is clear that Humin-1 has a higher thermal decomposition range. The thermal decomposition temperature of Humin-2 is from 100 ℃ to 550 ℃. And the most decomposition of Humin-2 occurs between 266 ℃ and 363 ℃. But thermal decomposition of Humin-1 ranges from 100 ℃ to 900 ℃. And the most decomposition of Humin-1 is between 200 ℃ and 900 ℃.
4 Conclusions
1) The XRD pattern of Humin-1 is similar to that of Humin-2. There is no peak of organic carbon because those organic humin fractions appear as a highly disordered substance. The peak of quartz (SiO2) is dominant in the XRD patterns. The elementary analysis shows that assistant AQ in NaOH solution can destroy the link of organic humic substances with inorganic minerals. The content of quartz in Humin-2 is much higher than that in Humin-2. And aromatization degree of humin fractions in Humin-1 is smaller than that in Humin-2.
2) FT-IR analysis displays that various groups exist in the humin fractions associated with inorganic minerals. However, there are some differences in FT-IR characteristics between Humin-1 and Humin-2. Adsorption peak around 3 400 cm-1 for Humin-2 is weaker than that for Humin-1. Humin-1 possesses much more organic fractions of humic substances with ―OH. In addition, Humin-2 possesses much more inorganic fractions with Si―O.
3) TG-DSC analysis shows that thermal decomposition occurs during the heating of humin fractions associated with inorganic minerals. Compared with Humin-2, Humin-1 possesses a higher thermal decomposition range. The thermal decomposition temperature of Humin-2 ranges from 100 ℃ to 550 ℃. And the most decomposition of Humin-2 is between 266 ℃ and 363 ℃. But thermal decomposition of Humin-1 is from 100 ℃ to 900 ℃. And the most decomposition of Humin-1 is between 200 ℃ and 900 ℃.
References
[1] ALLEN A P. The role of binders in the agglomeration of minerals [C]// Proceeding of 5th International Symposium on Agglomeration, Brighton. UK: Institute of Chemical Engineers, 1989: 220-229.
[2] KAWATRA S K, RIPKE S J. Laboratory studies for improving green-ball strength in bentonite-bonded magnetite concentrate pellets [J]. International Journal of Mineral Processing, 2003, 72(1/2/3/4): 429-441.
[3] HAAS A L, ALDINGER J A, NIGRO J C. Utilization of papermill sludges as binders for iron ore concentrate [R]. Report of Investigations, United States Bureau of Mines, 1989, No. 9257.
[4] ZHANG Yong-xiang, TIAN Fa-chao, HANG Ke-cheng, ZHAO Heng. Pelletizing test of adding various complex binders [J]. Sintering and Pelletizing, 2004, 29(5): 9-11. (in Chinese)
[5] HAN Gui-hong, ZHANG Yuan-bo, HUANG Yan-fang, LI Guang-hui, JIANG Tao. Adsorption behaviors of humic substances onto iron ore particle surface [C]// Proceedings of XXV International Mineral Processing. Brisbane, Australia: The Australasian Institute of Mining and Metallurgy, 2010: 163-171.
[6] HAN Gui-hong, ZHANG Yuan-bo, JIANG Tao, HUANG Yan-fang, LI Guang-hui. Effects of binders on oxidized pellets preparation from vanadium/titanium bearing magnetite [C]// 2nd International Symposium on High-Temperature Metallurgical Processing. Hoboken, NJ, USA: John Wiley & Sons, Inc., 2011: 279-287.
[7] JIANG Tao, HAN Gui-hong, ZHANG Yuan-bo, HUANG Yan-fang, LI Guang-hui, GUO Yu-feng, YANG Yong-bin. Improving the extraction yield of humic substances (HS) from lignite with anthraquinone (AQ) in alkaline solution [J]. Journal of Central South University of Technology, 2011, 18(1): 68-72.
[8] GAO Deng-zheng, WANG Li, LIU Li-hua, LU Jing-ping. Technologic experiment study of humic acid extracted from wali lignite [J]. Journal of Shandong University of Science and Technology, 2005, 24(3): 40-42. (in Chinese)
[9] THURMAN E M, MALCOLM R L. Preparative isolation of aquatic humic substances [J]. Environmental Science and Technology, 1981, 15(4): 463-466.
[10] ZHANG Yuan-bo, HAN Gui-hong, JIANG Tao, HUANG Yan-fang, LI Guang-hui, GUO Yu-feng, YANG Yong-bin. Structure characteristics and adhesive property of humic substances (HS) extracted with different methods [J]. Journal of Central South University of Technology, 2011, 18(4): 1041-1046. (in press)
[11] LIU Guo-gen, QIU Guan-zhou, HU Yue-hua. Study on spectroscopy of HA type binder [J]. Journal of Central South University: Science and Technology, 2003, 34(3): 238-241. (in Chineese)
[12] PEURAVUORI J, PIHLAJA K. Molecular size distribution and spectroscopic properties of aquatic humic substances [J]. Analytica Chimica Acta, 1997, 337(2): 133-149.
[13] Henrique R. Oxidation of humic substances of peat during alkaline extraction: Infrared and visible spectroscopic study [J]. Quim Nova, 1998, 47(l): 25-28.
[14] TATZBER M, STEMMER M, SPIEGE H, KATZLBERGER C, HABERHAUER G, MENTLER A, GERZABEK M H. FTIR-spectroscopic characterization of humic acids and humin fractions obtained by advanced NaOH, Na4P2O7, and Na2CO3 extraction procedures [J]. Journal of Plant Nutrition and Soil Science, 2007, 170(4): 522-529.
[15] LIU Guo-gen, QIU Guan-zhou, HU Yue-hua. Study on infrared spectra of coals [J]. Journal of Central South University: Science and Technology, 1999, 30(4): 371-373. (in Chinese)
[16] CONTE P, PICCOLO A. Conformational arrangement of dissolved humic substances: Influence of solution composition on association of humic molecules [J]. Environmental Science and Technology, 1999, 33(10): 1682-1690.
(Edited by DENG Lü-xiang)
Foundation item: Project(50725416) supported by the National Natural Science Funds for Distinguished Young Scholars of China; Projects(CX2009B035, CX2010B063) supported by Graduate Degree Thesis Innovation Foundation of Hunan Province, China
Received date: 2011-06-23; Accepted date: 2011-09-27
Corresponding author: HAN Gui-hong, PhD; Tel: +86-731-88830542; E-mail: guihong-han@hotmail.com

