
Impedance spectroscopy study of high-temperature oxidation of Gd2O3-Yb2O3 codoped zirconia thermal barrier coatings
ZHANG Dan-hua, GUO Hong-bo, GONG Sheng-kai
School of Materials Science and Engineering, Beijing University of Aeronautics and Astronautics,
Beijing 100191, China
Received 18 October 2010; accepted 6 December 2010
Abstract: 3Gd2O3-3Yb2O3-4Y2O3 (mole fraction, %) co-doped ZrO2 (GY-YSZ) thermal barrier coatings (TBCs) were produced by electron beam physical vapor deposition (EB-PVD). The oxidation behavior of GY-YSZ at 1 050 °C was investigated using impedance spectroscopy (IS) combined with scanning electron microscopy (SEM), Raman spectroscopy and X-ray diffractometry (XRD). Various electrical responses observed in the impedance spectra corresponding to GY-YSZ grains and grain boundaries were explained using circuit modeling. The change in the conduction mechanism of GY-YSZ was found to be related to the O2- vacancy and lattice distortion due to the stabilizer diffusion during the oxidation. The results also suggested that the specific oxidation information about the GY-YSZ grains and grain boundaries should be acquired at a moderate measurement temperature, which was related to the resistance value in the impedance spectra. The resistance values of the GY-YSZ grains and grain boundaries should be measured at 200 °C and 300 °C, respectively.
Key words: rare earth oxide; Gd2O3; Yb2O3; thermal barrier coatings (TBCs); oxidation; impedance spectroscopy (IS)
1 Introduction
Thermal barrier coating (TBC) is a surface thermal protection technology, which can reduce metal service temperature, promote the corrosion and oxidation resistance properties at high temperature and improve durability[1-2]. In the last two decades, more and more efforts have been devoted to the development and manufacture of ceramic TBCs in gas turbines[3]. The traditional yttria stabilized zirconia (YSZ) TBCs are prone to be sintered at temperatures higher than 1 200 °C for increasing thermal conductivity and making them less effective. The sintered and densified coatings can also reduce thermal stress/strain tolerance, which can significantly reduce the durability of coatings. Therefore, new TBC materials are under investigation to further increase the inlet temperature of the turbine engines with a consequent improvement in efficiency, such as, lower thermal conductivity and better sintering resistance[4-9].
Recently, rare earth (RE) oxide doped zirconia TBCs have attracted increasing attention because of their excellent capability in thermal barrier property and sintering resistance as compared to the traditional YSZ TBC. ZHU[10], NICHOLLS et al[11] and KAN et al[12] found that co-doped YSZ with one or more oxides (Yb2O3, Gd2O3, Nd2O3, Sm2O3, Er2O3, NiO, etc) resulted in lower thermal conductivity, what is more, the Gd2O3 and Yb2O3 co-doped compositions showed the lowest thermal conductivity. WEI et al[13] prepared a novel Gd2O3-Yb2O3 codoped YSZ/YSZ double ceramic layered TBC by EB-PVD, which effectively promoted the thermal cycling lifetime of the TBCs.
However, non-destructive evaluation of degradation of these new TBCs has less been reported, which is identified as a prospective detection measurement in predicting residual life time of TBCs after service. As a relatively mature, cheap, and simple technique for non-destructive testing, impedance spectroscopy (IS) has been used to study electrolyte materials, among which the best known is zirconia-based ceramics[14-15]. Impedance spectra can be interpreted to characterize the electrical properties of the materials and relate the changes in these electrical properties to microstructural changes occurring in the materials. Impedance spectra of TBCs reflect changes in TBC thickness, porosity, cracks, sintering, and yttria-stabilized zirconia phase trans- formation[16]. Meanwhile, impedance measurements
indicate the thermally grown oxide growth and the failure in TBCs[17].
In this work, 3Gd2O3-3Yb2O3-4Y2O3 co-doped ZrO2 (GY-YSZ) TBCs were produced by EB-PVD. IS measurement was used as a non-destructive approach for characterizing the high-temperature oxidation of GY-YSZ TBCs, from which the electrical properties of the GY-YSZ coatings were studied, including conduction mechanism and resistance of components of the GY-YSZ TBCs.
2 Experimental
The topcoatings were 3Gd2O3-3Yb2O3-4Y2O3 co-doped ZrO2 (GY-YSZ) with 100 μm in thickness, and deposited simultaneously on NiCoCrAlY bond-coated K3 superalloy. Those specimens were heated in a chamber furnace to1 050 °C and oxidized for 4 h and 50 h. A same specimen was used under impedance measurements for every oxidation condition. In order to acquire oxidation information about the topcoating, the electric circuit in the experiment was designed, as shown in Fig.1. The measurement temperatures were 200, 250, 300, 350 and 400 °C, respectively.

Fig.1 Scheme of electric circuit in experiment
Impedance spectra were measured for the TBC in air using a Solartron SI 1260 Impedance/Gain-Phase analyzer coupled with a 1296 Dielectric Interface (Solartron, UK). AC voltage was applied to TBC samples with frequency from 106 to 10-1 Hz. Microstructures of those specimens were examined on a CS3400 scanning electron microscope equipped with an LINKS energy dispersive X-ray micro-analyzer (EDX). XRD analysis was carried out for as-received and oxidized specimens. XRD patterns were recorded at room temperature using a step scan procedure (0.02(°)/2θ step) in 2θ of 10°-90° on a Regaku D/Max 2200PC automated diffractometer equipped with a crystal monochromator employing Cu Kα1 radiation. The measurement of a Raman spectrum was conducted at room temperature on a Renishaw RM2000 automated spectrometer by using a He-Ne laser (wavelength: 632.8 nm) and nominal resolution of the spectrometer was 0.1 cm-1 throughout the measurement wavenumber range of 100-800 cm-1.
3 Results and discussion
3.1 Microstructure
Figure 2 shows SEM images of cross-sections of as-received specimens and oxidized specimens in air at 1 050 °C. There is no detectable longitudinal crack present in the topcoat in the as-received specimen but in the oxidized ones. The more obvious evidence is found in Fig.3, which provides the surface-sections of the same specimen. After oxidation of 50 h, the SEM image of the surface exhibits more longitudinal cracks as compared with that after oxidation of 4 h.
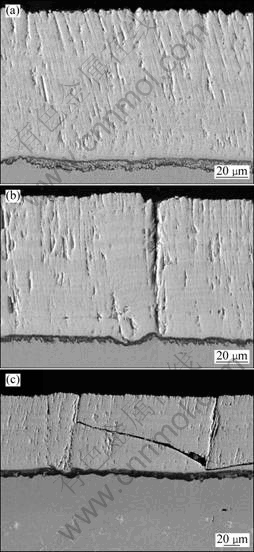
Fig.2 SEM images of cross-sections of as-received (a) and oxidized TBCs in air at 1 050 °C for 4 h (b) and 50 h (c)
3.2 Electrical properties and microstructural features
The electrical properties of specimens were measured using impedance measurements. Impedance spectra were acquired by measuring the magnitude and phase shift of the resulting current. There are two types of impedance diagrams, namely Nyquist plots and Bode plots[18]. In a Nyquist plot, the impedance is represented by a real part Z′ and an imaginary part Z″ with the formula  , where
  . In a Bode plot, the modulus of the impedance and the phase angle are both plotted as a function of frequency. For a simple resistor-capacitor (R-C) circuit, the Nyquist plot is characterized by a single semicircle. However, for a multi-R-C circuit, the Nyquist plot would consist of several semicircles that may partially overlap to each other. Usually, the Nyquist plot is used to determine major parameters, such as resistance and capacitance corresponding to an electrochemical system by fitting the measured spectra according to an equivalent circuit, which is a representative of the microstructural features of the materials under examination[18-19].

Fig.3 Surface morphologies of TBCs: (a) As-received; (b) Oxidized at 1 050 °C for 4 h; (c) Oxidized at 1 050 °C for 50 h
Normally, the impedance spectrum of a polycrystalline ceramic material is expected to have two semicircular arcs, one resulted from grain and another from grain boundary. However, a coincident relationship between the simulated result and the measured spectrum cannot be established by using this kind of model. Considering the structure of columnar crystals in as-received GY-YSZ and the longitudinal cracks in oxidized YSZ, two more reasonable equivalent circuits in this experiment were modeled (Fig.4). The spectra of the as-received sample can be simulated based on an equivalent circuit consisting of three (R-C) components, which correspond to GY-YSZ grains (Rgi), GY-YSZ grain boundary (Rgb) and GY-YSZ columnar boundary (Rcb). While the Bode spectra for the specimens oxidized for 4 h or more can be simulated based on a model of four R-C components, corresponding to GY-YSZ grains (Rgi), GY-YSZ grain boundary (Rgb), GY-YSZ columnar boundary (Rcb) and the longitudinal cracks (Rc) in GY-YSZ, respectively. With the above models, typical fitted results for as-received and the 50 h-oxidized specimens are shown in Fig.5.

Fig.4 Equivalent circuits of three R-C components for as-received specimen (a) and four R-C components for specimen oxidized for 4 h or longer (b)

Fig.5 Simulated spectrum based on equivalent circuit model and measured spectrum of as-received and oxidized samples in air at 1 050 °C for 50 h
The phase angles are represented in Fig.6 as a function of frequency. It can be seen from Fig.6, there are only two obvious relaxation processes for both of the as-received and oxidized specimens, which will be explained as follows. Since the columnar crystals have not been fully crystallized under the as-received condition, the size difference between the columnar boundary and grain boundary is not so distinguished. Therefore, in the two relaxation processes of the as-received sample, the higher-frequency one is related to the grains and the other to a combined effect from both grain boundaries and columnar boundaries. After oxidation, the columnar crystals will cluster together, which results in microcracks (Fig.3). In this case, the relaxation processes of YSZ grains and YSZ grain boundaries overlap, and the relaxation processes of the columnar boundaries and longitudinal cracks combine, corresponding to the higher frequency one and the other, respectively.

Fig.6 Phase angle as function of frequency for as-received specimens (a) and oxidized specimens at 1 050 °C for 50 h (b)
3.3 Electrical properties and oxidation process
Variations of the Rgb and Rgi in the oxidation process can indirectly reflect the micro structural information inside the YSZ. The Arrhenius formula (Eq.(1)) shows the relationship between the electric conductivity and temperature, in which σ means conductance and ΔHm means the activation enthalpy of ionic migration. According to this formula, a logarithmic diagram can be acquired which means Arrhenius diagram. In the case, the slope is ΔHm/k. The Arrhenius plots of YSZ grains and YSZ grain boundaries for the as-received and oxidized specimens for 4 h and 50 h are shown in Fig.7.
σ=(σ0/T)exp[-ΔHm/(kT)] (1)
It is obvious that both of the two slopes of inside grain and grain boundary for the as-received sample did not vary with the measurement temperature (The plot of the grain boundary measured at 250 °C can be seen as a deviated one). However, along with the extension of the oxidation time, both of the two kinds of slopes become large, indicating that the Arrhenius plots change from straight line to parabola. This confirms that the conduction mechanism of the GY-YSZ changes, which can be explained by two reasons. One probable explanation is that the Gd2O3 and Y2O3 diffuse with increasing the oxidation time, which tends to produce more O2- vacancies. This assumption can be confirmed by the Raman spectroscopy (Fig.8), which is influenced by the polarity of valence bond. The Raman spectrum of the specimen after 50 h oxidation shows more intensive fluorescence effect compared with the as-received specimen. After diffusion, the massive new O2- vacancies affect the Raman spectra, which give rise to the fluorescence effect. The other possible reason can be attributed to the generation of lattice distortion during the stabilizer diffusion, which is evidenced by XRD result (Fig.9). Along with increasing the oxidation time, the peaks shift to higher diffraction angles. The C (311) peak is marked by a straight line in Fig.9.

Fig.7 Arrhenius plots of inside grain and grain boundary for as-received (a) and oxidized samples at 1 050 °C for 4 h (b), and 50 h (c)
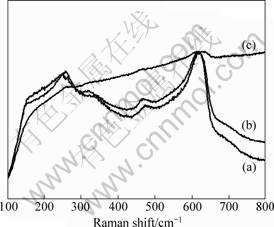
Fig.8 Raman spectra of as-received (a) and oxidized samples at 1 050 °C for 4 h (b) and 50 h (c)
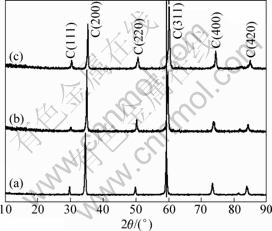
Fig.9 XRD patterns of as-received (a) and oxidized specimens at 1 050 °C for 4 h (b) and 50 h (c)

Fig.10 Resistance versus oxidation time at different measured temperatures: (a) 200 °C; (b) 250 °C; (c) 300 °C; (d) 350 °C; (e) 400 °C
3.4 Electrical properties and measurement temperature
Another essential purpose of the electric circuit in the experiment was designed to acquire specific information of the components of the GY-YSZ during the oxidation due to the electrical responses in the impedance spectra. Four kinds of resistance values as a function of oxidation time measured at different temperatures are presented in Fig.10. Clearly, the resistance of the cracks is distinguished of others, so it can be measured at any temperature from 200-400 °C. Considering that the resistance of columnar boundary and grain boundary can not make a distinction between each other when the measurement temperature is lower than 300 °C, more specific information about the columnar boundary and grain boundary could be obtained only when the measurement temperature is 350 °C or 400 °C. The resistance of the grains should be measured at 200 °C because high measurement temperature can result in scatter of the resistance.
4 Conclusions
1) Various relaxation processes in the impedance spectra of the GY-YSZ topcoating, relative to the grains, grain boundaries and columnar boundaries and longitudinal cracks, were characterized, respectively. The conduction mechanism of the GY-YSZ changes after 50 h oxidation, which can be explained by the generation of O2- vacancies and lattice distortion due to the stabilizer diffusion during the oxidation.
2) The resistance of GY-YSZ grains should be measured at 200 °C. Only when the measurement temperature is higher than 300 °C, the resistance of columnar boundary can be identified from the grain boundary. The resistance of the cracks can be measured in a temperature range of 200-400 °C.
3) Impedance spectroscopy was proven to be a very useful non-destructive approach to examine the variation of the grains, grain boundaries and cracks in GY-YSZ during high temperature oxidation.
References
[1] XU Hui-bin, GONG Sheng-kai, LIU Fu-shun. Recent development in materials design of thermal barrier coatings for gas turbine [J]. Acta Aeronautica et Astronautica Sinica, 2000, 21(1): 7-12. (in Chinese)
[2] SHEFFLER K D, GUPTA D K. Current status and future trends in turbine application of thermal barrier coatings [J]. J Eng Gas Turbines Power, 1988, 110(4): 605-609.
[3] MILLER R A. Thermal barrier coatings for aircraft engines: History and directions [J]. Therm Spray Technol, 1997, 6(1): 35-42.
[4] SURESH G, SEENIVASAN G, KRISHNAIAH M V, MURTIP S. Investigation of the thermal conductivity of selected compounds of lanthanum, samarium and europium [J]. Alloy Compds, 1998, 269: L9-L12.
[5] SARUHAN B, FRANCOIS P, FRITSCHER K, SCHULZ U. EB-PVD processing of pyrochlore-structured La2Zr2O7-based TBCs [J]. Surf Coat Technol, 2004, 182: 175-183.
[6] CAO X Q, VASSEN R, STOEVER D. Ceramic materials for thermal barrier coatings [J]. J Eur Ceram Soc, 2004, 24: 1-10.
[7] LEHMANN H, PITZER D, PRACHT G, VASSEN R, STOVER D. Effects of doping on thermal conductivity of pyrochlore oxides for advanced thermal barrier coatings [J]. J Am Ceram Soc, 2003, 86: 1338-1344.
[8] WU J, WEI X, PADTURE N P, KLEMENSP G, GELL M. Low thermal conductivity rare-earth zirconates for potential thermal barrier coating applications [J]. J Am Ceram Soc, 2002, 85: 3031-3035.
[9] WU J, PADTURE N P, KLEMENS P G, GELL M. Thermal conductivity of ceramics in the ZrO2-GdO1.5 system [J]. Mater Res, 2002, 17: 3193-3200.
[10] ZHU D M. Development of advanced low conductivity thermal barrier coatings [R]. NASA/TM-2004-212961.
[11] NICHOLLS J R, LAWSON K J, JOHNSTONE A, PICKERBY D S. Methods to reduce the thermal conductivity of EB-PVD TBCs [J]. Surf Coat Technol, 2002, 151-152: 383-391.
[12] KAN Y M, LI S L, WANG P L, EHANG G J, OMER B V D, JEF V. Preparation and conductivity of Yb2O3-Y2O3 and Gd2O3-Y2O3 co-doped zirconia ceramics [J]. Solid State Ionics, 2008, 179: 1531-1534.
[13] WEI Q L, GUO H B, GONG S K, XU H B. Novel microstructure of EB-PVD double ceramic layered thermal barrier coatings [J]. Thin Solid Films, 2008, 516: 5736-5739.
[14] MUCCILLO E N S, KLEITZ M. Impedance spectroscopy of Mg-partially stabilized zirconia and cubic phase decomposition [J]. J Eur Ceram Soc, 1996, 16: 453-465.
[15] STEIL M C, THEVENOT F, KLEITZ M. Densification of yttria stabilized zirconia-impedance spectroscopy analysis [J]. Electrochem Soc, 1997, 1: 390-398.
[16] YANG F, XIAO P. Nondestructive evaluation of thermal barrier coatings using impedance spectroscopy [J]. Int J Appl Ceram Technol, 2009, 6(3): 381-399.
[17] ALI M S, SONG S H, XIAO P. Evaluation of degradation of thermal barrier coatings using impedance spectroscopy [J]. J Eur Ceram Soc, 2002, 22: 101-107.
[18] SHI Mei-lin. AC impedance spectroscopy principles and application [M]. Beijing: National Defence Industrial Press, 2001: 5-8. (in Chinese).
[19] FLETCHER J G, WEST A R, IRVINE J T S. The AC impedance response of the physical interface between yttria-stabilized zirconia and YBaCuO [J]. Electronchem Soc, 1995, 142: 2650-2654.
采用交流阻抗谱研究Gd2O3-Yb2O3共掺杂
二氧化锆基热障涂层的高温氧化行为
张丹华,郭洪波,宫声凯
北京航空航天大学 材料科学与工程学院,北京 100191
摘 要:采用电子束物理气相沉积(EB-PVD)制备3Gd2O3-3Yb2O3-4Y2O3(摩尔分数,%)共掺杂的二氧化锆(GY-YSZ)基热障涂层(TBCs)。采用交流阻抗谱(IS)并结合扫描电子显微镜(SEM)、拉曼光谱和X射线衍射分析仪(XRD),研究GY-YSZ涂层在1 050 °C的高温氧化行为。交流阻抗谱中不同的电学信号分别反映GY-YSZ晶粒和晶界的信息,采用电路拟合的方法对其进行分析。在氧化过程中GY-YSZ的导电机制发生变化,原因是稳定剂在氧化过程中发生扩散导致了O2-空位和晶格畸变的产生。研究发现,应该选择合适的测试温度评价GY-YSZ晶粒或晶界的氧化行为,其各自的氧化信息与交流阻抗谱中阻抗值的变化相对应。测试氧化过程中晶粒和晶界阻抗值变化的温度分别为200 °C和300 °C。
关键词:稀土氧化物;Gd2O3;Yb2O3;热障涂层(TBCs);氧化;交流阻抗谱(IS)
(Edited by YANG Hua)
Foundation item: Projects (50771009, 50731001 and 51071013) supported by the National Natural Science Foundations of China; Project (2010CB631200) supported by the National Basic Research Program of China
Corresponding author: GUO Hong-bo; Tel: +86-10-82317117; Fax: +86-10-82338200; E-mail: guo.hongbo@buaa.edu.cn
DOI: 10.1016/S1003-6326(11)60822-4

