


Trans. Nonferrous Met. Soc. China 22(2012) 175-184
Failure characteristics of high stress rock induced by impact disturbance under confining pressure unloading
YIN Zhi-qiang1, 2, LI Xi-bing1, 2, JIN Jie-fang1, 2, HE Xian-qun1, 2, DU Kun1, 2
1. School of Resources and Safety Engineering, Central South University, Changsha 410083, China;
2. Hunan Key Laboratory of Resources Exploitation and Hazard Control for Deep Metal Mines,
Central South University, Changsha 410083, China
Received 10 March 2011; accepted 5 September 2011
Abstract: The failure characteristics under coupled static and dynamic loading were investigated by the improved split Hopkinson pressure bar (SHPB) with axial pre-pressure and confining pressure. The results show that the stress―strain curve of the rock under static-dynamic coupled loading is a typical class I curve when the dynamic load is comparatively high; With the decrease of the dynamic load, the stress―strain curve transforms to a typical class II curve. The dynamic failure process was recorded by high-speed photography. Analyses of fracture surface morphology show that the failure modes of specimens are tensile failure or combined shear failure when the impact load energy is low, but the failure modes of specimens become tensile failure when the impact load energy is high. The results of fractal dimension show that the elastic potential energy release leads to increase in the degree of crushing of samples when the energy of impact load is low under coupled static and dynamic loads with high stress.
Key words: high stress; coupled static and dynamic loading; impact disturbance; high-speed photography
1 Introduction
For the past few years, the rock mechanics, with the underground rock excavation increasingly deepened, have been observed different from traditional one, especially in high stress [1, 2]. Actually, in the circumstances of deep rock excavation with high stress the surrounding rock is not only under high static stress, but also under the influence of stress unloading owing to the formation of free surface which gives rise to stress state change from original three-dimensional to two-dimensional or unidimensional stress, as well as facing the blasting or drilling during excavation and other dynamic loads [3, 4]. The stress change process is shown in Fig. 1. In the combined action of high stress and dynamic loading and unloading, the rock mass in the excavation face is prone to rockburst. Therefore, study on the destruction mechanism of high stress rock under unloadng and dynamic disturbance is of great significance to practical engineering.
Currently, more attention is gradually paid to the failure phenomena of rock under stress unloading as a result of excavation activities and numerous conventional triaxial tests are conducted [5-8]. However, these studies are limited to the quasi-static situation. In reality, underground rock also experiences dynamic loading caused by mechanical shock or blasting operation, which involves the study of rock dynamic characteristics.
The study of rock dynamic characteristics and dynamic-static properties according to static-dynamic coupling loading was based on dynamic properties of SHPB, light gas gun, falling hammer [9]. LI and MA [10] conducted one-dimensionally dynamic-static combined loading test based on the static pressure of Instron system and micro perturbed dynamic stress; ZUO et al [11, 12] completed the study of rock failure mechanism under two-dimensionally dynamic-static load based on the former equipment. The loading rates in these laboratory tests were less than 1 s-1. However, the high strain rate caused by the blasting execution in underground engineering cannot be simulated since it is between 101 s-1 and 102 s-1 or higher. LI et al [3, 4, 13] developed a dynamic-static impact loading system on the basis of the SHPB device and conducted related research experiments.
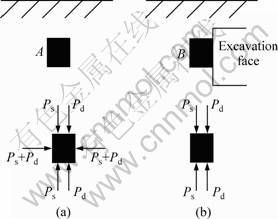
Fig. 1 Stress evolutionary models of rock in projects at deep level: (a) Initial state; (b) State after excavation (Ps―static load; Pd―dynamic load)
In this work, the mechanical properties of sandstone are studied when confining pressure is unloaded in high stress situation under different impact energy using the SHPB device. In addition, the effects of unloading confining pressure on the destruction of dynamic disturbance with high strain rate are analyzed.
2 Test system and scheme
2.1 Test system
The improved SHPB test system can provide both axial static pressure and confining pressure, as shown in Fig. 2 [3].
The test system can be used for impact tests under triaxial pre-pressure, and the axial static loading and the confining pressure are in the range of 0-200 MPa and 0-100 MPa, respectively. The material quality of the bullet and the maximum diameter of the projectile body are the same as those of the input bar and output bar. A conical bullet is used in the improved test system to eliminate the oscillation, and obtain a stable half-sine wave loading [13-15]. The confining pressure and static axial pressure are manually loaded. There is a hydraulic valve at the confining pressure and static axial stress loading equipment to control the stress unloading velocity by manually adjusting the valve opening level.
Conventional SHPB experiments are based on the hypothesis that the sample is under one-dimensional stress and is loaded evenly [10]; but for the improved test system, the sample is under axial static stress when installed correctly. The wave equation of the rock sample under coupled static and dynamic loading is the same as the classical one-dimensional wave equation [3]:
 (1)
(1)
where ρ is the density of the bar; x is the location of the infinitesimal; u is the location of the infinitesimal at x under pressure; t is the loading time; E is the elastic modulus of the bar.
Therefore, the one-dimensional stress wave theory is applicable when the sample is under coupled static and dynamic loading. The impact stress σ(t), impact strain ε(t) and impact stress wave energy EI are calculated by one-dimensional stress wave theory during the experiment using the following formulas [9]:
 (2)
(2)
 (3)
(3)
 (4)
(4)
 (5)
(5)
where ce is the wave velocity of the elastic bar; LS is the sample length; εr(t) is the strain of the reflected stress wave at t; Ae is the cross-sectional area of the elastic bar; As is the cross-sectional area of the specimen; Ee is the elastic modulus of the elastic bar; εt(t) is the strain of the transmitted stress wave at t; ρe is the density of the elastic bar.
2.2 Sample preparation
The samples were drilled from the same integral and uniform block of sandstone to ensure the homogeneity. The cylindrical specimens were made with the dimensions of 50 mm×50 mm, and carefully polished at both ends and lateral side. So, the no parallelism and the no perpendicularity are both less than 0.02 mm. The samples are gray and smooth on surface, with no distinct interspace. The average density of specimens is 2.50 t/m3.

Fig. 2 Configuration of improved SHPB device: 1―Gas tank; 2―Pressure vessel; 3―Striker; 4―Thin baffle; 5―Incident bar; 6―Strain gauge; 7―Specimen; 8―Transmission bar; 9―Steel frame; 10―Confining pressure setup; 11―Pressure loading unit; 12―Oscillograph
The average static uniaxial compressive strength of specimens is approximately 90 MPa.
2.3 Test process
During the test, firstly the axial pressure and confining pressure were loaded to 40 MPa. Then the axial static pressure was increased to 72 MPa with the same loading rate. The confining pressure was unloaded to zero with the unloading rate of 1 MPa/s (manual control) while the axial static pressure maintained unchanged. The confining pressure device was removed after unloading the confining pressure, and then the impact test was conducted, which helped the free ejection of the destroyed debris, and the high-speed photograph record of the impact failure process. During the test the striker was rigorously the same to ensure the dynamic load consistency. The exact whole destruction was applied as the standard. The impact of the air pressure and the impact energy were gradually increased.
The basic parameters and some test results are shown in Table 1.
3 Test results analyses
3.1 Coupled static and dynamic strength
Figure 3 shows the typical stress―strain curves of specimens with different impact energies. It can be seen from the stress―strain curves that the dynamic stress―strain curves are obviously different, especially in the post-peak area. The stress―strain curve of the rock is a typical class I curve when the dynamic load is comparatively high; with the decrease of the dynamic load, the stress―strain curve transforms to a typical class II curve. Generally speaking, while sample gets into post-peak phase of class II curve, the flexibility energy amassed in itself can lead to breakage of the sample, and the energy storage and release properties, which have been revealed by the class II during rock failure process [16], indicate that the sample after the curve peak still has certain carrying capacity after the impact loading. The impact loading causes damage to the specimen, but the residual strength after impact is less than the axial static loading, so the sample is unstable failure. The specimen damage and the residual strength increase with increasing the impact energy, and the elastic energy release decreases with increasing the impact energy, which results in the stress―strain curve transforming to a typical class I curve.
Figure 4 shows the failure modes of the sandstone specimens under different impact energies. When the impact energy is comparatively low, the broken pieces of rock are large, with ruptured conical fragments left; with the increase of the incident energy, the conical fragments, on the other hand, become small until no large piece can be found. The main reason for this is that after the loading and unloading of confining pressure, the internal tiny cracks of the specimens have developed. The distribution of these cracks are similar to the conventional triaxial test, spreading on a certain cone surface and thus forming a tensile damage surface [17]. Under the impact loading, only little impact energy absorption can lead to the rapid development of surface damage and the formation of macro-cracks; when the macro-fracture surface develops to a certain extent, the sample will be damaged as stripping ejection on the basis of the surface under the combined action of the impact load stress wave and the elastic energy stored under the high axial stress. So, there are many strip flaking debris and relatively complete conical fragments. When the incident energy increases, the impact load not only causes the development of the damage face, but also leads to the damage of the sample, making the destruction of impact load increasingly obvious. So, the amount of stripping fragments reduces markedly and the sample tends to be more broken.
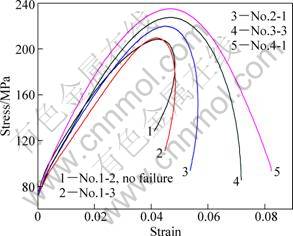
Fig. 3 Stress―strain curves of sandstones under different impact energy (energies of impact load: 1―111.61 J; 2―114.81 J; 3―152.57 J; 4―170.94 J; 5―192.16 J)
Table 1 Physic-mechanical parameters in coupled static and dynamic loads impact tests
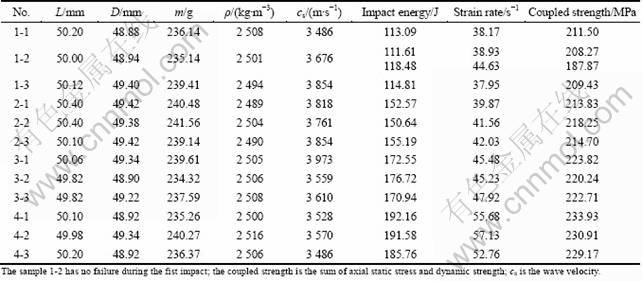
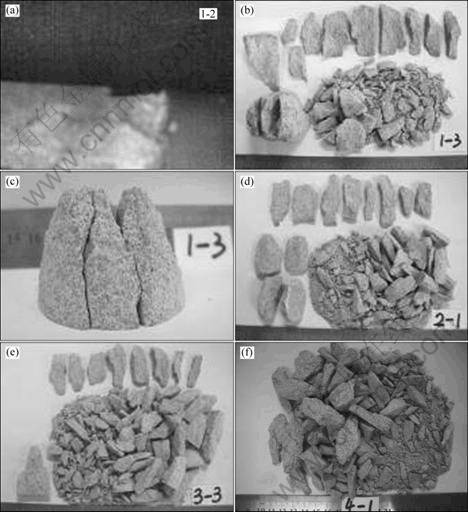
Fig. 4 Failure forms of sandstone under different impact loads (EI): (a) No.1-2, EI=111.61 J; (b), (c) No.1-3, EI=114.81 J; (d) No.2-1, EI=152.57 J; (e) No.3-3, EI=170.94 J; (f) No.4-1, EI=192.16 J
Figure 3 and 4 show that with the increase of the impact energy and the decrease of the rebound of the stress―strain curve after peak, the big block of the destroyed fragments gradually disappear and crush evenly.
3.2 Strain rate and coupled strength
Figure 5 shows the variation tendency of the coupled static and dynamic strength σ and the strain rate ε. The specimen 1-2 is damaged after two impact loadings, so, it is not reflected in Fig. 5. From Fig. 5, it is evident that the coupled static and dynamic strength increases with increasing the strain rate, through which strain-rate effect is embodied. Using the power function can obtain good fitting results.
3.3 Impact energy and energy density
Figure 6 shows the variation tendency of the energy density es with the incident energy EI. The specimen 1-2 is also not reflected in Fig. 6 because of twice impact before damage. From Fig. 6, it is evident that the energy density of the sample gradually increases with increasing the impact energy. When the impact energy is less than 155 J, the energy density of the sample is negative, indicating that the internal fracture expands rapidly by the dynamic disturbance under relative small impact incident energy, to release the elastic energy restored under the high stress. The released energy exceeds the consumed impact disturbance energy. This is why the energy density appears negative.
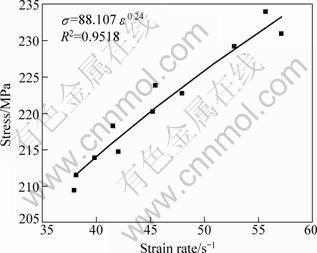
Fig. 5 Relationship between strain rate and dynamic strength

Fig. 6 Relationship between impact energy and density of energy
The rock sample is comparatively seriously damaged and the unstable failure is easy to occur after absorbing very little energy under unloading confining pressure at high axial static stress, so the high-stress rocks under unloading confining pressure are more likely to experience unstable failure in the exposure to the dynamic disturbance. This can well explain the phenomenon that rock excavation face experiences the sudden unstable failure disturbed by the blasting after the excavation of the deep rock.
4 Analysis of failure modes
4.1 High-speed photography of failure process
In the present experiments, photographs of the specimen were taken using a FASTCAM SA1.1 high-speed camera. The frame rate used here was 10 μs, and the exposure time was 1 μs, covering about 192×192 pixels.
The dynamic photographs of crack propagation and debris ejection of the samples,which were obtained by recording the test process of low incident energy (specimen 1-1) and high incident energy (specimen 4-1) using the high-speed camera, are shown in Fig. 7 and Fig. 8. Figure 9 shows the stress―time history with high- speed camera images of the failure process (Fig. 9(a)) and the stress―strain curve (Fig. 9(b)). Figures 7(k)-(o) show the high-speed camera images of the specimen failure process, following the pictures in Figs. 7(f)-(j), with 200 μs interval for each photograph. The photographs of the failure process and stress―time history with high speed camera images of the failure process of the specimen 4-1 under higher incident energy are shown in Fig. 8 and Fig. 10.
Under the impact of lower incident energy, the specimen generates a small crack at 45 μs as shown in Fig. 7(a), and it develops to be an obvious horizontal crack parallel to the wave propagation direction at 65 μs. The crack expands further and the secondary crack emerges at 85 μs.
Under the impact of the higher incident energy, the high-speed images of the specimen failure process are shown in Figs. 8(f)-(j). According to comparison of the pictures at 25, 45, 65 and -5 μs in Figs. 8(c), (d), (e), (a), the surface spots change obviously, reflecting the impact stress of the specimen and the gradual surface deformation. The failure photographs of the sample under the lower and higher incident energy are different during the drastic falling of true loading stress.
Under the impact of the lower incident energy, during the drastic falling of true loading stress phase, namely the loading time of 105-165 μs, the strain reduces, but the sample still shows a certain degree expansion, which is more obvious at the sample part close to the output bar; and the sample appears sliding failure directing to the output bar. Figures 7(k)-(o) reflect the destruction of the samples after the impact loading. The part close to the transmission bar end is seriously damaged, with a large number of small flying debris, in a trend to spread to the output bar; but the part at input bar end is tidy, with no flying debris, and the fragments only diffuse vertically to the loading direction. This reflects that the destruction of the incident side is mainly the tensile damage caused by the expansion, while the destruction of the transmission side is under the combined action of slip shear rifting and expansion. So, there are obvious conical fragments left at the transmission side after impact load.
Under the impact of the higher incident energy, during the same phase (or the loading time of 105-165 μs) the specimen strain continues to increase and the damage is more serious. The difference with the low impact energy impact is that there is no sliding failure phenomenon at the output bar. This is more obvious in the pictures of the sample damage after the impact, as shown in Figs. 8(k)-(o). This reflects that the destruction of the samples is mainly tensile damage generated by the compression and expansion under the impact of the higher impact energy. Therefore, the fragments are uniform, with no conical fragments.
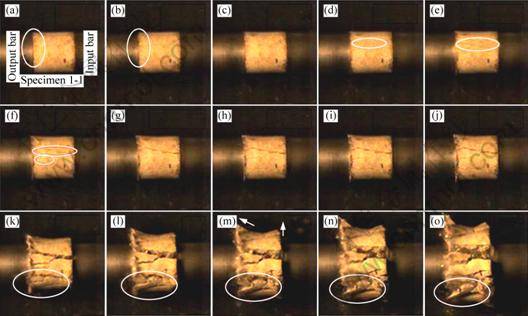
Fig. 7 Failure patterns under low impact energy dynamic loading for specimen 1-1: (a) -5 μs; (b) 5 μs; (c) 25 μs; (d) 45 μs; (e) 65 μs; (f) 85 μs; (g) 105 μs; (h) 125 μs; (i) 145 μs; (j) 165 μs; (k) 375 μs; (l) 575 μs; (m) 775 μs; (n) 975 μs; (o) 1175 μs

Fig. 8 Failure patterns under high impact energy dynamic loading for specimen 4-1: (a) -5 μs; (b) 5 μs; (c) 25 μs; (d) 45 μs; (e) 65 μs; (f) 85 μs; (g) 105 μs; (h) 125 μs; (i) 145 μs; (j) 165 μs; (k) 375 μs; (l) 575 μs; (m) 775 μs; (n) 975 μs; (o) 1175 μs
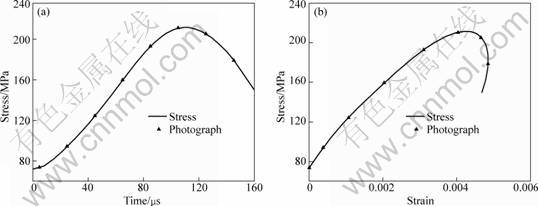
Fig. 9 Stress―time history with high-speed camera photographs of failure process (a) and stress―strain curves for specimen 1-1 (b)
4.2 Morphology of stripping debris
Figure 11 shows the surface morphology of the typical strip flake fragments in the test. The failure shape shows spindle shape. The slope surfaces of the two sides of the fragments are obviously different (Figs. 11(a) and (b)).
The fracture morphological characteristic of the fragment surface is closely related to the mechanical properties of the specimen. The typical fracture morphological characteristics are given in different fracture modes combined with Ref. [18], where the two sides of the strip flake fragments show different fracture modes. One side surface is smooth with local scratches and inconspicuous lamellar fracture (Fig. 11(c)), showing mainly shear failure; the other is obvious lamellar fracture damage (Fig. 11(d)), showing tensional fracture.
The strip flake fragments are mainly generated at low energy impact test. It can be seen from the high-speed camera photographs of the failure process (Fig. 7) in such tests that the smooth surface side is close to the output bar, while other side is close to the input bar.
Therefore, the strip flake fragments failure is mainly by the combined action of the tensile failure and the tensile shear failure is under low energy impact loads.
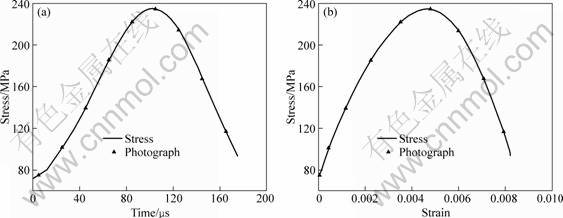
Fig. 10 Stress―time history with high-speed camera photographs of failure process (a) and stress―strain curves for specimen 4-1 (b)
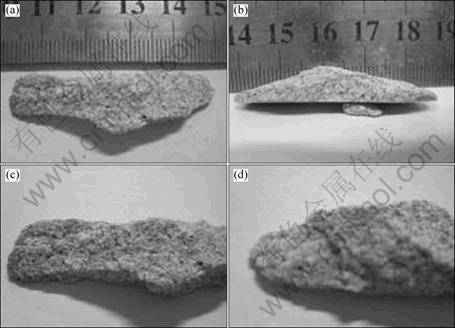
Fig. 11 Surface morphology of failure shape: (a) Top view; (b) Side view; (c) Surface morphology I; (d) Surface morphology II
4.3 Fragmentation distribution
Distribution of the rock fragmentation directly reflects the situation of broken rock, and indirectly reflects the crushing effect under different impact loading conditions. Through the screening experiment, the fractal dimension for the oversize products of 0.5, 1.00, 5.00, 20.00, 50.00 mm was obtained.
The fractal dimension (D) of rock piece is according to the mass equivalent dimension [19], and the equation of fractal dimensions are written as
 (6)
(6)
 (7)
(7)
where α is the slope of the straight line drawn in the double logarithmic coordinates; R is the diameter of the sieve pore; mR is the cumulative mass of the fragments smaller than the diameter R; m is the total mass.
The results of the fractal dimension calculated by functions (6) and (7) are shown in Table 2.
XIE et al [20] deduced the relationship between the fractal dimension and the explosive energy. The results showed that there was a very marked logarithmic relationship between the fractal dimension and the explosive energy.
 (8)
(8)
where Er is the explosive energy; A and B are constants.
The logarithm relationship between the fractal dimension and impact energy in this paper is shown in Fig. 12.
Figure 12 shows that when the impact energy is high, the fractal dimension is observed to increase linearly with the increase of the logarithm of the impact energy, which is in accordance with Eq. (8), and it becomes apparent nonlinear when the impact energy is low. The sample is under high axial static stress before the impact, so the specimen itself has high potential elastic energy. However, it is lower than the impact energy, but decrease of the impact energy brings about the growth of the ratio of elastic energy storage and the impact energy. The elastic energy has a destructive action when rock fragmentation increases gradually with the decrease of the impact energy. As a consequence, the relationship between the fractal dimension and the energy logarithmic is non-linear when the impact energy is low, implying that the release of the elastic energy storage enhances the damage level.
Based on the above analysis, the total energy Er giving rise to the rock failure under the coupled static and dynamic loading is calculated from the following function:
 (9)
(9)
where Ee is the stored elastic energy.
Substituting Eqs. (9) into Eq. (8), the relationship between the fractal dimension D and the energy under coupled static and dynamic loading can be rewritten as
 (10)
(10)
Therefore, under coupled static and dynamic loading, the stored elastic energy and the impact energy are considered comprehensively during rock fragmentation process.
Table 2 Mass accumulation of fractal and fractal dimension
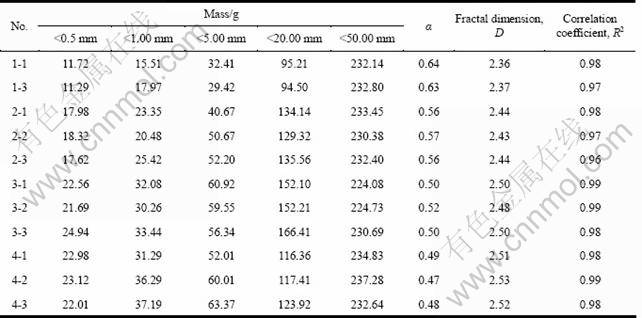
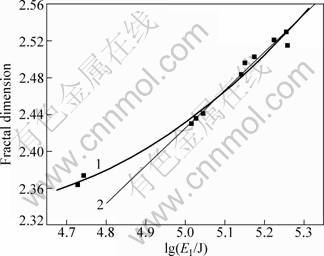
Fig. 12 Relationship between fractal dimension and impact energy: 1―Fitting cure with all experimental data; 2―Fitting cure with experimental data of high impact load energy
5 Conclusions
1) The stress―strain curves after the peak stress under the action of high axial static stress and different impact energies differ greatly: the curve of the rock is typical class I when the dynamic load is comparatively high; with the decrease of the dynamic load energy, the stress―strain curve transforms to be typical class II gradually.
2) The dynamic failure process of the rock samples is record by the high-speed camera. In combination with the morphology analysis of the fracture surface, it can be found that the failure mode is obviously affected by the impact incident energy. The sample is mainly destroyed by the combined action of tensile expansion failure and tensile shear failure under low impact energy, while mainly destroyed by tensile expansion failure under high impact energy.
3) According to the analysis of the relationship between impact energy and fractal dimension and the relationship between impact energy and density of energy, it can be seen that the release of high stored stress energy has an obvious effect on the rock failure process under low energy impact loads. So, the effects of high stored stress energy on the rock failure should be taken into account in the process of rock excavation under high ground stress.
References
[1] GU De-sheng, LI Xi-bing. Modem mining science and technology for metal mineral resources [M]. Beijing: Metallurgical Industry Press, 2006. (in Chinese)
[2] ZHAO P J, LOK T S, YIN Zhi-qiang, ZHOU Zi-long. Simplified design of rock cavern concrete lining to resist shock loading [J]. Journal of Central South University of Technology, 2010, 17(5): 1087-1094.
[3] LI Xi-bing, ZHOU Zi-long, LOK Tat-seng, HONG Liang, YIN Tu-bing. Innovative testing technique of rock subjected to coupled static and dynamic loads [J]. International Journal of Rock Mechanics and Mining Science, 2008, 45(5): 739-748.
[4] LI Xi-bing, ZHOU Zi-long, YE Zhou-yuan, MA Chun-de, ZHAO Fu-jun, ZUO Yu-jun, HONG Liang. Study of rock mechanical characteristics under coupled static and dynamic loads [J]. Chinese Journal of Rock Mechanics and Engineering, 2008, 27(7): 1387-1395. (in Chinese)
[5] XU Lin-sheng. Research on the experimental rock mechanics of rockburst under condition [J]. Journal of Chongqing Jiaotong University, 2003, 22(1): 1-4. (in Chinese)
[6] ZHANG Lin-ming, WANG Zai-quan, HE Jun-zheng. Analysis of failure characteristics of rock under unloading conditions and their effects on rock burst [J]. Journal of Xi’an University of Architecture, 2007, 39(1): 110-114. (in Chinese)
[7] HE Man-chao, MIAO Jin-li, LI De-jian, WANG Chun-guang. Experimental study on rockburst processes of granite specimen at great depth [J]. Chinese Journal of Rock Mechanics and Engineering, 2007, 26(5): 865-876. (in Chinese)
[8] XU Ze-min, HUANG Run-qiu, LUO Xing-chun, LI Rui, SUN Jing-yi. Limitations of static load theory in rockburst research and preliminary analysis on dynamics mechanism of rockburst [J]. Chinese Journal of Rock Mechanics and Engineering, 2003, 22(8): 1255-1262. (in Chinese)
[9] LI Xi-bing, GU De-sheng. Rock impact dynamics [M]. Changsha: Central South University of Technology Press, 1994. (in Chinese)
[10] LI X B, MA C D. Experimental study of dynamic response and failure behavior of rock under coupled static-dynamic [C]//AOKI O. Proceedings of the ISRM International Symposium 3rd ARMS. Rotterdam: Mill Press, 2004: 891-895.
[11] ZUO Yu-jun, LI Xi-bing, ZHOU Zi-long, MA Chun-de, ZHANG Yi-ping, WANG Wei-hua. Damage and failure rule of rock undergoing uniaxial compressive load and dynamic load [J]. Journal of Central South University of Technology, 2005, 12(6): 742-749.
[12] LI Xi-bing, ZUO Yu-jun, MA Chun-de. Constitutive model of rock under coupled static-dynamic loading with intermediate strain rate [J]. Chinese Journal of Rock Mechanics and Engineering, 2006, 25(5): 865-874. (in Chinese)
[13] LI Xi-bing, GU De-sheng, LAI Hai-hui. On the reasonable loading stress waveforms determined by dynamic stress―strain curves of rock by SHPB [J]. Explosion and Shock Waves, 1993, 13(2): 125-130. (in Chinese)
[14] LI X B, LOK T S, ZHAO J, ZHAO P J. Oscillation elimination in the Hopkinson bar apparatus and resultant complete dynamic stress-strain curves for rocks [J]. International Journal of Rock Mechanics and Mining Science, 2000, 37(7): 1055-1060.
[15] LI Xi-bing, ZHOU Zi-long, WANG Wei-hua. Construction of ideal striker for SHPB device based on FEM and neural network [J]. Chinese Journal of Rock Mechanics and Engineering, 2005, 24(23): 4215-4218. (in Chinese)
[16] ZHANG Ping, HE Ruo-lan, LI Xi-bing, LI Ning. Research on progressive damage constitutive model and its application to deep rock [J]. Engineering Mechanics, 2007, 24(12): 146-152. (in chinese)
[17] TANG C A, THAM L G, LEE P K K, TSUI Y, LIU H. Numerical studies of the influence of microstructure on rock failure in uniaxial compression part Ⅱ: Constraint, slenderness and size effect [J]. International Journal of Rock Mechanics and Mining Sciences, 2000, 37(4): 571-583.
[18] TAN Yi-an. Analysis of fractured face of rockburst with scanning electron microscope and its progressive failure process [J]. Journal of Chinese Electron Microscopy Society, 1989, 8(2): 41-48. (in Chinese)
[19] HE Man-chao, YANG Guo-xing, MIAO Jun-li, JIA Xue-na, JIANG Ting-ting. Classification and research methods of rockburst experimental fragments [J]. Chinese Journal of Rock Mechanics and Engineering, 2009, 28(8): 1521-1529. (in Chinese)
[20] XIE He-ping, GAO Feng, ZHOU Hong-wei, ZUO Jian-ping. Fractal fracture and fragmentation in rocks [J]. Journal of Disaster Prevention and Mitigation Engineering, 2003, 23(4): 1-9. (in Chinese)
围压卸载下高应力岩石动力扰动的破坏特性
殷志强1, 2,李夕兵1, 2,金解放1, 2,贺显群1, 2,杜 坤1, 2
1. 中南大学 资源与安全工程学院,长沙 410083;
2. 中南大学 深部金属矿产开发与灾害控制湖南省重点实验室,长沙 410083
摘 要:利用改造后的动-静组合加载SHPB装置,系统研究砂岩预先经三维加载再围压卸载的动-静组合加载的破坏特性。结果表明:采用动-静组合加载,当动载荷较大时,试样整体失稳,应力―应变曲线为典型的I型曲线;随着动载荷的减小,应力―应变曲线逐渐向II型曲线转变,即向岩爆曲线过渡,揭示了高应力下动力扰动诱发岩爆,释放弹性储能的现象。使用高速摄像仪拍摄试样破坏过程,直观反映试样的动态破坏过程。剥落碎片的断口表面形貌特征分析显示,用较低能量冲击时,试样受到张剪性破坏和膨胀性破坏的共同作用;当用较高能量冲击时,试样以膨胀破坏为主。碎块分形结果表明,采用高应力动-静组合加载,当用小能量冲击时,引发弹性储能释放能提高试样的破碎程度。
关键词:高应力;动-静组合加载;动力扰动;高速摄像
(Edited by YANG Hua)
Foundation item: Projects (10872218, 50934006) supported by the National Natural Science Foundation of China; Project (2010CB732004) supported by National Basic Research Program of China; Project (2011ssxt276) supported by the Central South University Innovation Fund, China
Corresponding author: LI Xi-bing; Tel: +86-731-88836628; E-mail: xbli@mail.csu.edu.cn
DOI: 10.1016/S1003-6326(11)61158-8

