J. Cent. South Univ. Technol. (2011) 18: 1054-1062
DOI: 10.1007/s11771-011-0803-6
A marked enhancement in production of amylase by Bacillus amyloliquefaciens in flask fermentation using statistical methods
ZHAO Wei(赵伟)1, 2, ZHENG Jia(郑甲)2, WANG Yu-guang(王玉光)2, ZHOU Hong-bo(周洪波)1, 2
1. Key Laboratory of Biometallurgy of Ministry of Education, Central South University,
Changsha 410083, China;
2. School of Minerals Processing and Bioengineering, Central South University, Changsha 410083, China
? Central South University Press and Springer-Verlag Berlin Heidelberg 2011
Abstract: A total of 126 bacterial strains were isolated from soil samples. Among them, 11 isolates were found positive for amylase production. Strain YL produced the largest zone of clearance on plate assay. The isolate YL was identified as Bacillus sp. based on morphological and physiochemical characterization. According to 16S rRNA gene sequencing data, the closest phylogenetic neighbor of strain YL was Bacillus amyloliquefaciens (99.54%). After that, an optimization of culture conditions was carried out for the improvement of α-amylase production. Response surface methodology (RSM) was applied to evaluate the effect of medium components including wheat bran, cottonseed extract, yeast extract, starch, NaCl and CaCl2. Three variables (wheat bran, cottonseed extract, and starch), which were identified to significantly affect amylase production by Plackett-Burman design were further optimized using response surface methodology of Box-Behnken design (BBD). The optimal concentrations estimated for each variable related to the maximum of amylase activity (86 kU/mL) were 10.80 g/L wheat bran, 9.90 g/L cottonseed extract, 0.5 g/L starch, 2.0 g/L yeast extract, 5.00 g/L NaCl and 2.00 g/L CaCl2. The fermentation using optimized culture medium allowed a significant increase in amylase production (by 3-fold). The improvement in the α-amylase production after optimization process can be considered adequate for large-scale applications.
Key words: response surface methodology; amylase; medium optimization; Bacillus amyloliquefaciens
1 Introduction
Alpha-amylase (E.C.3.2.1.1) catalyses the hydrolysis of α-D-(1,4) glycosidic linkages in starch components and related carbohydrates. It is a key enzyme in the production of starch derivatives and also used in fabrics desizing, pharmaceuticals and detergents. It possesses approximately 25%-33% of the world marketable enzymes. Microbial α-amylases are more stable and more cheaply prepared than plant and animal α-amylases [1]. Various species of microorganisms such as Bacillus subtilis, Bacillus amyloliquefaciens, Escherichia sp., Rhizopus sp. and Aspergillus oryzae are able to produce α-amylases [2-4].
To meet the growing demands of economically important α-amylase, it is necessary to find high efficient enzymes to increase its yield and decrease the production cost [5]. To increase enzyme yield, media optimization is considered a feasible strategy. The growth and enzyme production of the organism are strongly influenced by medium composition, thus the optimization of media components could improve product productivity, and is also the primary task in a biological process [6]. SCHMIDELL et al [7] reported that factors like composition of the culture medium, initial concentration of polysaccharide, cultivation conditions and the microorganism itself may impact enzyme production. FACCIOTTI et al [8] observed that the amylase activity of Aspergillus awamori decreased when the substrate content was increased up to 2%. Besides the carbon source, it has been suggested that the nitrogen source can also control amylase activity [9]. WA?KO et al [10] reported a successful medium optimization using Plackett-Burman design. OTHUMPANGAT et al [11] optimized media components in ethanol production using response surface methodology, and RISPOLI and SHAH [12] optimized cutinase fermentation medium using mixture optimization design.
The optimization studies did not consider the interaction effects among the variables as every process is influenced by several variables [13]. Moreover, it hardly depicted the net effect of the various medium constituents on the enzyme activity, which is also time consuming and requires a number of experiments to determine the optimum levels.
In order to overcome these limitations of the classical method, optimization can be done by statistical experimental design such as response surface methodology [14-16]. Response surface methodology is a collection of mathematical and statistical techniques for designing experiments for constructing and exploring an approximate functional relationship between a response variable and a set of design variables.
Statistical methods have been applied for optimization of α-amylase [17-20]. A statistical approach has been employed in the present study in which a Plackett-Burman design is used for identifying significant variables influencing α-amylase production by Bacillus amyloliquefaciens. The levels of the significant variables are further optimized using response surface methodology.
2 Experimental
2.1 Strain and medium
The bacterial strain was isolated from a soil sample collected from Yuelu Mountain, Hunan Province, China, and maintained as spores at 4 °C, on plates of Luria- Bertani (LB) agar having the following composition: 10 g/L NaCl, 5 g/L yeast extract, 10 g/L tryptone, and 15 g/L agar. The minimum defined medium for both shake flask culture and fed-batch fermentation consisted of 5 g/L starch, 2 g/L corn slurry, 4 g/L KH2PO4, 4 g/L (NH4)2SO4, 0.38 g/L CaCl2, 18.2 g/L MgSO4・7H2O, 2.50 g/L MnSO4・H2O, and 54.17 g/L FeSO4・7H2O. Initial pH of the medium was 7.0. All these materials were in chemical pure grade and purchased from Sinopharm Chemical Reagent Co. Ltd.
2.2 Analyses of 16S rRNA sequences
Genomic DNA of the isolate was extracted with a MiniBEST Bacterial Genomic DNA extraction kit from TaKaRa (Dalian, China). The 16S rRNA gene of isolate was amplified using the universal primers 8F (5’-AGAGTTTGATCCTGGCTCAG-3’) and 1492R (5’- GGTTACCTTGTTACGACTT-3’) [21]. The amplification was conducted by initial denaturation at 95 °C for 5 min followed by 10 cycles at 93 °C for 1 min, 63 °C for 1 min, 71 °C for 1.5 min; 20 cycles at 93 °C for 1 min, 67 °C for 1 min, 71 °C for 2 min and final extension at 71 °C for 5 min. The purified PCR product was sequenced in both directions using an automated sequencer by Invitrogen. The phylogenic relationship of the isolate was determined by comparing the sequencing data with sequences of some members of the genus bacillus available through the GenBank database of the National Center for Biotechnology Information. The gene sequences of each isolate obtained in this study were compared with the existing 16s rRNA gene sequences in the GenBank database.
2.3 Optimization strategy
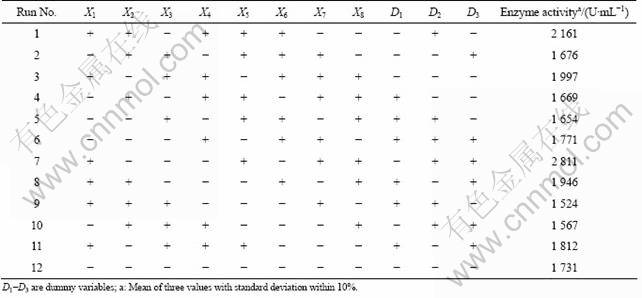
There are several factors such as wheat bran, cottonseed extract, yeast extract, starch, NaCl concentration, CaCl2 concentration, broth pH and rotation speed that affect the amylase productivity in fermentors. In order to obtain the optimum conditions of medium for production of amylase, a Plackett-Burman design was applied for screening of the variables (Table 1). Total of eight factors were selected for the study with each variable being represented at two levels, high (+) and low (-), and three dummy variables in 12 trials (Table 2). Each row represents a trial, and each column represents an independent (assigned) or dummy (unassigned) variable. The effect of each variable was determined by the following equation:

where E(Xi) is the concentration effect of the tested variable.  and
and  represent the amylase production from the trials, where the variable (Xi) measured was presented at high and low concentrations, respectively. N is the total number of trials equals 12.
Experimental error was estimated by calculating the variance among the dummy variables as

where Veff is the variance of the effect of level, Ed is the effect of level for the dummy variables and n is the number of dummy variables used in the experiment. The standard error (SE, Es) of concentration effect was the square root of variance of an effect, and the significance level (P-value) of each concentration effect was determined using the student’s t-test:

where E(Xi) is the effect of variable Xi.
Table 1 Variables representing medium components used in Plackett-Burman design
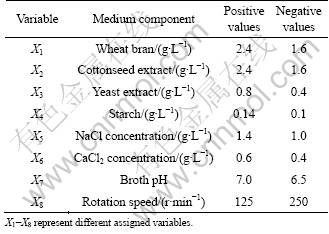
Table 2 Design matrix and experimental results of Plackett-Burman design
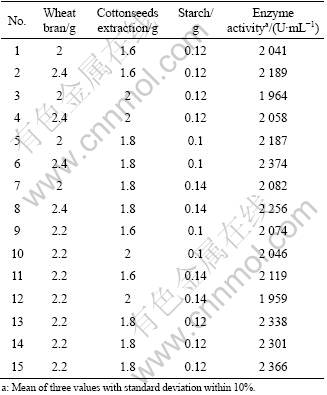
After choosing the significant variables, in order to investigate the interaction between variables, a Box-Behnken design (BBD) was performed and a response surface equation was derived. BBD approach was used for determining the optimum levels of critical variables (identified by Plackett-Burman) for enhancing the enzyme production. The effect of each variable on enzyme production was studied at three different concentrations. Enzymatic activity was measured in triplicate in 15 different experimental runs (Table 3).
The amylase production was analyzed by using a second order polynomial equation, and the data were fitted into the equation by multiple regression procedure. The model equation for analysis is given as

where Y is the predicted response; β0 is the offset term; βi is the linear effect; βii is the squared effect; βij is the interaction effect.
The experimental design matrix and data analyses were performed using the Matlab Statistics Toolbox. Statistical analysis of the model was performed to evaluate the analysis of variance (ANOVA).
2.4 Experiments in shake flasks
Inocula for shake flask experiments were grown in the LB medium in tubes at 37 °C and adjusted by dilution to obtain equivalent cell densities in log phase. Shake flask cultures were grown in 500 mL Erlenmeyer flasks containing 150 mL of culture medium at 37 °C and 250 r/min for 60 h.
Table 3 Design matrix and experimental results of Box- Behnken design
2.5 Cell density measurement
Cell concentration was measured with a spectro- photometer by optical density at 660 nm (721 type spectrophotometer, Shanghai Analytical Instrument General Factory) and was converted to cell number per milliliter of broth.
2.6 Glucose assay
Glucose concentration was determined using a dinitrosalicylic acid (DNS) detection assay [22].
2.7 Enzyme assay
The α-amylase activity was assayed by starch-iodine method with some modifications [23]. The substrate for α-amylase was 1% soluble starch. The substrate was mixed with 100 mmol/L acetate buffer (pH 6.0) and then incubated at 70 °C for 10 min. The enzyme reaction was stopped by adding 1 mol/L HCl and then 0.1 mL of the reaction mixture was mixed with 1 mL of 0.2% Iodine-0.4% KI and 2 mL of distilled water, and incubated for 15 min at room temperature. The enzyme activity was assayed by measuring the absorbance at 620 nm (721 type spectrophotometer, Shanghai Analytical Instrument General Factory). One unit of enzyme activity was defined as the amount of enzyme that catalyzed the formation of 1.0 mg of glucose from the soluble starch in 5 min at 70 °C and pH 6.0.
2.8 Protein purification and gel electrophoresis
The enzyme was precipitated by bringing the culture filtrate to 90% saturation with solid ammonium sulfate and kept at 4 °C for overnight. The precipitate was centrifuged at 12 000g for 30 min. The precipitate was dissolved in glycine-NaOH buffer of pH 9 and dialyzed for 48 h against the same buffer. The dialyzed sample was assayed for α-amylase activity and protein content [24]. The partially purified enzyme was used for investigating the effect of temperature and pH on enzyme activity.
SDS-PAGE using 10% polyacrylamide gels [25] was performed on each of the amylase protein precipitates and the pooled Sephadex G-75 fractions with the Mini-PROTEAN Tetra electrophoresis system (BioRad, USA). Gels were stained with Coomassie brilliant blue R-250.
2.9 Biochemical characterization
The optimum temperature for enzyme activity was assayed in 0.02 mol/L phosphate buffer (pH 6.0) by varying the temperature of the reaction system (40- 100 °C). The optimum pH was determined by performing the assay at 70 °C (optimum temperature) using different buffer systems (acetate, pH 4.0-6.0; imidazole, pH 6.5-7.5; Tris-HCl, pH 8.0-8.5 and glycine-NaOH, pH 9.0-10), all at 50 mmol/L concentration.
3 Results and discussion
3.1 Isolation and identification of bacteria
A total of 126 bacterial strains were isolated from 15 soil samples. Fifty-eight strains were obtained based on colony morphology. Among them, 11 isolates could grow on the selected plates using starch as the only carbon source. Strain YL was selected because of its highest amylase production capability for further study.
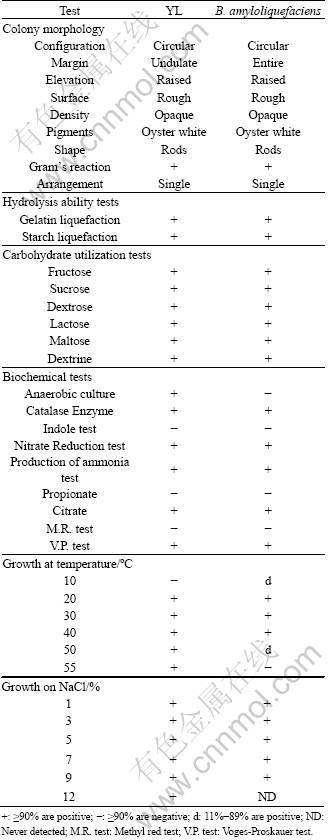
The strain cells were Gram-positive, rod-shaped, and spore-forming when observed under microscope. The strain produced amylase, lipase and was positive for nitrate reduction, Voges-Proskauer test, and acid production from glucose, maltose, sucrose, and lactose, but negative for gas production from them (Table 4). Hence, strain YL was tentatively identified as Bacillus sp. The sequenced 16S rDNA genes exhibited high similarity (99.54%) with that of Bacillus amyloliquefaciens. B. amyloliquefaciens was discovered in soil in 1943 by FUKUMOTO [26], who gave the bacterium its name because it produced (faciens) a liquifying (lique) amylase (amylo). It is an important source of α-amylase used in starch hydrolysis. Figure 1 shows the phylogenetic position of the isolate. Therefore, strain YL was identified as Bacillus amyloliquefaciens.
Table 4 Physiology and biochemical characteristics of strain YL
3.2 Screening of essential medium components
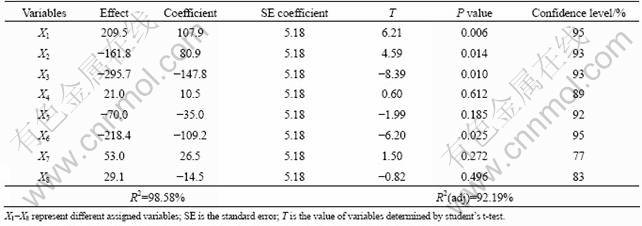
Plackett-Burman design was used for initial screening of medium components. Table 5 represents the effect, standard error, T value, P-value and confidence level of each component from the result of amylase production in Table 2. The effect of eight variables on amylase production by Bacillus subtilis was analyzed. Variability in three factors (wheat bran, cottonseed extract, starch) significantly affected the enzyme production. None of the dummy factors showed impact on enzyme production, which confirmed the validity of the Plackett-Burman design. In addition, the adjusted coefficient of determination (adjusted R2) of the model was 0.921 9 that explained up to 92.19% variability of the data.
Among three variables tested in this investigation, wheat bran was the major factor that influenced the amylase production. According to the model, the production of amylase was affected by the interaction of wheat bran with cottonseed extract and the interaction of cottonseed extract with starch. Predicted and experimental responses reflected the accuracy and applicability of RSM for the optimal production of extracellular amylase. A 12.55-fold increase was recorded in RSM optimized medium in shake flasks compared with the results acquired in unoptimized medium (Data not shown).
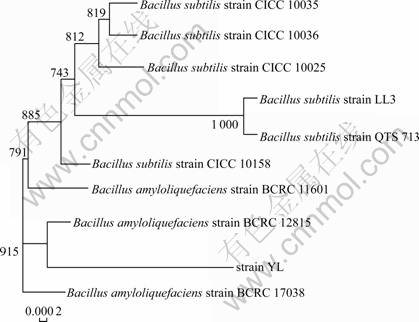
Fig.1 Phylogenetic tree of strain YL and related bacterial species (Constructed according to 16S rDNA gene sequence with MEGA4.0 software)
Table 5 Statistical analysis of cultivation parameters for amylase production by Plackett-Burman design
3.3 Optimization of screened medium components
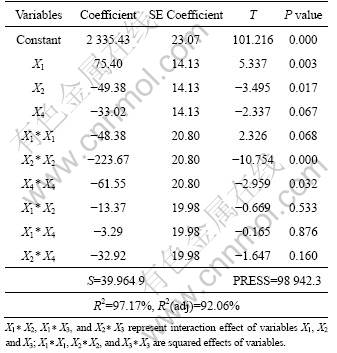
An experimental design of 15 runs was made according to Box-Behnken’s response surface design for three significant factors (wheat bran, cottonseed extract and starch). The individual and interactive effects of these variables were studied by conducting the cultivation run at different levels of all factors (Table 3). Data in Table 6 indicate that all the coefficients presented in Eq.(1) were significant for amylase production, and the interaction of X1 with X2 and interaction of X2 with X3 were significant for enzyme production. The amylase production in each experimental run was analyzed and fitted into a multiple nonlinear regression model. The model proposes a second order regression equation as a function of wheat bran (X1), cottonseed extract (X2) and starch (X4), as given below:
Y=2 335.43+75.40X1-49.38X2-33.02X4-48.38 -
-
223.67 -61.55
 -13.37X1X2-3.29X1X4-
32.92X2X4 (1)
Table 6 Significance test of regression coefficient
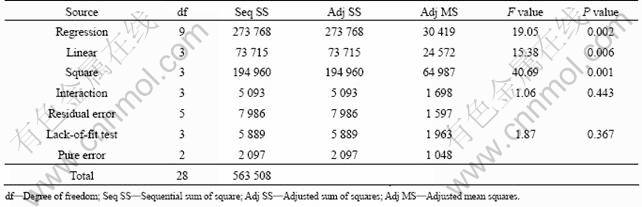
The results obtained by BBD were analyzed by standard analysis of variance (ANOVA). The analysis of variance for the model was performed and is summarized in Table 7. The values of F-statistic and P-value were found to be 40.69 and 0.001, respectively, suggesting that the second order regression model was highly significant.
The effect of interaction of various physiochemical parameters on the amylase production was studied by plotting three-dimensional response surface curves against any two independent variables while keeping the other independent variable at their ‘0’ levels. Therefore, three response surfaces were obtained by considering all the possible combinations. Three-dimensional response plot shown in Fig.2(a) describes the behavior of amylase production, main effect, interaction effect and squared effect (nonlinear) of wheat bran and cottonseed extract at different concentrations. Fig.2(b) depicts three- dimensional curve and contour plot of the calculated response surface from the interaction between wheat bran and starch while keeping cottonseed extract at ‘0’ level. And the interaction effect of cottonseed extract and starch is shown in Fig.2(c). Increase in wheat bran concentration showed increased amylase production, whereas increase in cottonseed extract concentration and starch concentration both showed decreased amylase production to a certain level.
The optimal concentrations estimated for each variable were 10.80 g/L wheat bran, 9.90 g/L cottonseed extract, 0.50 g/L starch, 2.00 g/L yeast extract, 5.00 g/L NaCl and 2.00 g/L CaCl2. The predicted amylase production obtained from the model using the above optimum concentrations of medium components was 60 kU/mL in flask. To validate the prediction of the model, additional experiments in triplicate using shake flasks were performed with the optimized medium. These experiments yielded the maximum amylase activity of 86 kU/mL which was 3 times higher than that in the unoptimized medium (Fig.3). Good agreement between the predicted and experimental results verified the validity of the model and the existence of the optimal points.
Table 7 ANOVA for regression equation
The RSM helped in identifying significant factors and their levels that influenced the amylase production by Bacillus amyloliquefaciens. The carbon and nitrogen sources are the most important factors affecting enzyme production. Amylase produced by B. amyloliquefaciens is also significantly affected by the concentration of CaCl2 as GANGADHARAN et al reported [27].
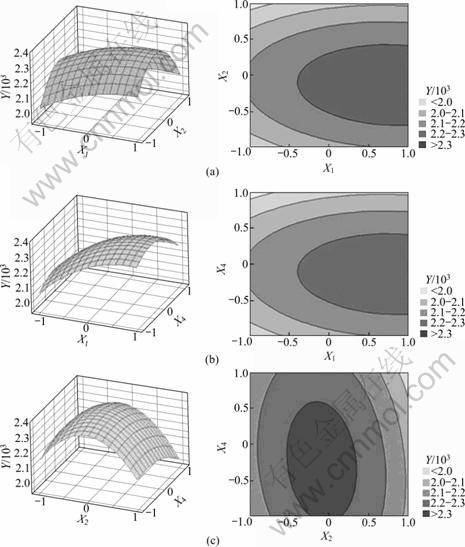
Fig.2 Response surface graphs showing interactions between significant variables: (a) Wheat bran and cotton seed; (b) Wheat bran and starch; (c) Cotton seed and starch
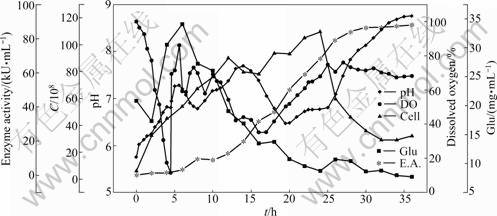
Fig.3 Time course of batch fermentation in 500 mL shaking flasks with 100 mL medium cultivating at 34 °C, pH 7.0, and 125 r/min
3.4 Purification and biochemical characterization
SDS-PAGE revealed a single protein band after Sephadex G-75 elution, indicating enzyme purification to apparent homogeneity. Zymography also showed a sharp activity band corresponding to approximately 55 ku protein (Fig.4). The optimum temperature for the activity of the present enzyme was 70-75 °C (Fig.5(a)). About 75% residual enzyme activity was observed at 40 °C, implying the enzyme can potentially be used at lower temperatures. The optimum pH range for enzyme activity was 5.5-6.5 (>90% activity), while pH 4.0 and 10.0 resulted in 40% and 15% activity (Fig.5(b)), respectively. The pH optimum of amylases produced from various Bacillus sp. isolates is generally known to fall in the 4.5-8.0 range. Commercially, α-amylase at a pH range of 6.0-7.0 is preferred. The enzyme is fairly stable at pH values of 5.0-9.0 (> 50% activity). Considering the requirement of starch liquefaction process of an enzyme with a low pH optimum, the present enzyme may offer an advantage as it reasonably works at pH 4.0-10.0. From an economical point of view, this allows for the minimized use of acids and bases for pH adjustment.
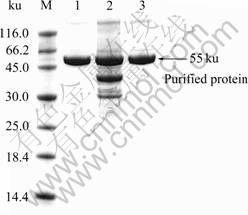
Fig.4 SDS-PAGE profiles of amylase protein: Lane 1―Purified enzyme; Lane 2―Fermentation broth; Lane 3―Commercial amylase (from BF7658)
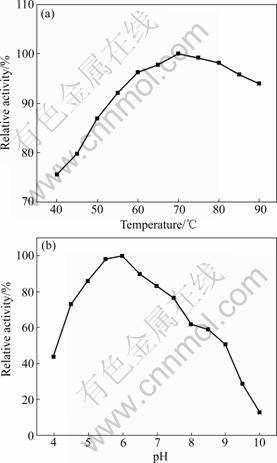
Fig.5 Effects of temperature (a) and pH (b) on enzyme activity
View Within Article
4 Conclusions
1) The significant factors identified by RSM influencing the amylase production by Bacillus amyloliquefaciens were carbon and nitrogen sources and CaCl2.
2) The optimal concentrations estimated for each variable were 10.80 g/L wheat bran, 9.90 g/L cottonseed extract, 0.5 g/L starch, 2.0 g/L yeast extract, 5.00 g/L NaCl and 2.00 g/L CaCl2. The maximum amylase activity of 86 kU/mL obtained in optimized medium was three times higher than that obtained in the unoptimized medium. The optimal medium was easy to scale up for industrial fermentation.
References
[1] GUPTA R, GIGRAS P, MOHAPATRA H, GOSWAMI V K, CHAUHAN B. Microbial alpha-amylases: A biotechnological perspective [J]. Process Biochemistry, 2003, 38(11): 1599-1616.
[2] AMORNCHAI A, NATTHAPONG S. Control of fed-batch bioreactors by a hybrid on-line optimal control strategy and neural network estimator [J]. Neurocomputing, 2009, 72(10/11/12): 2297- 2306.
[3] TANYILDIZI M S, ?ZER D, ELIBOL M. Production of bacterial α-amylase by B. amyloliquefaciens under solid substrate fermentation [J]. Journal of Biochemistry Engineering, 2007, 37(3): 194-197.
[4] ALIKHAJEH J, KHAJEH K, MANESH M N, RANJBAR B, SAJEDI R H, NADERI-MANESH H. Kinetic analysis, structural studies and prediction of pKa values of Bacillus KR-8104 α-amylase: The determinants of pH-activity profile [J]. Enzyme Microbiology Technology, 2007, 41(2): 337-341.
[5] HAQ I, ASHRAF H, IQBAL J. Production of alpha amylase by Bacillus licheniformis using an economical medium [J]. Bioresource Technology, 2003, 87(5): 57-61.
[6] DJEKRIF D S, GHERIBI A B, MERAIHI Z, BENNAMOUN L. Application of a statistical design to the optimization of culture medium for alpha-amylase production by Aspergillus niger ATCC 16404 grown on orange waste powder [J]. Journal of Food Engineering, 2006, 73(2): 190-197.
[7] SCHMIDELL W, FACCIOTTI M C R, KILIKIAN B V, ABOUTBOUL H, AGUERO J M Z. Influence of pH oscillations in amyloglucosidase production by Aspergillus awamori [J]. Revista de Microbiologia, 1988, 19: 71-77.
[8] FACCIOTTI M C R, KILIKIAN B V, SCHMIDELL W, FACHINI E R. Glucoamylase synthesis in batch process by Aspergillus awamori: Influence of pH and initial polysaccharide concentration [J]. Revista de Microbiologia, 1989, 20: 108-114.
[9] GOGOI B K, BEZBARUAH R L, PILLAI K R, BARUAH J N. Production, purification and characterization of an a-amylase produced by Saccharomycopsis fibuligera [J]. Journal ofApplied Bacteriology, 1987, 63: 373-379.
[10] WA?KO, MONIKA K W, PODLE?NY M, MAGDALENA P B, TARGO?SKI Z, AGNIESZKA K K. The Plackett-Burman design in optimization of media components for biomass production of Lactobacillus rhamnosus OXY [J]. Acta Biologica Hungarica, 2010, 61(3): 344-355.
[11] OTHUMPANGAT S, NAGIN C,SIDAPPA C B. Optimization and interaction of media components in ethanol production using Zymomonas mobilisby response surface methodology [J]. Journal of Bioscience and Bioengineering, 1999, 88(3): 334-338.
[12] FRED J R,VISHAL S. Mixture design as a first step for optimization of fermentation medium for cutinase production fromColletotrichum lindemuthianum [J]. Journal of Industrial Microbiology & Biotechnology, 2007, 34(5): 349-355.
[13] SILVA C, ROBERTO I C. Optimization of xylitol production by Candida guilliermondii FTI 20037 using response surface methodology [J]. Process Biochemistry, 2001, 36(11): 1119-1124.
[14] ACIKEL U, ERSAN M, ACIKEL Y S. Optimization of critical medium components using response surface methodology for lipase production by Rhizopus delemar [J]. Food and Bioproducts Processing, 2010, 88(1): 31-39.
[15] LIU Y, LIU Q, LIN S X. Tree-to-string alignment template for statistical machine translation [C]// Association of Computational Linguistics. Stroudsburg: ASCF, 2006: 609-616.
[16] HE Y Q, TAN T W. Use of response surface methodology to optimize culture medium for production of lipase with Candida sp 99-125 [J]. Journal of Molecular Catalysis B-Enzymatic, 2006, 43(1/4): 9-14.
[17] AHUJA S K, FERREIRA G M, MOREIRA A R. Application of Plackett-Burman design and response surface methodology to achieve exponential growth for aggregated shipworm bacterium [J]. Biotechnology and Bioengineering, 2004, 85(6): 666-675.
[18] DEY G, MITRA A, BANERJEE R, MAITI B R. Enhanced production of amylase by optimization of nutritional constituents using response surface methodology [J]. Journal Biochemistry Engineering, 2001, 7(3): 227-231.
[19] FRANCIS A S, NAMPOOTHIRI K M. Use of response surface methodology for optimizing process parameters for the production of α-amylase by Aspergillus oryzae [J]. Journal Biochemistry Engineering, 2003, 15(11): 278-284.
[20] KUNAMNENI A, KUMAR K S, SINGH S. Response surface methodological approach to optimize the nutritional parameters for enhanced production of alpha amylase in solid state fermentation by Thermomyces lanuginosus [J]. African Journal of Biotechnology, 2005, 4(7): 708-716.
[21] WEISBURG W G, BARNS S M, PELLETIER D A, LANE D J. 16S ribosomal DNA amplification for phylogenetic study [J]. Journal of Bacteriology, 1991, 173(2): 697-703.
[22] MILLER G L. Use of dinitrosalicylic acid reagent for determination of reducing sugar [J]. Analytic Chemistry, 1959, 31: 56-58.
[23] YOO Y J, HONG J, HATCH R T. Comparison of α-amylase activities from different assay methods [J]. Biotechnology and Bioengineering, 1987, 30(4): 147-151.
[24] CHAKRABORTY S, KHOPADE A, KOKARE C, MAHADIK K, CHOPADE B. Isolation and characterization of novel α-amylase from marine Streptomyces sp. D1 [J]. Journal of Molecular Catalysis B: Enzymatic, 2009, 58(1/4): 17-23.
[25] LAEMMLI U K. Cleavage of structural proteins during the assembly of the head of bacteriophage T4 [J]. Nature, 1970, 227: 680-685.
[26] FUKUMOTO J. Studies on the production of bacterial amylase (I): Isolation of bacteria secreting potent amylases and their distribution [J]. Journal Agricultural Chemical Society of Japan, 1943, 19: 487- 503. (in Japanese)
[27] GANGADHARAN D, SIVARAMAKRISHNAN S, NAMPOOTHIRI K M, SUKUMARAN R K, PANDEY A. Response surface methodology for the optimization of alpha amylase production by Bacillus amyloliquefaciens [J]. Bioresource Technology, 2008, 99(11): 4597-4602.
(Edited by HE Yun-bin)
Foundation item: Project(31000350) supported by the National Natural Science Foundation of China; Project(2010CB630902) supported by the National Basic Research Program of China
Received date: 2010-11-18; Accepted date: 2011-04-07
Corresponding author: ZHAO Wei, PhD; Tel: +86-731-88836943; E-mail: wei.zhao.csu@gmail.com

