
Multiscale simulation and nanoindentation experimental study of initial plasticity of Fe single crystal
YUAN Lin(袁 林)1, 2, SHAN De-bin(单德彬)1, 2, GUO Bin(郭 斌)1, 2
1. School of Materials Science and Engineering, Harbin Institute of Technology, Harbin 150001, China;
2. Key Laboratory of Micro-Systems and Micro-Structures Manufacturing, Ministry of Education,
Harbin Institute of Technology, Harbin 150001, China
Received 10 June 2009; accepted 15 August 2009
Abstract: It is very important to understand the initial plastic behavior of metals at microscale. In order to research the initial plasticity of body centered cubic metals in micro-/nano-scale, the multiscale simulation method and experimental study were used to study the nanoindentation process of Fe single crystal. The results show that the first abruption of load―displacement curve in nanoindentation of Fe single crystal can be attributed to the first transition from elastic to plastic deformation characterized by the dislocation emission.
Key words: initial plasticity; nanoindentation; multiscale simulation; dislocation
1 Introduction
Now microelectronics and micromachining drive the need for accurate mechanical characterization of materials at scales approaching the atomic length[1-2]. Nanoindentation is one of the excellent methods to measure the local strength of material at micro-/ nano-scale[3-4]. Specifically, shallow nanoindentations can be adopted to interpret the mechanisms of the initial plasticity and elastic to plastic transition[5]. The simulation and experimental research of nanoindentation indicate that the discontinuities in the load versus displacement curves are due to crack formation[6-7], material transformation[8], dislocation emission[9] and so on. Because atoms movement is involved in the transition from elastic to plastic deformation, it is important to observe the movement of atoms directly[9]. However, currently it is still difficult to obtain in-situ observations of atoms movement from nanoindentation experiments[4-5]. Furthermore, experimental studies may not necessarily be able to explain all aspects of nanoindentation mechanisms.
The molecular dynamics(MD) simulations to date reveal a wealth of phenomena that occur during early indentation, such as dislocation nucleation, phase changes, diffusion and twinning. Then, most current nanoindentation studies are concentrated on using molecular dynamics or combined with nanoindentation experiment. However, because of limitations of time, space and boundary conditions in molecular dynamics, those models were limited to very small sizes or very high loading rates, or even both. In addition, results may not be accurate in the molecular dynamics simulations because of the limitations of boundary conditions. Therefore, the development of multi-scale simulation method has attracted much attention in the field of mechanics, physics and materials science. TADMOR et al[10-12] successfully coupled finite elements and molecular dynamics method and developed the quasicontinuum method (QC).
In this work, the QC method and experiment by nano-indenter were combined to explore the initial plasticity on the body-centered cubic(bcc) Fe single crystal.
2 Multiscale simulations
Fig.1 shows the nanoindentation model used in the simulation. For easier control of the contact between the indenter and surface step, a rigid knife-like flat indenter with a width of 10 ?, is driven down into the  surface of the crystal. Further, the model is essentially two-dimensional (with thickness in the out-of-plane direction equal to the minimal repeated distance in that direction and with periodic boundary conditions applied) by the limitation of current 2D quasicontinuum method implementation. This implies that the out-of-plane displacements are accounted for (as required, for instance, when modeling screw dislocations with the dislocation line perpendicular to the plane of the model), but no spatial variation is permitted in the third direction. However, the atomistic computation is performed in three-dimension with each representative atom being surrounded by a full sphere of neighbors for energy computation purposes. The potentials used in quasicontinuum method are the standard potentials used in 3D atomistic simulations. Perfect stick condition between the indenter and crystal is assumed.
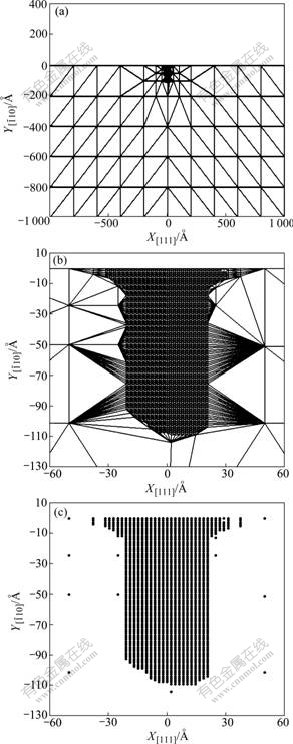
Fig.1 Schematic representation of nanoindentation model for indentation of Fe single crystal: (a) Total model; (b) Mesh under indenter; (c) Atoms snapshot under indenter
The system size is selected to ensure that far-field boundary conditions do not affect the behavior in the vicinity of indenter. The QC method proceeds through molecular static energy minimization over an atomistic (non-local) domain and a finite element (local) domain. The constitutive law in these two domains is chosen as the embedded atom(EAM) potential for Fe[13]. The atomistic simulation and finite element computation are employed in the non-local and local domains, respectively. The indenter is lowered in the increment is 0.2 ? (it was found to be the largest stable displacement increment in this convergence test), then relaxed until the displacements of all atoms and nodes during a step are less than 10-9 ?.
In order to study the movement of atoms in the elastic-to-plastic transition, the atoms snapshot and corresponding out-of-plane displacements experienced by the atoms are investigated. Figs.2 and 3 show the atoms snapshot and corresponding out-of-plane plots in the model at the 30th and 31st step, respectively. The atoms arrange regularly under the indenter and no dislocation is nucleated when the indentation depth reaches 6.0 ? at the 30th step. However, dislocations nucleate under the indenter at the 31st step. The dislocations have been emitted beneath the indenter tips. The dislocated structure beneath the indenter is given in Fig.3 along with the out-of-plane displacements experienced by the atoms. Fig.4 shows the atoms snapshot and corresponding out-of-plane displacement plots in the model at the last step. It is shown that the first dislocation emission results in the discontinuity in the load versus displacement curve.
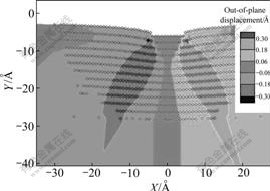
Fig.2 Snapshot of atoms under indenter and corresponding out-of-plane displacement plot at the 30th step
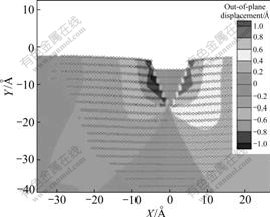
Fig.3 Snapshot of atoms under indenter and corresponding out-of-plane displacement plot at the 31th step
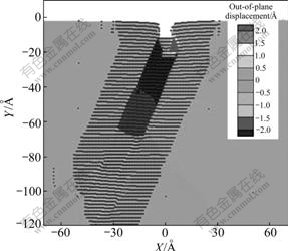
Fig.4 Snapshot of atoms under indenter and corresponding out-of-plane displacement plot at the last step
To understand the initial plasticity, a study was carried out on the load―displacement curve of nano- indentation model. Fig.5 shows the load―displacement curve in the nanoindentation model. The curve was obtained after 60 steps. The critical load of the first dislocation emission (namely the peak of the load―displacement curves) in the model is 17.879 eV/? which corresponds to a hardness (i.e., mean pressure) of 18.51 GPa (Fig.5). This indicates that the initial plasticity initiates at the peak of the displacement―load curve in nanoindentation.
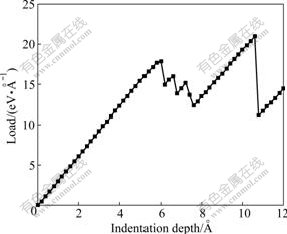
Fig.5 Load―displacement curve of nanoindentation using QC simulation
3 Nanoindentation experiments
The equipment used in this study is TriboIndenter produced by Hysitron in the United States. It is particularly suitable to investigate the deformation behavior of shallow nanoindentations, in which distinguishing feature is rapid in situ imaging. The resolutions of load and dislocation are less than 0.1 nN and 0.000 02 nm. To ensure accurate results of experiments, the process must be strictly controlled.
Before indentation, the sample is prepared by mechanical polishing, electrolytic polishing and vacuum annealing, and the latter two processes are repeated until the sample surface meets requirement. Surface observation should be carried out before nanoindentation, to ensure that the region under indenter is of small roughness. The maximum load is 200 mN. The loading time, holding time and unloading time are 10, 10 and 10 s, respectively. Fig.6 presents the scanning image of Fe (111) surface after indentation by the Berkovich indenter. The white region corresponds to the stacking of material around the indenter.
Fig.7 shows the load―displacement curve and another curve for the above indentation and another indentation at different position, which is discontinuous. In the nanoindentation experiments, the same phenomenon is observed commonly. However, the reasons are various, for example, the oxide fracture, phase transformation and dislocation emission[14]. Fig.6 proves that there is no crack around the indented region. If the load is withdrawn once the curve drops, the configuration of the surface will restore. So, it can be concluded that this phenomenon results from dislocation emission, which corresponds to initial plasticity.
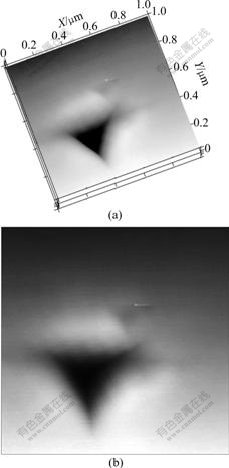
Fig.6 Scanning images of nanoindentation region of Fe single crystal: (a) Three-dimensional image of surface; (b) Two- dimensional image of surface
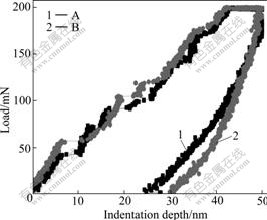
Fig.7 Load―displacement curves of nanoindentation on Fe(111) single crystal
Fig.8 presents two curves from experiments in the same situation, but different indent positions. It can be observed that all curves are discontinuous, in which combining former simulations further proves the above conclusion. However, the dislocation emits when the indent depth reaches only several angstrom in the simulations, while in the order of nanometer for these experiments. The reason is that the real indenter size is much larger than simulated one.
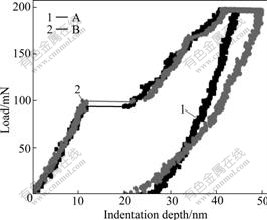
Fig.8 Load―displacement curves of nanoindentation on Fe(111) single crystal at different position
The displacement in Fig.7 and Fig.8 initially jumps with a width of about 4-10 nm, with regard to the Fe Burger vector, which corresponds to the activity of about twenty slip systems. The width of initial displacement jump in Fig.7 and Fig.8 is 4, 4, 10, 10 nm, corresponding to approximately twenty slip systems activated. The result shows that it is inappropriate that many researchers attempted to use nanoindentation experiment to study the nucleation and motion of a single dislocation. Although the local shear stress is high enough to nucleate dislocations, the resolution of the current equipment is not enough to observe the motion of single dislocation.
4 Conclusions
1) The multi-scale simulation method can be used to study initial plastic deformation behavior, and the dimension simulated can be greatly improved.
2) The first abruption of load―displacement curve in nanoindentation of Fe single crystal is due to the first transition from elastic to plastic deformation characterized by the dislocation emission.
Acknowledgment
The authors would like to thank Dr. Ellad B. Tadmor for the source codes and many useful discussions, and Associate Prof. J. H. Wang at Harbin Institute of Technology for valuable discussions.
References
[1] ZIMMERMAN J A. Materials science―Plastic parameter [J]. Nature, 2002, 418(6895): 285-286.
[2] MINOR A M, ASIF S A, SHAN Z W, STACH E A, CYRANKOWSKI E, WYROBEK T J, WARREN O L. A new view of the onset of plasticity during the nanoindentation of aluminium [J]. Nature Materials, 2006, 5(9): 697-702.
[3] SCHALL P, COHEN I, WEITZ D A, SPAEPEN F. Visualizing dislocation nucleation by indenting colloidal crystals [J]. Nature, 2006, 440(7082): 319-323.
[4] SCHUH C A. Nanoindentation studies of materials [J]. Materials Today, 2006, 9(5): 32-40.
[5] SZLUFARSKA I. Atomistic simulations of nanoindentation [J]. Materials Today, 2006, 9(5): 42-50.
[6] DOERNER M F, NIX W D. A method for interpreting the data from depth-sensing indentation instruments [J]. J Mat Res, 1986, 1(4): 601-609.
[7] PETHICA J B, HUTCHINGS R, OLIVER W C. Hardness measurement at penetration depths as small as 20 nm [J]. Phil Mag A, 1983, 48: 593-606.
[8] DOMNICH V, GOGOTSI Y, DUB S. Effect of phase transformations on the shape of the unloading curve in the nanoindentation of silicon [J]. Appl Phys Lett, 2000, 76(16): 2214-2216.
[9] CORCORAN S G, COLTON R J. Anomalous plastic deformation at surfaces: Nanoindentation of gold single crystals [J]. Phys Rev B, 1997, 55: R16057-R16060.
[10] TADMOR E B, PHILLIPS R, ORTIZ M. Mixed atomistic and continuum models of deformation in solids [J]. Langmuir, 1996, 12: 4529-4534.
[11] TADMOR E B, ORTIZ M, PHILLIPS R. Quasicontinuum analysis of defects in solids [J]. Philosophical Magazine A, 1996, 73: 1529-1563.
[12] TADMOR E B, MILLER R, PHILLIPS R, ORTIZ M. Nanoindentation and incipient plasticity [J]. Journal of Materials Research, 1999, 14: 2233-2250.
[13] DAW M S, BASKES M I. Embedded atom method: derivation and application to impurities, surface, and other defects in metals [J]. Phys Revi B, 1984, 29(12): 6443-6453.
[14] BAHR D F, KRAMER D E, GERBERICH W W. Non-linear deformation mechanisms during nanoindentation [J]. Acta Mater, 1998, 46(10): 3605-3617.
(Edited by YANG Bing)
Foundation item: Project(50705020) supported by the National Natural Science Foundation of China; Project(2006AA04Z316) supported by the High-tech Research and Development Program of China; Project(JC-06-07) supported by the Science Foundation for Distinguished Young Scholars of Heilongjiang Province, China
Corresponding author: YUAN Lin; Tel: +86-451-86416221, +86-451-86418732; E-mail: yuanlin@hit.edu.cn

