J. Cent. South Univ. Technol. (2007)04-0456-04
DOI: 10.1007/s11771-007-0089-x 
Modeling effects of constituents and dispersoids on tensile ductility of aluminum alloy
SONG Min(�� �G), CHEN Kang-hua(�¿���), QI Xiong-wei(����ΰ)
(State Key Laboratory of Powder Metallurgy, Central South University, Changsha 410083, China)
____________________________________________________________________
Abstract: The modeling effects of constituents and dispersoids on the tensile ductility of aluminum alloy were studied. The results show that the tensile ductility decreases with the increase of the volume fraction and size of constituents. Thus, purification can improve the tensile ductility by decreasing the volume fraction of constituents (normally compositions of Fe and Si) and the first-class microcracks. The model also indicates that the tensile ductility decreases with the increase in the volume fraction of dispersoids. Decreasing the volume fraction of dispersoids along the grain boundaries by proper heat-treatment and improving the cohesion strength between dispersoids and matrix can also improve the tensile ductility by decreasing the volume fraction of the second-class microcracks.
Key words: aluminum alloy; tensile ductility; modeling; deformation; fracture
____________________________________________________________________
1 Introduction
High strength and low density have made aluminum alloys the primary material for application in aircraft. However, normally the improvement in strength will decrease the tensile ductility and limit their further commercial application. Thus, extensive researches[1-12] have been made to examine the relationship between tensile ductility and microstructures. These researches indicate that coarse constituents (brittle phase formed by the impurities and excessive alloying elements) and dispersoids along the grain boundaries are the initiations of fracture and can be treated as pre-existed microcracks. Based on the above assumption, several models[6-9] have been developed to describe the relationship between tensile ductility and microcracks. For simplicity, these models assume that the microcracks have the same size. However, the microcracks caused by coarse constituents and by dispersoids along the grain boundary have different sizes, and thus the developed models are oversimplified. Coarse constituents result from the presence of Fe and Si impurities or excessive amounts of major alloying elements, normally 5-30 ��m in size, while the microcracks at grain boundaries result from stable phase caused by heterogeneous precipitation along the grain boundaries with the size of 0.1-0.5 ��m [6]. As a first step, a multi-scaled microcrack model (including two types of microcracks described above) to describe the relationship between tensile ductility and volume fraction of the microcracks was developed in this paper.
2 Development of model
Fig.1 shows SEM and TEM images of the microcracks caused by constituents and dispersoids in Al-Cu-Mg alloy after deformation[8]. It can be seen that the sizes of the microcracks caused by constituents are in the range of 5-20 ��m, while those of the microcracks caused by dispersoids are about 200 nm.
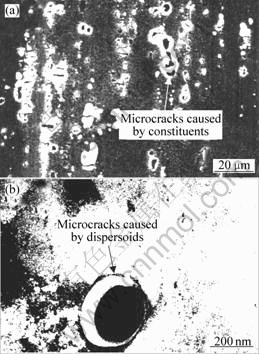
Fig.1 Microcracks caused by (a) constituents (SEM micrograph) and (b) dispersoids (TEM micrograph) in Al-Cu-Mg alloy
To develop a mechanical model, some assumptions must be made to simplify the mathematic calculation. Since coarse constituents will fracture readily under loading, they have been treated as the first-class microcracks directly, with dimension of 2a. Dispersoids along the grain boundaries will be easily separated from the boundaries and initiate microcracks. These microcracks have been treated as the second-class microcracks, with dimension of 2b. For simplicity, assume that microcracks distribute uniformly, as shown in Fig.2.
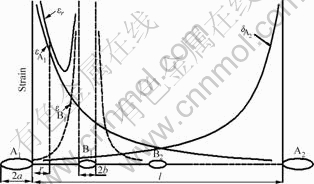
Fig.2 Geometric model for tensile ductility
First, assume that only one second-class microcrack (B1) exists in the middle of the two neighboring first-class microcracks (A1 and A2). Thus, at a distance, r (r is between microcracks A1 and B1, see in Fig.2), ahead of microcrack A1, the strain caused by microcracks A1, A2 and B1 is given as follows[13-14]
 (1)
(1)
 (2)
(2)
 (3)
(3)
where J is the J-integral, ��y is the yield strain, ��y is the yield stress, n is the inverse of the strain hardening exponent, �� is the material constant in the Ramberg- Osgood constitutive relation[15], and In and 
are the normalized parameters in the HRR- field[13-14].
The J-integral can be separated into elastic (Je) and plastic (Jp) components. For aluminum alloy, Je is much smaller than Jp and can be ignored. Thus the J-integral is given as follows[16]
 (4)
(4)
 (5)
(5)
 (6)
(6)
where ��p is plastic strain,  . Substituting Eqns.(4)-(6) into Eqns.(1)-(3), respectively, leads to
 (7)
(7)
 (8)
(8)
 (9)
(9)
where  Adding Eqns.(7) -(9) leads to
 (10)
(10)
If m second-class microcracks distribute uniformly between microcracks A1 and A2, Eqn.(10) changes to
 (11)
(11)
When the local effective strain, ��ij, at location r in the matrix ligament reaches the matrix fracture strain, ��mf, the plastic strain, ��p, reaches the nominal fracture strain, ��f, or tensile ductility at the onset of fracture. Thus, Eqn.(11) changes to
 (12)
(12)
Thus, a normalized fracture strain ratio, R, can be obtained
R=��f/��f(0) (13)
where ��f(0) is the reference fracture strain, normally means the fracture strain for the alloy without constituents and dispersoids. In Eqn.(13), R was used to describe the ratio between the tested alloy and the reference alloy.
For a cubic array, the volume fraction (f ) of the microcracks (in other words, it means the volume fraction of constituents and dispersoids) is a function of mean radius (a and b) and the interspacing ��[11]:
 (14)
(14)
where K is the aspect ratio of the microcracks. For second-class microcracks caused by spherical dispersoids, KB=1. For first-class microcracks caused by disk-shaped constituents, KA is defined as the ratio between the radius of the plate plane to the half height of the disc, while for first-class microcracks caused by spherical constituents, KA=1. Since the volume fraction of the first-class and second-class microcracks cannot be set as zero at the same time in Eqns.(12) and (13), in this study, it is assumed that the material is free of microcracks when the volume fraction of the first-class microcracks (constituents) is as low as 0.01% and that of the second-class microcracks is zero (reference condition).
3 Evaluation of model
In some ductile materials such as aluminum alloy, plastic yield zones usually exist in front of the microcrack tips, and normally the size of the plastic yield zone, d, is close to the microcrack size. Assuming r is of the size of plastic yield zone, thus, d=r=2a has been used in the calculation.
Fig.3 shows the normalized tensile ductility as a function of the volume fraction of constituents (first-class microcracks). Some previous experimental data[17] have also been included in Fig.3. Since the aspect ratio has obvious effect on the tensile ductility, the calculation includes the effect of the aspect ratio. It can be seen that the model prediction agrees well with the experimental data. The normalized tensile ductility decreases as the volume fraction of constituents increases, no matter what value K is. This indicates that low purity or high volume fraction of constituents degrades the tensile ductility of aluminum alloy. Thus, purification is an effective method to improve the tensile ductility. It can also be seen that the normalized tensile ductility increases as the K value increases when the volume fraction of constituents remains constant. Actually, high stress concentration will be generated at the microcrack tip if the stress direction is perpendicular to the crack plane (small K value); while no high stress concentration will be generated at the microcrack tip if the stress direction is parallel to the crack plane (large K value).

Fig.3 Effect of volume fraction of constituents (size remains constant) on normalized tensile ductility (experimental data from Ref.[17])
Fig.4 illustrates the effect of the size of constituents on the normalized tensile ductility of aluminum alloy (assuming K=1 and the distance of two neighboring constituents remains constant). It can be seen that the normalized tensile ductility decreases dramatically as the size of constituent increases. During deformation, large-sized constituents will generate large-sized microcracks and the large-sized microcracks propagate easily even at low stress and strain.
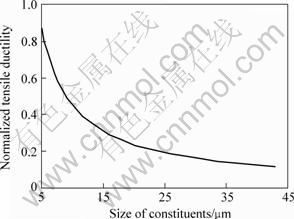
Fig.4 Effect of size of constituents (distance between constituents remains constant) on normalized tensile ductility
For aluminum alloy, first-class microcracks are initiated from constituents during the early stage of the deformation process. Thus, the higher the volume fraction and the larger the size of constituents, the lower the tensile ductility. Normally in 2������and 7������ series alloys, the chemical compositions of the constituents are Al20Cu2(Fe, Mn)3 and Mg2Si[17]. Decreasing the contents of Fe and Si elements and improving the purity of Al matrix will improve the tensile ductility of aluminum alloy.
Fig.5 shows the normalized tensile ductility as a function of the volume fraction of the second-class microcracks. The reference was set as the fracture strain of the materials only with the first-class microcracks. The size and volume fraction of the first-class microcracks (constituents) are 20 ��m and 1% (distance between two neighboring first-class microcracks is 85.66 ��m), respectively. It can be seen that the normalized tensile ductility decreases with the increase in the volume fraction of the second-class microcracks. It should be noted that the normalized tensile ductility decreases dramatically in the very beginning (the appearance of the second-class microcracks), and then the decreasing velocity decreases. The sharp decrease in the normalized tensile ductility with the appearance of the second-class microcracks is due to the decrease in the ligament size. The ligament size is 65.66 ��m (85.66-2a) without the second-class microcracks, and it decreases in half with the appearance of the second-class microcracks, which increases the strain concentration and decreases the normalized tensile ductility.
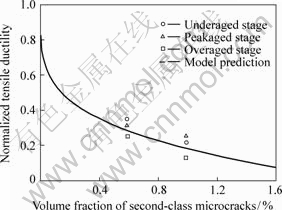
Fig.5 Effect of volume fraction of second-class microcracks on normalized tensile ductility (experimental data from Ref.[18])
The second-class microcracks are from dispersoids along the grain boundaries. Since particle-free zones (PFZ) exist near the grain boundaries and the strength of these zones is weak, high stress concentration is generated during deformation, which causes the dispersoids to separate from the matrix and forms microcracks (see Fig.1(b)). A previous study indicated that the quenching rate has strong effect on the volume fraction of dispersoids in 7050 aluminum alloy and thus on the tensile ductility[18]. The volume fraction of dispersoids by fast quenching rate (850 K/s) is about 0.5%, while that by medium quenching rate (19 K/s) is about 1.0%. The transferred normalized tensile ductility data from Ref.[18] have also been included in Fig.5. It can be seen that the values predicted by the model agree well with the experimental data.
It should be noted that not all dispersoids distributed along the grain boundaries will initiate microcracks during deformation. Normally, only the dispersoids with high stress concentration along the interface and low cohesion with the matrix will separate from the matrix. Thus, improving the cohesion strength and decreasing the stress concentration during deformation can improve the tensile ductility of aluminum alloy by decreasing the volume fraction of the second-class microcracks.
4 Conclusions
A multi-scaled model for tensile ductility of aluminum alloy was developed. It is shown that the tensile ductility decreases with the increase in volume fraction of the first-class and second-class microcracks. Normally decreasing Fe and Si impurities can decrease the volume fraction of constituents and improve the tensile ductility. Decreasing the volume fraction and increasing the cohesion strength of dispersoids along the grain boundaries can also improve the tensile ductility by decreasing the volume fraction of the second-class microcracks.
References
[1] LUDTKA G M, LAUGHLIN D E. The influence of microstructure and strength on the fracture mode and toughness of 7������ series aluminum alloys[J]. Metall Trans A, 1982, 13(2): 411-425.
[2] DESHPANDE N U, GOKHALE A M, DENZER D K, et al. Relationship between fracture toughness, fracture path, and microstructure of 7050 aluminum alloy: Part I. Quantitative characterization[J]. Metall Trans A, 1998, 29(5): 1191-1201.
[3] HORNBOGEN E, GR?F M. Fracture toughness of precipitation hardened alloys containing narrow soft zones at grain boundaries[J]. Acta Metall, 1977, 25(4): 877-881.
[4] JATA K V, STARKE E A. Fatigue crack growth and fracture toughness behavior of an Al-Li-Cu alloy[J]. Metall Trans A, 1986, 17(5): 1011-1026.
[5] LIU Gang, ZHANG Guo-jun, DING Xiang-dong, et al. A model for fracture toughness of high strength aluminum alloys containing second particles of various sized scales[J]. The Chinese Journal of Nonferrous Metals, 2002, 12(3): 706-713. (in Chinese)
[6] HORNBOGEN E, STARKE E A. Theory assisted design of high strength low alloy aluminum[J]. Acta Metall Mater, 1993, 41(1): 1-16.
[7] GOKHALE A M, DESHPANDE N U, DENZER D K, et al. Relationship between fracture toughness, fracture path, and microstructure of 7050 aluminum alloy: Part II. Multiple micromechanisms-based fracture toughness model[J]. Metall Trans A, 1998, 29(6): 1203-1210.
[8] LIU G, ZHANG G J, DING X D, et al. The influence of multiscale-sized second-phase particles on ductility of aged aluminum alloys[J]. Metall Trans A, 2004, 35(10): 1725-1734.
[9] ROVEN H J. A model for fracture toughness prediction in aluminum alloys exhibiting the slip band decohesion mechanism[J]. Scripta Metall Mater, 1992, 26(5): 1383-1391.
[10] LIU G, SUN J, NAN C W, et al. Experimental and multiscale modeling of the coupled influence of constituents and precipitates on the ductile fracture of heat-treatable aluminum alloys[J]. Acta Mater, 2005, 53(10): 3459-3468.
[11] LIU G, ZHANG G J, DING X D, et al. Dependence of fracture toughness on multiscale second phase particles in high strength Al alloys[J]. Mater Sci Tech, 2003, 19(7): 887-896.
[12] LIU Gang, ZHANG Guo-jun, DING Xiang-dong, et al. Model for tensile ductility of high strength Al alloys containing second particles of various sized scales[J]. The Chinese Journal of Nonferrous Metals, 2002, 12(1): 1-10. (in Chinese)
[13] HUTCHINSON J W. Singular behavior at the end of a tensile crack in a hardening material[J]. J Mech Phys Solids, 1968, 16(1): 13-31.
[14] RICE J R, ROSENGREN G F. Plane strain deformation near a crack tip in a power-law hardening material[J]. J Mech Phys Solids, 1968, 16(1): 1-12.
[15] KANNINEN M F, POPELAR C H. Advanced Fracture Mechanics[M]. New York: Oxford University Press, 1985: 300.
[16] DOWLING N E. J-integral estimates for cracks in infinite bodies[J]. Eng Fract Mech, 1987, 26(2): 333-348.
[17] WALSH J A, JATA K V, STARKE E A. The influence of Mn dispersoid content and stress state on ductile fracture of 2134 type Al alloys[J]. Acta Metall, 1989, 37(9): 2861-2871.
[18] DUMONT D, DESCHAMPS A, BRECHET Y. On the relationship between microstructure, strength and toughness in AA7050 aluminum alloy[J]. Mater Sci Eng A, 2003, A356: 326-336.
_________________________
Foundation item: Project (2005CB623704) supported by National Key Fundamental Research and Development Program of China
Received date: 2006-08-24; Accepted date: 2006-09-27
Corresponding author: SONG Min, PhD; Tel: +86-731-8877880; E-mail: msong@mail.csu.edu.cn
(Edited by ZHAO Jun)
