J. Cent. South Univ. (2017) 24: 1299-1306
DOI: 10.1007/s11771-017-3535-4

Outlier detection based on multi-dimensional clustering and local density
SHOU Zhao-yu(������), LI Meng-ya(����ѿ), LI Si-min(��˼��)
School of Information and Communication Engineering, Guilin University of Electronic Technology,Guilin 541004, China
 Central South University Press and Springer-Verlag Berlin Heidelberg 2017
Abstract: Outlier detection is an important task in data mining. In fact, it is difficult to find the clustering centers in some sophisticated multidimensional datasets and to measure the deviation degree of each potential outlier. In this work, an effective outlier detection method based on multi-dimensional clustering and local density (ODBMCLD) is proposed. ODBMCLD firstly identifies the center objects by the local density peak of data objects, and clusters the whole dataset based on the center objects. Then, outlier objects belonging to different clusters will be marked as candidates of abnormal data. Finally, the top N points among these abnormal candidates are chosen as final anomaly objects with high outlier factors. The feasibility and effectiveness of the method are verified by experiments.
Key words: data mining; outlier detection; outlier detection method based on multi-dimensional clustering and local density (ODBMCLD) algorithm; deviation degree
1 Introduction
Outlier detection [1] is an important research in data mining. There is a most well-known definition of an outlier [2] that an outlier is an observation which deviates so much from other observations as to arouse suspicions generated by a different mechanism. The main objective in outlier detection is to quickly detect abnormal data that do not meet the normal (expected) behavior from the complex data environment, providing deep analysis and understanding for users. In recent years, outlier detection has been widely applied in fraudulent credit card, stock insider trading, network intrusion, medical health, military reconnaissance and the security of critical system, etc. In most science aspects, outliers stand for new information and give rise to novel theories and applications. So, doing research into outliers shows great theoretical and practical value. As outlier detection requires real-time processing of data stream [3], the efficiency of algorithm becomes extremely important. The datasets that we handle are not only huge but also multidimensional, and the distribution is uneven. For all these characteristics, such problems should be taken into account, including the dimension and the mass center of high density areas.
Existing outlier detection methods are mainly based on classification [4-8], nearest neighbor [9-13] and clustering [14-20]. Commonly used methods based on classification are rule method, NN (neural networks) method and SVM (support vector machine) method, whose models are easy to understand and suitable to analyze the normal datasets. However, these models need priori knowledge and their applications are limited to some extent. Outlier detection methods that most current scholars have been researching are based on clustering and nearest neighbor. Among these methods, density- based spatial clustering of application with noise (DBSCAN) proposed by the ESTER et al [18], has achieved remarkable success. The basic idea is that for every point in the cluster, there should be at least a specific number of points within its given radius. It is a kind of clustering method based on connected components of high density, which can categorize high density areas into some clusters and discover clusters of arbitrary shapes with noise. However, it is difficult to determine the required parameters, one is the maximum radius of a neighborhood, and the other is the minimum number of the data points contained in such neighborhood. Both are sensitive to outliers. DENG et al [20] proposed the fast OPTICS algorithm improved from DBSCAN algorithm, generating clusters implicitly. It just ranks these objects in the collection to obtain an ordered list, and the main advantage is the insensitivity Foundation item: Project(61362021) supported by the National Natural Science Foundation of China; Project(2016GXNSFAA380149) supported by Natural Science Foundation of Guangxi Province, China; Projects(2016YJCXB02, 2017YJCX34) supported by Innovation Project of GUET Graduate Education, China; Project(2011KF11) supported by the Key Laboratory of Cognitive Radio and Information Processing, Ministry of Education, China to input parameters. The local outlier factor (LOF) algorithm proposed by BHATT et al [13] aims to assign a degree of being an outlier for each object, and it is more meaningful than the common methods which regard the outlier value as a binary property. However, LOF method calculates the LOF value for each point by traversing the entire data set, which limits the speed of the algorithm. Meanwhile, as the normal points are far more than outliers, LOF method needs to judge the deviation degree by comparing the LOF values of all the points, which will generate unnecessary calculation, increasing the time cost and wasting lots of space for storing huge amount of intermediate results.
2 Related definitions and calculation methods
In order to better describe outlier detection method based on density and multi-dimensional clustering, some definitions in the algorithm are defined below.
Definition 1: Distance measurement. X={x1, x2, ��, xn}, Y={y1, y2, ��, yn} where X, Y are the two data objects; n is the number of attributes; then the distance can be defined as

Definition 2: k-distance of an object p. For any positive integer k, the k-distance of object p, denoted as k-distance(p), is defined as the distance d(p, o) between p and an object, such that: 1) for at least k objects
  it holds tha
  2) for at most k-1 objects
  it holds that
Definition 3: k-distance neighborhood of an object p. The k-distance neighborhood of an object p contains the set of those objects whose distances from p are not greater than the k-distance, namely, 
 The object q is called the k-nearest neighbor of p.
Definition 4: Reachability distance from an object p to an object o. The reachable distance from an object p to an object o can be defined as 

Definition 5: Local density. In this work, an algorithm for calculating the local density is proposed. The local density of an object point o is shown by ��o as follows:
 (1)
(1)
As shown in Fig. 1, the local density of o is related to the number of objects in its k distance neighborhood, while ignoring the objects far away from o. Equation (1), as the data points far away from o show a tiny effect on the local density of o, the approximate calculation is adopted here.
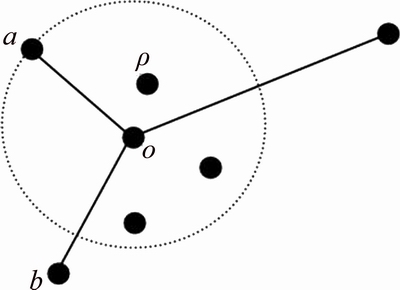
Fig. 1 Local density
Definition 6: Cluster dissimilar measure. Clustering dissimilarity is a new metric proposed in this work. It indicates the dissimilarity between data objects in clusters. The symbol Ri represents the dissimilarity of the ith data object. The definition is shown as
 (2)
(2)
Assume that  is the descending order of subscript of
 meeting
 From Eq. (2), the dissimilarity is the largest
 providing that the data point o has the highest local density. On the contrary, the smallest dissimilarity is dmin(o, p)
  as shown in Fig. 2.
Figure 2(a) contains 28 data points, and Fig. 2(b) shows the result about the local density and dissimilarity of each data point after calculating with the definitions (5) and (6). In Fig. 2(b), the marks 6 and 21 indicate the center points of clusters in Fig. 2(a), which have the high density and the large dissimilarity. Meanwhile, the local density of point 5 is close to that of point 6, but they have very different dissimilarity, then point 5 can be assigned to its nearest center point 6. At the same time, the local densities of points 5 and 21 are almost the same. However, the distance between them is so far, so this will form a new clustering center.
Definition 7: Outlier judgment factor. The outlier judgment factor is determined by the local density of the data object and clustering dissimilarity. According to Fig. 2(b), points 16 and 17 can be judged as abnormal. The local density of the data object point is small, and it��s clustering dissimilarity is large. It can be represented by foif(i).

Fig. 2 Cluster dissimilarity:
 (3)
(3)
According to Eq. (3), the function is convergent when Ri is bigger and ��i is smaller.
3 ODBMCLD clustering algorithm
The method of outlier detection presented in this work is based on density and multi-dimensional clustering. It needs to group data objects into multiple classes or clusters, without relying on previously identified data sets. Dividing the dataset makes objects in the same cluster as close as possible and otherwise between different clusters is different as possible. In this work, the process and implementation of ODBMCLD clustering algorithm are discussed. In the dataset D, there are N data objects D={X1, X2, ��, XN}, and each object X contains n attributes, namely X={x1, x2, ��, xn}.
According to Eq. (2), the local density ��o of the data object o is calculated, and after sorting the local density ��o, the biggest ��o can be obtained. By constantly looking for the nearest objects, those objects in its neighborhood can be assigned to its cluster. However, when those objects are not in any specified neighborhood of a cluster, they are marked as new clustering centers. Figures 3 show the clustering results of performing ODBMCLD over three different datasets. Algorithm 1 is introduced to determine the center of dataset and the clustering centers of clusters which objects belong, as shown below.
In Fig. 3, it shows the results of simulation by Algorithm 1, using Spirals, Flame and Aggregation datasets. Their shapes of distribution and density are different. By ODBMCLD method, it is easy to find their clustering center points and assign other objects to the nearest clusters. Figure 3 shows intuitively the density of points of non-uniform distribution, all showing fine results of clustering. They are commonly used in clustering, and using ODBMCLD can obtain accurate clustering results.
Algorithm 1: ODBMCLD clustering
Input: D, the set of data points;
k, k-distance neighborhood; d, distance measurement of d(i, j);
��Xi, the local density of Xi in D; Cclu_id, cluster ID; Ccenter_id, cluster center ID;
Cclu_label, cluster label;
begin:
1: Cclu_id=0; Ccenter_id=0; Cclu_label(i)=0
2: sort ��Xi to 
3: according to Eq. (2), calculate Rqi
4: while Rqi >k do
5:Cclu_id=Clu_id+1
6:
7:
8: for i=1:N do
9:Cclu_label(qi)=Cclu_label(nqi)
Output: Center_id, Cclu_label
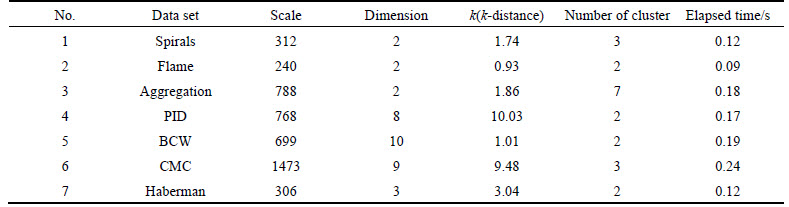
In Table 1, the efficiencies of clustering of ODBMCLD on small data sets are validated. Nos. 1-3 are chosen from a common clustering data set and Nos. 4-7 data sets are chosen from UCI. They have different scale and dimension and to set different k-distance can accurately determine the number of clustering center and clustering.
4 ODBMCLD outlier detection
From Algorithm 1, the clustering center is known. Only the boundary points are considered, and by calculating the abnormal factors by Eq. (3), the top N objects can be determined. The detailed algorithm is shown as Algorithm 2:
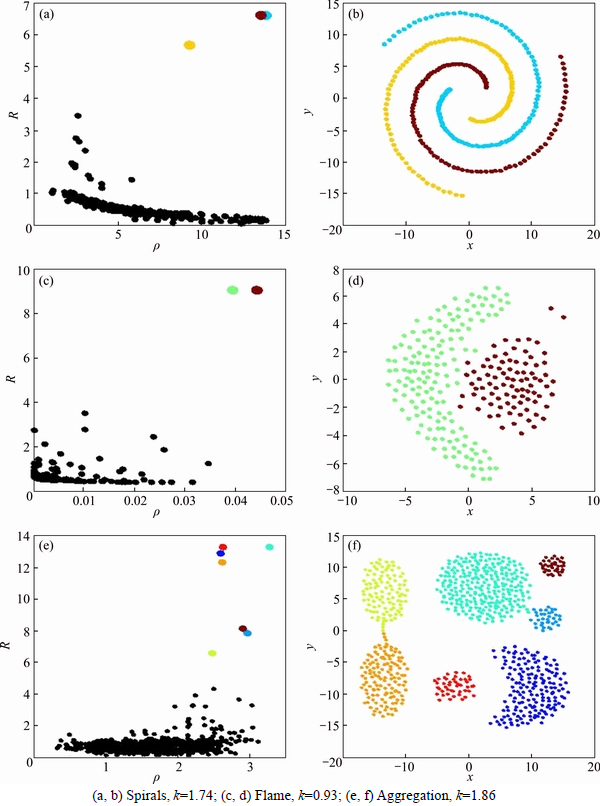
Fig. 3 Clustering result of ODBMCLD:
Table 1 Result of experiment on small data sets
Algorithm 2: ODBMCLD outlier detection
Input: D, the set of data points;
Cclu_label(i), cluster label; Oout_label, outlier label; foif(i), outlier judgment factor;
d, distance measurement of d(i, j); k, k-distance neighborhood;
begin:
1: i=1
2: j=i+1
3: while ((Cclu_label(i)!=Cclu_label(j))&&(d(i, j)<=k)) and i, j��N do
4:according to Eq. (3), calculate foif(i)
5:i=j+1
6:j=j+1
7: ascending order of foif(i)
8:Oout_label(i) is top N of foif(i)
Output: Oout_label
According to the cluster labels derived from Algorithm 1, objects between clusters have different labels, and they can��t be judged precisely. In Algorithm 2, if those objects have different labels, and the distances between them are less than k-distance, they will be marked as candidate outliers, and will be confirmed if they are real outliers according to Definition 7. In next part, experiments are developed to examine the feasibility and effectiveness.
5 Experimental results and analysis
In this section, experiments are conducted to verify the effectiveness of the proposed algorithm on both synthetic and real datasets. All the experiments are performed in Matlab R2010a on Intel Core i5-5200U, 2.7 GHz, with 8 GB memory running on Windows 1064 bit. In particular, the first part validates the availability of the ODBMCLD on synthetic datasets. The second part verifies the outperformance of ODBMCLD on real datasets compared with the other three algorithms.
5.1 Experiments on synthetic datasets
In this section, to intuitively show the performance of the proposed algorithm, the three-dimensional dataset is generated, shown in Fig. 4(a). Some experiments to verify the validity of ODBMCLD algorithm are conducted, and it is easy to figure out how the parameter k affects the performance of ODBMCLD. Also the optimal parameter k can be determined by human intervention. The approach that we adopt is to choose the first t of d(i, j) list after ranking d(i, j) in an ascending order. Figure 4(a) shows a test of the original data set, and Figs. 4(b)-(f) show the results when t varies with 1.0%, 2.0%, 3.0%, 4.0% and 5.0%. There are eight different kinds of color, and the dark blue points set is identified as outliers. It can be seen that it works best when t is determined as 2.0%. Figure 4(g) shows the result only outlier and Fig. 4(h) shows the result without outlier when t is 2.0%. The only parameter needed in ODBMCLD is k-distance, and ODBMCLD can always get the exact number of clusters even when the k-distance is not determined properly, so high stability and accuracy can be obtained. The experimental results show that ODBMCLD algorithm is feasible and can achieve the desired effect.
5.2 Experiments on real datasets
The effectiveness of the proposed algorithm is verified by experiments on synthetic random datasets. In this section, contrast experiments are conducted on real datasets taken from UCI machine learning repository to further validate the priority over other algorithms. The detection rate and accuracy of other algorithms are compared.
The objects will be classified into positive and negative. The true positive (TP) means the rate that the true normal objects are correctly detected as normal in the result. The false positive stands for the rate that the outlier is detected as normal falsely. So it is with true negative (TN) and false negative (FN). The final detection rate is defined as the ratio between the number of outliers detected by the system (true positive) to the total number of outliers presented in the dataset, i.e. Detection rate=(TP)/(TP+FP), and accuracy is the ratio between the number of correctly detected outliers and normal objects to the total number of objects in the whole datasets, i.e. Accuracy=(TP+TN)/(TP+TN+FP+ FN).
The detection rate and accuracy of the proposed algorithm are verified by the following contrast experiments in comparison with the existing approaches (K-means [15], DBSCAN [18], LOF [13]). Real data sets taken from UCI machine learning repository are shown in Table 2 (n is the number of objects in each dataset, m is the number of dimensions of each dataset). The results of detection rate and accuracy of different approaches to different datasets are shown in Table 3, Table 4 and Fig. 5.
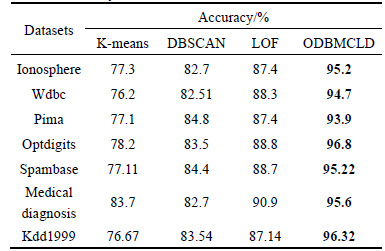
From Table 3 and Fig. 5(a), it is obvious that ODBMCLD has higher detection rate in most situations (Ionosphere, Wdbc, Optdigits, Spambase, Kdd1999), and LOF performs slightly better in small datasets (Pima, Medical diagnosis). Table 4 and Fig. 5(b) show the accuracy of the four different approaches, and ODBMCLD has much better accuracy than the other three approaches. Taking all the detection rate and accuracy into account, ODBMCLD has higher detection rate and better accuracy. In some small datasets, LOF shows close performance with ODBMCLD, but for much larger datasets, ODBMCLD performs better than other methods.
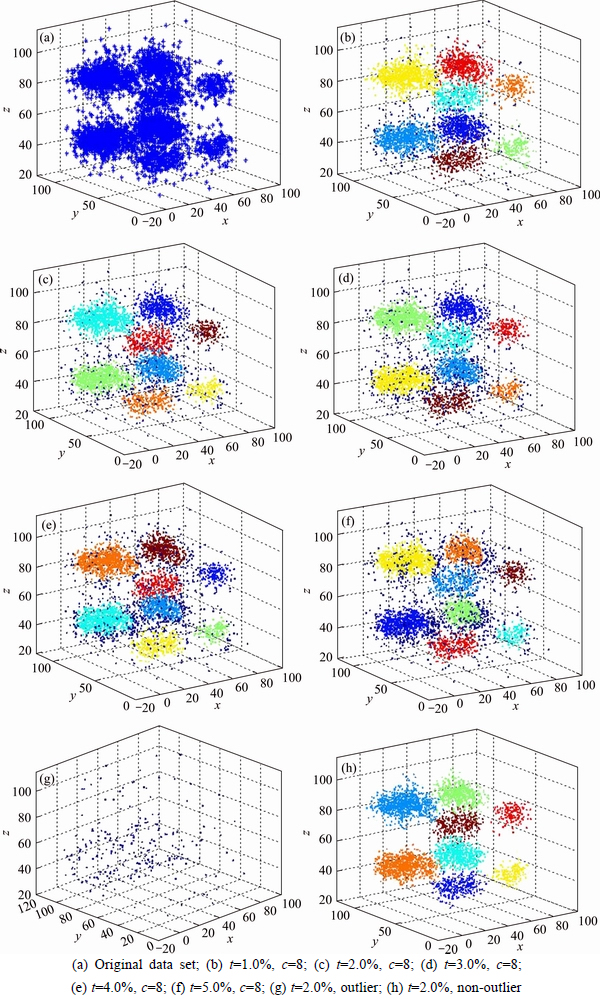
Fig. 4 Diagram of outlier detection in ODBMCLD:(8 kinds of color represent 8 different clusters, and the dark blue points are the candidates of outliers. Parameter c represents the number of clusters)
Table 2 Experimental data sets
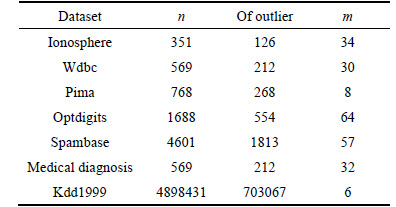
Table 3 Detection rate of K-means, DBSCAN, LOF, ODBMCLD
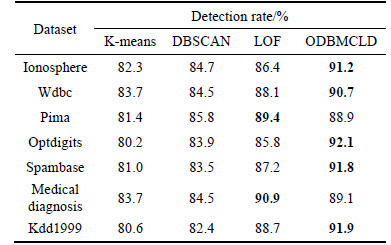
Table 4 Accuracy of K-means, DBSCAN, LOF, ODBMCLD
The performance of K-means is limited to the scale of dataset, so it is the same with the outlier detection methods of DBSCAN. What��s more, K-means needs to know the number of clusters before outlier detection, and DBSCAN has to decide the value of parameters Eps and MinPts in advance, where Eps represents the radius of a neighborhood for a point in dataset, MinPts is a threshold for the number of points in this neighborhood. Once the parameters are not determined properly, the robustness will be very weak. All of these lead to the high detection rate and accuracy of ODBMCLD compared with the other methods (K-means, DBSCAN and LOF).
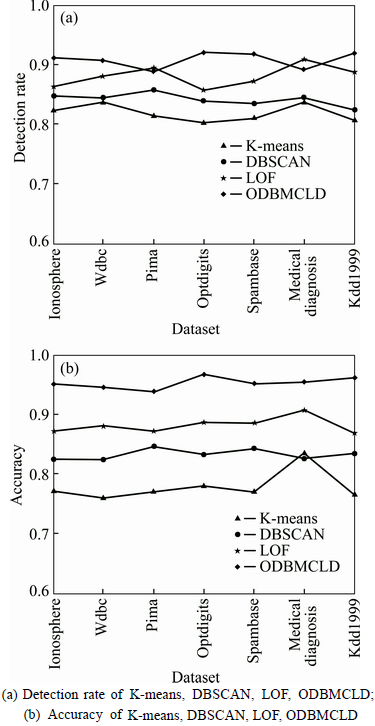
Fig. 5 Line charts about results of detection rate and accuracy of different approaches to different datasets:
Experimental results on synthetic and real datasets show that the proposed approach (ODBMCLD) outperforms other existing approaches, due to the consideration with both local density and clustering dissimilarity in the stage of choosing candidate outliers and deciding the cluster to which every object belongs; however, LOF only considers the local density, that��s why ODBMCLD has better effectiveness than other three existing methods.
6 Conclusions
Nowadays, discovery of anomaly has wide applications in real world. A novel outlier detection algorithm based on local density and multidimensional clustering is proposed. The method has three significant advantages. First, it does not require any priori knowledge, such as the scale of the dataset, the number of clusters that the dataset should be divided into. It can find the clustering center points with the peak value of density, and it is a kind of unsupervised learning method. Second, it needs fewer parameters. There are two specified parameters needed in the commonly used method DBSCAN, and K-means needs to know the number of clusters. While in ODBMCLD, only k-distance is needed, and it has better adaptability. Third, it doesn��t need to judge the deviation degree of every point and only the edge points of different clusters and the TOP N points with the highest outlier factors are considered, which cuts down the cost of time. The experimental results show that the outlier detection method based on density and multiple attributes clustering achieves good performance. Although the algorithm shows its effectiveness, there are still some problems needed further study, such as the adaptive parameter k-distance, which will be addressed in our future work.
References
[1] KAUR H, SINGH G, MINHAS J. A review of machine learning based anomaly detection techniques [J]. International Journal of Computer Applications Technology and Research, 2013, 2(2): 185-187.
[2] SINGH K, UPADHYAYA D S. Outlier detection: Applications and techniques [J]. International Journal of Computer Science Issues, 2012, 9(1): 307-323.
[3] YE H, KITAGAWA H, XIAO J. Continuous angle-based outlier detection on high-dimensional data streams [C]// Proceedings of the 19th International Database Engineering & Applications Symposium. Yokohama, Japan, 2015: 162-167.
[4] PANDA M, PATRA M R. A novel classification via clustering method for anomaly based network intrusion detection system [J]. International Journal of Recent Trends in Engineering, 2009, 2(1): 211-232.
[5] SHUCHITA D, SINGH K. Classification based outlier detection techniques [J]. International Journal of Computer Trends and Technology, 2012, 3(2): 294-298.
[6] KURIAN M J, GLADSTON R S. An analysis on the performance of a classification based outlier detection system using feature selection [J]. International Journal of Computer Applications, 2015, 132(8): 15-21.
[7] SUGIYAMA M, BORGWARDT K M. Rapid distance-based outlier detection via sampling [C]// Proceedings of the 26th International Conference on Neural Information Processing Systems. Lake Tahoe, Nevada, 2013: 467-475.
[8] CAMPELLO R J G B, MOULAVI D, SANDER A J. Hierarchical density estimates for data clustering, visualization, and outlier detection [J]. ACM Transactions on Knowledge Discovery from Data (TKDD), 2015, 10(1): 1-5.
[9] GOSAVI J S, WADNE V S. Unsupervised distance-based outlier detection using nearest neighbours algorithm on distributed approach: Survey [J]. International Journal of Innovative Research in Computer and Communication Engineering, 2014, 2(12): 7510-7514.
[10] PAVANI D, RAJENDRAPRASAD K. The competent reverse nearest neighbors for outlier detection in high dimensional data [J]. International Journal of Computer Science and Technology, 2016, 7(1): 70-73.
[11] UPADHYAYA D S, SINGH K. Nearest neighbour based outlier detection techniques [J]. International Journal of Computer Trends and Technology, 2012, 31(2): 299-303.
[12] WANG Wei, ZHANG Bao-ju, WANG Dan, JIANG Yu, QIN Shan, XUE Lei. Anomaly detection based on probability density function with Kullback�CLeibler divergence [J]. Signal Processing, 2016, 126: 12-17.
[13] BHATT V, DHAKAR M, CHAURASIA B K. Filtered clustering based on local outlier factor in data mining [J]. International Journal of Database Theory and Application, 2016, 9(5): 275-282.
[14] BAI M, WANG X T, XIN J C, WANG G. An efficient algorithm for distributed density-based outlier detection on big data [J]. Neurocomputing, 2016, 181(C): 19-28.
[15] MENG Jiang-liang, SHANG Hai-kun, BIAN Ling. The application on intrusion detection based on k-means cluster algorithm [C]// International Forum on Information Technology and Applications. Chengdu: IEEE, 2009: 150-152.
[16] LEE M H, WEI H, LEE S H, LEE S M, SHIN S S. Design of similarity measure for discrete data and application to multi-dimension [J]. Journal of Central South University, 2013, 20(4): 982-987.
[17] RANJAN R, SAHOO G. A new clustering approach for anomaly intrusion detection [J]. International Journal of Data Mining & Knowledge Management Process, 2014, 4(2): 29-38.
[18] ESTER M, KRIEGEL H, SANDER J, XU X. A density-based algorithm for discovering clusters in large spatial databases with noise [C]// Proceedings of the Second International Conference on Knowledge Discovery and Data Mining. Portland, 1996: 226-231.
[19] LU Zhi- mao, LIU Chen, ZHANG Chun- xiang, WANG Lei. Clustering method based on data division and partition [J]. Journal of Central South University, 2014, 21(1): 213-222.
[20] DENG Ze, HU Yang-yang, ZHU Mao, HUANG Xiao-hui, DU Bo. A scalable and fast OPTICS for clustering trajectory big data [J]. Cluster Computing, 2015, 18(2): 549-562.
(Edited by YANG Hua)
Cite this article as: SHOU Zhao-yu, LI Meng-ya, LI Si-min. Outlier detection based on multi-dimensional clustering and local density [J]. Journal of Central South University, 2017, 24(6): 1299-1306. DOI: 10.1007/s11771-017-3535-4.
Received date: 2016-10-10; Accepted date: 2017-03-20
Corresponding author: LI Meng-ya, Master; Tel: +86-18577347583; E mail: limengya8080@126.com

