Self tempering effect of near eutectic Al-Si casting with different wall thickness solidified and cooled in permanent die
��Դ�ڿ����й���ɫ����ѧ��(Ӣ�İ�)2011���12��
�������ߣ�����ƽ л�� �ž�
����ҳ�룺2576 - 2583
�ؼ��ʣ����ࣻ����Ͻ����˻�ЧӦ������Ӳ��
Key words���� phase; Al-Si alloy; self tempering effect; Brinell hardness
ժ Ҫ��
Ϊ�˽�ʾ��ȴ�ٶȶ�����Ͻ��Ц���Ĵ�С���ֲ���Ӱ�죬�о������̹����е����˻�ЧӦ�������һ��ʵ��װ�ò�����ʵ�顣������Ͻ������IJ�ͬ�ں�λ�еĦ������������о����о����֣�������ijߴ�ֲ����϶�����̬�ֲ���Ϊ���о���ͬ�ں��Լ���ͬ��ȴ�����µ����ܣ��������˲���Ӳ��ʵ�顣ʵ�������������ˮ����ȴʱ��Ӳ�ȱ��ڿ�������ȴʱ�����ȣ�������ƽ��Ӳ�ȸ��ߡ�
Abstract:
In order to study the self tempering effect on the solidification of Al-Si alloy, a setup was designed to conduct experiments. The characters of �� phases in different thicknesses of Al-Si samples were investigated. The results show that the size distributions of �� phases obey the logarithmic normal distribution. The Brinell hardness tests were also carried out. The tested hardness results show that the hardness distribution of the casting cooled in water is evener than that cooled in air, and its averaged value is higher than that cooled in air.

HU Xin-ping1, 2, XIE Ling1, 2, ZHANG Juan1, 2
1. School of Mechanical Engineering, Shandong Polytechnic University, Ji��nan 250353, China;
2. Shandong Provincial Key Laboratory of Advanced Machine-making of Light Industry and Monitoring Technology, Ji��nan 250353, China
Received 6 December 2010; accepted 4 May 2011
Abstract: In order to study the self tempering effect on the solidification of Al-Si alloy, a setup was designed to conduct experiments. The characters of �� phases in different thicknesses of Al-Si samples were investigated. The results show that the size distributions of �� phases obey the logarithmic normal distribution. The Brinell hardness tests were also carried out. The tested hardness results show that the hardness distribution of the casting cooled in water is evener than that cooled in air, and its averaged value is higher than that cooled in air.
Key words: �� phase; Al-Si alloy; self tempering effect; Brinell hardness
1 Introduction
Al-Si alloy is the most widely used aluminum alloy [1-2] in the manufacturing of the engine parts of cars and aero spaces because of its high ratio of strength to mass [3-5]. For some sections of these parts, there always exist wall thickness differences. In some sections this difference may be very large, and some cracks will be induced easily. For interior micro-cracks, if being unnoticed, the aftereffects induced would be catastrophic [6]. Many researchers owed this failure to the defects such as shrinkage and pores in the course of solidification [7-9]. In the course of serving, the parts undergwent periodic stretching stress, and then they cracked or fractured because of fatigue. We also admit they are very important reasons that cause the part failure, but there also exists another important reason that causes the failure. The microstructure and mechanical properties in some sections are different from the nearby sections that are caused by self tempering effect. In order to investigate this effect for Al-Si alloy solidified in copper-made die, we designed samples to experiment, and tried to make some supplements to the traditional theory of Al-Si alloy solidification.
2 Self tempering effect
When doing thermal analyses on Al-Si alloy in permanent die casting, we found that there exists an interesting phenomenon in the course of solidification. In the center section of thin wall and the skin section of casting, the temperature drops to a low temperature whose value is Tm first, then ascends contrarily to Tn, then drops again, as shown in Fig. 1 in solid line. But in the thick section of casting, the temperature drops continuously, as also shown in Fig. 1 in dashed line. The phenomenon that the temperatures of the thin and skin sections first drop then ascend, and then drop, and the change like the solid line in Fig. 1 is called self tempering. The duration of the temperature changing from Tm to Tn is short, and for a casting whose wall thickness changes from 20 mm to 3 mm, the duration may be 5-10 s. Overall, the mechanical properties in the skin are superior to those of the other section because finer dendrite crystalloids are formed for the reason of chill effect and there is a strengthening effect of the self tempering. When this self tempering occurrs in the whole section of the wall, there exist sections whose microstructure and mechanical properties are different from each other. And under periodic stretching stress, the crack would be caused in the weak section, especially in transitional section.
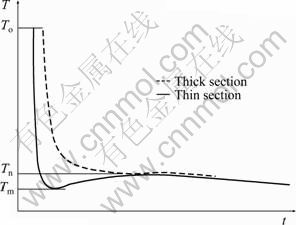
Fig. 1 Schematic of self tempering effect of casting with thin wall thickness solidified in permanent die
3 FEM temperature analyses
Temperature distribution and cooling rate in the course of solidification and cooling have important influences on the microstructure and mechanical properties of a casting. In order to analyze the temperature distribution of a casting with different wall thickness, a model shown in Fig. 2 was built. In Fig. 2(a), the models consisting of two kinds of materials were shown with grids. The inner zone was Al-Si casting, and the outer zone was copper-made permanent die. The wall thickness of casting changed from 20 mm to 2 mm gradually, the height of the casting here was 30 mm, and the dimensions of the die are shown in Fig. 2(b). In the model shown in Fig. 2(a), there were total 950 nodes, in which 258 nodes belonged to Al-Si casting, and the other 692 to permanent die. In Fig. 2(a), three nodes marked A, B and C behaved in three different zones with different wall thickness values respectively. Node A behaved on the thick wall zone and its node number was 101, node C the thin wall zone and its node number was 171, and node B the transitional zone and its node number was 224. The reason why nodes A, B, C were chosen in the center of the casting was to avoid the chill effect. The FEM analyses were carried out by the ANSYS software. In the FEM analyses, the parameters of material and thermal conditions are shown in Table 1.
The environmental condition was supposed that the temperature of air outside the permanent die was 20 ��C, and the coefficient of heat transferring was 3 W/(m2��K-1). The element PLANE55 was adopted to analyzing the temperature change in the course of solidification and cooling of Al-Si alloy casting.
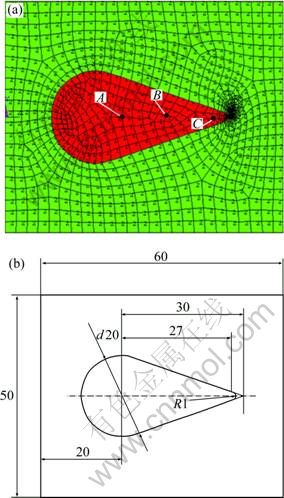
Fig. 2 Diagram of FEM temperature analyses modeling with meshing grid: (a) Analysis modeling with meshing grid; (b) Modeling with dimensions (mm)
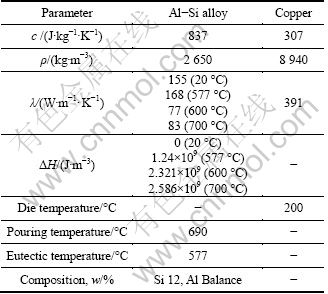
Table 1 Parameters of material and thermal conditions
For nodes A, B and C, the temperature changes are shown in Fig. 3. In order to obtain the temperature graph in detail, three figures with time durations of 5, 17, and 600 s after liquid Al-Si alloy was poured into the die respectively were plotted here. In Figs. 3(a) and (b), there exists a platform in the temperature graph because of the emitting of latent heat of solidification for nodes A and B. But for node C, the latent heat was too small to display a platform in the temperature graph. It could be seen in Fig. 3(c) that the temperature of node C dropped fast, and then ascended contrarily, then dropped slowly. In the case studied here, the lowest temperature was about 295 ��C, and then the temperature ascended for a period rather than dropped continuously, so this stage was called self tempering. And the influences on the properties of casting are called self tempering effect.
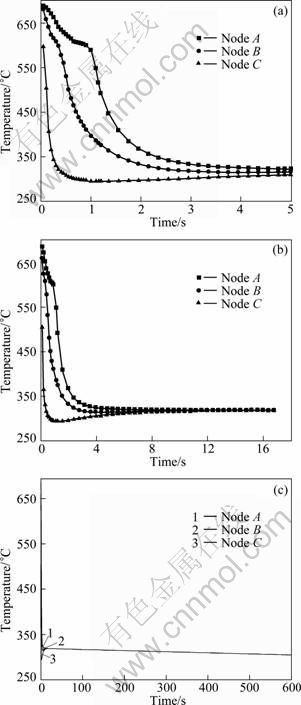
Fig. 3 Temperature changes in different positions cooled in copper-made die: (a) Poured within 5 s; (b) Poured within 17 s; (c) Poured within 600 s
When the dry sand mould rather than copper die was adopted, the temperature changes of the same position of the Al-Si casting in the same modeling are shown in Fig. 4. The parameter of Al-Si alloy adopted was the same as analyses above, and the parameters of the sand mould were: density 1580 kg/m3, specific heat capacity 1130 J/(kg��K), coefficient of thermal conductivity 0.61 W/(m��K).
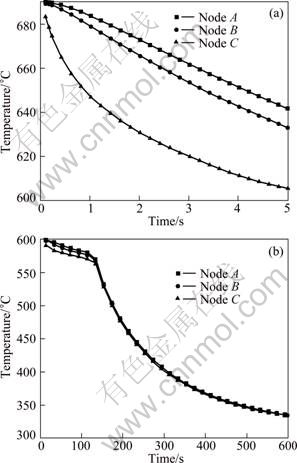
Fig. 4 Temperature changes in different positions cooled in dry sand mould: (a) Poured within 5 s; (b) Poured within 600 s
In the case of dry sand mould, the temperature graphs were plotted with durations of 5 and 600 s after liquid Al-Si alloy was poured into the mould. In Fig. 4(a), platform and self tempering effect did not appear. For all the temperature graphs of nodes A, B and C, the temperature dropped continuously.
From the above analyses, it could be easy to conclude that casting solidified in copper die could possess self tempering effect because of the high cooling rate. And in the thin or skin section, the self tempering effect is more obvious than that in the thick section.
4 Experimental
In order to study the self tempering effect on the microstructure and mechanical properties, a setup shown in Fig. 5 was designed and manufactured. The copper- made die is shown in Fig. 5(a), and its dimensions are shown in Fig. 2(b). The Al-Si casting is shown in Fig. 5(b). In order to avoid the chill effect on the alloy microstructure, the casting was cut in the middle of the height direction (Fig. 5(b), shadow lines). Then, the low part was selected and samples in proper sizes were cut from it. The samples are shown in Fig. 5(c), labeled by A, B and C, respectively, from left to right. These labeled planes were also the planes on which the microstructures were observed and hardness was tested.
The nominal Al-12%Si alloy was melted in a resistance furnace with graphite crucible at the temperature 750 ��C, and the pouring temperature was 690 ��C. Before pouring, the copper die was warmed up to 200 ��C. Two groups of castings were produced, one group was cooled in the open air with temperature of 20 ��C, and the other was cooled in water with temperature of 20 ��C.
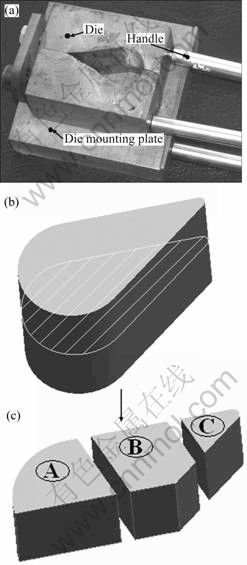
Fig. 5 Schematic of experimental setup and casting and samples to be tested: (a) Copper die; (b) Al-Si alloy casting; (c) Samples cut from casting
The metallographs were taken by HXD- 1000TMJC/LCD micro hardness tester with image taking and analysis system. When the samples were observed and metallographs were taken, the observed points might be near to the central zone of the samples. 5% NaOH (mass fraction) liquor was chosen as erodent. The metallographs of the samples A, B, C in each groups are shown in Fig. 6 and Fig. 7, respectively.
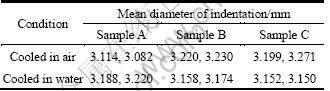
The Brinell hardness was tested with HBE-3000A hardness tester. The ball diameter was 5 mm, the test force was 2.452 kN, and the duration of test force was 10 s. Each sample was tested twice, and the test points might be near to the central zone of the samples. The mean diameters of indentation tested every time were recorded which are listed in Table 2.
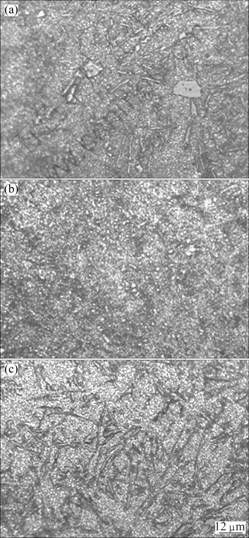
Fig. 6 Metallographs of samples cooled in air: (a) Sample A; (b) Sample B; (c) Sample C
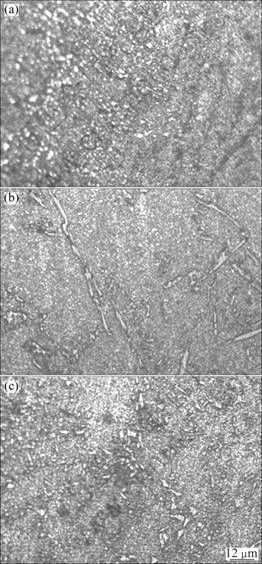
Fig. 7 Metallographs of samples cooled in water: (a) Sample A; (b) Sample B; (c) Sample C
Table 2 Mean diameter of indentation
5 Results and discussion
Al-Si binary phase diagram is simple and there are only two solid solutions. It is easy to determine the phase in metallographs. From Fig. 6 and Fig. 7, the bright granules and needle like phases are primary Si phases and �� solid solution, and the grey matrix �� solid solution [10-11]. With the image processing function of the IPP software, the size of �� phases and their distributions could be obtained [12-13].
The size of �� phases and their distributions in Fig. 6 and Fig. 7 are shown in Fig. 8 and Fig. 9, respectively. Here, the average diameter was chosen to characterize the �� phase size. And in convenience, the unit was pixel and 1 pixel was equal to 0.189 ��m here. It is obvious that the size of the �� phases obeys the logarithmic normal distribution. The equation of the logarithmic normal distribution was fitted as Eq. (1), and the parameters such as y0, A, u and �� in each case are concluded in Table 3.
![]() (1)
(1)
where A is constant; y is percentage occupied by a size of �� phase; y0 is the maximum percentage occupied by a size of �� phase; x is the size of �� phase; �� is average value; �� is standard deviation of the size of �� phase.
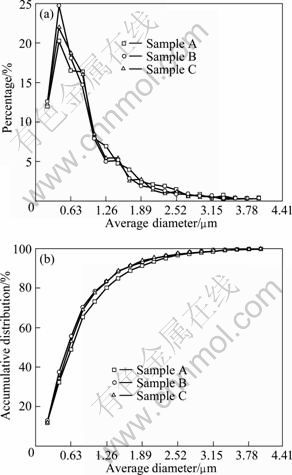
Fig. 8 �� phases and their distribution in Al-12%Si casting cooled in air: (a) Single size distribution; (b) Accumulative size distribution
For Sample B, in Fig. 8(a), the granule with size of 0.756 ��m occupied 24.7%, but in Fig. 9(a), it occupied 26%. And for Samples A and C cooled in water, the granule with size of about 0.756 ��m occupied about 2%, more than that cooled in air. And the granule with size below 1.89 ��m in Fig. 8(b) was 94.6% when being cooled in air, about 1.5%, lower than that cooled in water (96.1%). In Table 3, the values of u in column ��In air�� were larger than those in column ��In water�� for Samples A and B. So, it could be concluded that the granule size of casting cooled in water was smaller than that cooled in air. For Sample C, the value of u in column ��In air�� was smaller than that in column ��In water��. It was caused by the chill effect because the wall thickness of casting was thin near the points observed. And near the chill zone of casting, whether being cooled in water or in air, the size of alloy granule was not influenced. The total average diameter (![]() ) of the counted granules could also be obtained, and it is shown in the last row in Table 3. From the results, it could be seen that the minimum of
) of the counted granules could also be obtained, and it is shown in the last row in Table 3. From the results, it could be seen that the minimum of ![]()
was in transitional section (Sample B) when being cooled in water.
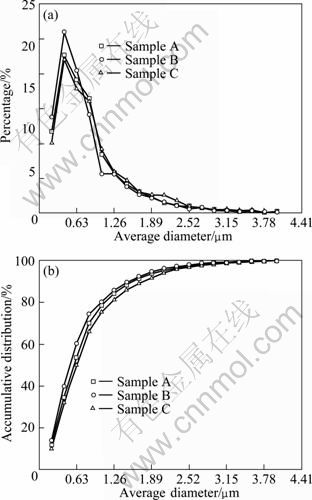
Fig. 9 �� phases and their distribution in Al-12%Si casting cooled in water: (a) Single size distribution; (b) Accumulative size distribution
It could be concluded that the granules in the transitional section, because of the self tempering effect, were the finest. And this agrees with the result of the metallographs: neglecting the big flake and thick needle like �� phases, the granules in Fig. 6(b) and in Fig. 7(b) were the finest, respectively.
There existed structural and compositional fluctuation, thermodynamically stable phases in liquid Al-Si alloy. This means that the liquid structure is not homogeneous but consists of a mixture of several different structures [14]. When being solidified fast, the size distributions reveal this fluctuation. When cooling, there is diffusion, and the morphology of �� phases changes depending on the temperature, composition, pressure, cooling rate, etc. The growth of �� phase was controlled by volume diffusion and the velocity �� can be expressed by
![]() (2)
(2)
where KI and K are constants; Q is the activation energy of diffusion; ��G is the difference of free energy between the matrix alloy and �� phase; T is the thermodynamic temperature [15]. From thick section to thin section of the casting studied, the cooling rate would be from slow to fast, and the size of �� phase would be from large to small without the self tempering effect like that solidified and cooled in dry sand mould. However, this effect changed the thermodynamic condition in solidification and cooling process, and also the microstructure of the casting was changed accordingly.
There are some relationship between the hardness and the strength for the Al-Si alloy. And the Brinell hardness is the main item to scale the mechanical properties of the non ferrous alloy. The values of Brinell hardness could be calculated according to the diameters of indentation in the hardness test and they are shown in Table 4.
![]() (3)
(3)
where F is the test force; D is the diameter of hardmetal ball; and d is the diameter of indentation of the ball.
Table 3 Parameters of Eq. (1) and total average diameter
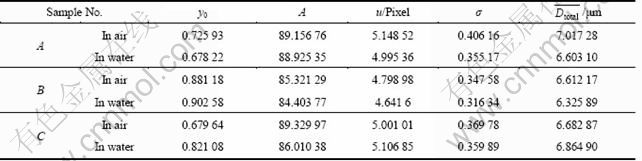
Table 4 Brinell hardness calculated of Al-Si alloy
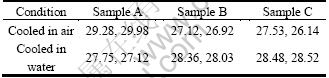
The studied alloy comprised aluminum with purity of 99.70% and silicon with purity of 99.47%, so the hardness is lower than that without other elements. In order to improve the wear resistance and strength, some alloying elements such as Mg, Cu, Fe should be added [16-18].
The hardness distribution of the casting cooled in water is evener than that cooled in air, and the values of hardness when being cooled in water are higher than those cooled in air to some extent. This is caused by the quicker cooling rate of the casting. When being cooled in air, the heat is dissipated slowly. So, the cooling rate depends on the wall thickness of casting. There will exist self tempering effect, and the value of hardness in the transitional section will be smaller than that in the adjoining section.
6 Conclusions
1) For the Al-Si alloy casting with different wall thickness solidified and cooled in copper die in air, there is self tempering effect in the transitional section of the casting. The microstructure and mechanical properties change with different sections.
2) The granules size distributions obey the logarithmic normal distribution with the equation of
![]() . The parameters such
. The parameters such
as y0, A, u and �� can be determined in each sample studied. The values of u shows that the granule size of casting cooled in water is smaller than that cooled in air. The granule size is the smallest in the wall thickness transitional section.
3) Tests of Brinell hardness show that the hardness distribution of the casting cooled in water is evener than that cooled in air, and the values of hardness of casting cooled in water are higher than those cooled in air.
References
[1] ZHANG L Y, JIANG Y H, MA Z, SHAN S F, JIA Y Z, FAN C Z, WANG W K. Effect of cooling rate on solidified microstructure and mechanical properties of aluminium��A356 alloy [J]. Journal of Materials Processing Technology, 2008, 207: 107-111.
[2] HU X P, ZHAO G Q, WANG W M. Solidifying pressure and microstructure of AlSi10Cu3 in die sleeve in high pressure die casting [J]. International Journal of Cast Metal Research, 2010, 23: 289-295.
[3] GROSSELLE F, TIMELLI G, BONOLLO F. Doe applied to microstructural and mechanical properties of Al�CSi�CCu�CMg casting alloys for automotive applications [J]. Materials Science and Engineering A, 2010, 527: 3536-3545.
[4] BASAVAKUMAR K G, MUKUNDA P G, CHAKRABORTY M. Influence of grain refinement and modification on microstructure and mechanical properties of Al�C7Si and Al�C7Si�C2.5Cu cast alloys [J]. Materials Characterization, 2008, 59: 283�C289.
[5] KAPRANOS P, KIRKWOOD D H, ATKINSON H V, RHEINLANDER J T, BENTZEN J J, TOFT P T, DEBEL C P, LASLAZ G, MAENNER L, BLAIS S, IBABE J M R, LASA L, GIORDANO P, CHIARMETTA G, GIESE A. Thixoforming of an automotive part in A390 hypereutectic Al�CSi alloy [J]. Journal of Materials Processing Technology, 2003, 135: 271�C277.
[6] SHANIAVSKIY A A, TOUSHENTSOV A L. Mechanisms of fatigue crack initiation and propagation in cast aluminum alloy AL5 of hydropumps NP-89D in aircraft Tu-154M [J]. Engineering Failure Analysis, 2010, 17: 658�C663.
[7] LADOS D A, APELIAN D, WANG L. Minimization of residual stress in heat-treated Al�CSi�CMg cast alloys using uphill quenching: Mechanisms and effects on static and dynamic properties [J]. Materials Science and Engineering A, 2010, 527: 3159�C3165.
[8] MORADI M, NILI-AHMADABADI M, HEIDARIAN B, ASHOURI S. Defect control and mechanical properties of thixoformed Al�CSi alloy [J]. Journal of Alloys and Compounds, 2009, 487: 768-775.
[9] HAN S W, KUMAI S, SATO K. Fatigue crack growth behavior in semi-liquid die-cast Al-7%Si-0.4%Mg alloys with fine effective grain structure [J]. Materials Science and Engineering A, 2001, 308: 225�C232.
[10] DORUM C, LAUKLI H I, HOPPERSTAD O S, LANGSETH M. Structural behaviour of Al�CSi die-castings: Experiments and numerical simulations [J]. European Journal of Mechanics A/Solids, 2009, 28: 1�C13.
[11] LIU Zheng, MAO Wei-min, ZHAO Zhen-duo. Effect of local chilling on morphology of primary ��(Al) in semi-solid A356 alloy [J]. Transactions of Nonferrous Metals Society of China, 2008, 18: 573-579.
[12] ELMADAGLI M, PERRY T, ALPAS A T. A parametric study of the relationship between microstructure and wear resistance of Al�CSi alloys [J]. Wear, 2007, 262: 79-92.
[13] KALKA M, ADAMIEC J. Complex procedure for the quantitative description of an Al�CSi cast alloy microstructure [J]. Materials Characterization, 2006, 56: 373-378.
[14] WANG W M, BIAN X F, QIN J Y, SYLIUSARENKO S I. The atomic-structure changes in Al-16 pct Si alloy above the liquidus [J]. Metallurgical and Materials Transactions A, 2000, 31: 2163-2168.
[15] XIONG B Q, ZHANG Y A, WEI Q, SHI L K, XIE C A, SHANG C J, HE X L. The study of primary Si phase in spray forming hypereutectic Al�CSi alloy [J]. Journal of Materials Processing Technology, 2003, 137: 183�C186.
[16] WU C T, LEE S L, HSIEH M H, LIN J C. Effects of Cu content on microstructure and mechanical properties of Al�C14.5Si�C0.5Mg alloy [J]. Materials Characterization, 2010, 61: 1074-1079.
[17] BURAPA R, JANUDOM S, CHUCHEEP T, CANYOOK R, WANNASIN J. Effects of primary phase morphology on mechanical properties of Al-Si-Mg-Fe alloy in semi-solid slurry casting process [J]. Transactions of Nonferrous Metals Society of China, 2010, 20: s857-s861.
[18] FABIO G, GIULIO T, FRANCO B. Doe applied to microstructural and mechanical properties of Al-Si-Cu-Mg casting alloys for automotive applications [J]. Materials Science and Engineering A, 2010, 527: 3536-3545.
����ƽ1 ,2, л ��1, 2, �� ��1, 2
1. ɽ���ṤҵѧԺ ��е����ѧԺ������ 250353��
2. ɽ��ʡ�Ṥװ���Ƚ��������ؼ����ص�ʵ���ң����� 250353
ժ��Ҫ��Ϊ�˽�ʾ��ȴ�ٶȶ�����Ͻ��Ц���Ĵ�С���ֲ���Ӱ�죬�о������̹����е����˻�ЧӦ�������һ��ʵ��װ�ò�����ʵ�顣������Ͻ������IJ�ͬ�ں�λ�еĦ������������о����о����֣�������ijߴ�ֲ����϶�����̬�ֲ���Ϊ���о���ͬ�ں��Լ���ͬ��ȴ�����µ����ܣ��������˲���Ӳ��ʵ�顣ʵ�������������ˮ����ȴʱ��Ӳ�ȱ��ڿ�������ȴʱ�����ȣ�������ƽ��Ӳ�ȸ��ߡ�
�ؼ��ʣ����ࣻ����Ͻ����˻�ЧӦ������Ӳ��
(Edited by YANG Hua)
Foundation item: Project (J09LD11) supported by Higher Educational Science and Technology Program of Shandong Province, China; Project (BS2009ZZ010) supported by Shandong Province Outstanding Research Award Fund for Young Scientists, China
Corresponding author: HU Xin-ping; Tel: +86-13954153832; E-mail: huxxpp@163.com
DOI: 10.1016/S1003-6326(11)61094-7

