基于红外热像法的AZ31B镁合金电子束焊接接头的疲劳行为
来源期刊:中国有色金属学报(英文版)2016年第10期
论文作者:杨宏伟 崔泽琴 王文先 许并社 许海鹰
文章页码:2595 - 2602
关键词:镁合金;电子束焊接接头;疲劳行为;红外热像法
Key words:magnesium alloy; electron beam welded joint; fatigue behavior; infrared thermography
摘 要:采用红外热像法对循环载荷下AZ31B 镁合金电子束焊接接头的疲劳行为进行研究。对试件在疲劳试验中表面温度演变规律和产热机制进行分析,并在此基础上对其疲劳极限进行预测,同时通过分析试件表面温度和热点区域的演变规律对其疲劳损伤进行定量评估。结果表明:采用红外热像法不仅能够实现对镁合金电子束焊接接头疲劳极限的快速预测,而且可以对其疲劳损伤进行实时定量监测。镁合金电子束焊接接头疲劳极限预测结果同传统S-N 试验结果保持一致。试件表面温度以及热点区域演变可作为评价镁合金电子束焊接接头疲劳损伤的有效依据。
Abstract: Fatigue behavior of AZ31B magnesium alloy electron beam welded joint undergoing cyclic loading was investigated by infrared thermography. Temperature evolution throughout a fatigue process was presented and the mechanism of heat generation was discussed. Fatigue limit of the welded joint was predicted and the fatigue damage was also assessed based on the evolution of the temperature and hotspot zone on the specimen surface during fatigue tests. The presented results show that infrared thermography can not only quickly predict the fatigue behavior of the welded joint, but also qualitatively identify the evolution of fatigue damage in real time. It is found that the predicted fatigue limit agrees well with the conventional S-N experimental results. The evolution of the temperature and hotspot zone on the specimen surface can be an effective fatigue damage indicator for effective evaluation of magnesium alloy electron beam welded joint.
Trans. Nonferrous Met. Soc. China 26(2016) 2595-2602
Hong-wei YANG1, Ze-qin CUI1,2, Wen-xian WANG1,2, Bing-she XU1,2, Hai-ying XU3
1. College of Materials Science and Engineering, Taiyuan University of Technology, Taiyuan 030024, China;
2. Shanxi Key Laboratory of Advanced Magnesium-based Materials, Taiyuan 030024, China;
3. Beijing Aeronautical Manufacturing Technology Research Institute, Beijing 100024, China
Received 16 June 2015; accepted 15 August 2016
Abstract: Fatigue behavior of AZ31B magnesium alloy electron beam welded joint undergoing cyclic loading was investigated by infrared thermography. Temperature evolution throughout a fatigue process was presented and the mechanism of heat generation was discussed. Fatigue limit of the welded joint was predicted and the fatigue damage was also assessed based on the evolution of the temperature and hotspot zone on the specimen surface during fatigue tests. The presented results show that infrared thermography can not only quickly predict the fatigue behavior of the welded joint, but also qualitatively identify the evolution of fatigue damage in real time. It is found that the predicted fatigue limit agrees well with the conventional S-N experimental results. The evolution of the temperature and hotspot zone on the specimen surface can be an effective fatigue damage indicator for effective evaluation of magnesium alloy electron beam welded joint.
Key words: magnesium alloy; electron beam welded joint; fatigue behavior; infrared thermography
1 Introduction
Magnesium alloys are important future structural materials owing to their low density, high specific strength, environmental friendliness, and good machinability and recyclability [1]. They are potentially used as structural components in automotive and aerospace application [2]. And in practical applications such as aircrafts and automobiles, many components with welded joints would inevitably involve the dynamic loading in service [3]. However, it is well known that the weld seams are often the weakest sites of the structures [4]. Fatigue fracture often occurs in welded structures at a relatively low stress level due to the presence of possible crack-like defects along with high stress concentration effect and complex residual stresses and flaws caused by the thermal welding process itself [5]. Therefore, the study on fatigue behavior of the welded joints of magnesium alloy is of vital importance for their safety operation.
For the fatigue evaluation of welded structures, different approaches have been applied, such as the nominal stress approach, the hot spot stress (HSS) approach, and the local notch stress approach [6]. However, these approaches still meet some unavoidable limitations for fatigue strength assessment of complex welded joints in practical applications [7], besides their extremely time-consuming and costly disadvantages [8]. It is well documented that most of the dissipated strain energy during fatigue test is converted into heat, which manifests itself as heat and causes an increase in the temperature of the specimen [9]. Taking the initial thermal increment or the surface temperature evolution as the major indicator of fatigue, the thermographic method (TM) brings a great revolution to fatigue assessment of welded joints [10], which can overcome the above-mentioned problems. And the TM has been widely and successfully applied to assessing the fatigue behavior and the damage evolution of materials and their welded components [11].
With the development of high resolution infrared camera and the relevant theories, infrared thermography (IRT), as a non-destructive, real-time and non-contact technique was extensively used to evaluate fatigue parameters of materials and components [12]. RISITANO group [13,14] firstly proposed a method to fast determinate the fatigue limit and construct the S-N curve of materials. And CRUPI [15] adopted the Risitano method to rapidly determine the fatigue limit of structural steels with different welded joints, and good agreement was achieved between predicted values and traditional experimental results. Based on the theory of material’s dissipativity, LUONG [16,17] put forward a methodology to rapidly evaluate the fatigue limit of metals. This method was utilized to determine the fatigue limit of a mild steel Fe 510 [18], with an error lower than 10% compared with the traditional method for both standard and notched specimens. Besides, WILLIAMS and KHONSARI [19] successfully predicted the remaining fatigue life of welded joints based on the initial slope of the temperature rise Rθ in the fatigue test. Moreover, IRT has been used to monitor fatigue crack growth [20,21] and assess the fatigue crack growth behavior of materials through recording the temperature evolution around cyclic plastic zone [22,23]. UMMENHOFER and MEDGENBERG [24] used the IRT to analyze the damage progress of butt-welded steel structures and steel structures with t-stiffeners during fatigue testing. They found that the IRT provides a powerful experimental tool to identify and investigate localized inhomogeneous damage and to analyze complex fatigue processes. Meanwhile, the fatigue behavior of the AZ31B magnesium alloy [25,26] and the fatigue crack growth behavior of the AZ31B magnesium alloy electron beam welded joint [27] have been investigated by IRT in our previous researches.
In this work, IRT was used to research the fatigue behavior of AZ31B magnesium alloy electron beam welded joint. Fast prediction of the fatigue limit and fatigue damage evolution of the welded joint during fatigue tests based on IRT were investigated. A series of experimental measurements involving high-cycle fatigue were performed to verify the predicted results. This study was performed to provide the reliable theoretical basis and rational suggestion for the broader application of magnesium alloy welded joints in the structural industry. Besides, research results can further promote the application of IRT in the fatigue research.
2 Experimental
2.1 Materials
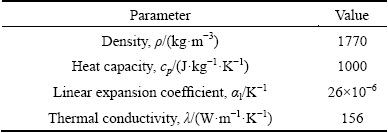
The material used in this work is hot-extruded AZ31B magnesium alloy with a thickness of 10 mm. The composition is listed in Table 1. The physical and thermal properties of AZ31B magnesium alloy are shown in Table 2.
Table 1 Chemical composition of AZ31B magnesium alloy (mass fraction, %)
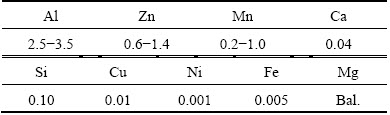
Table 2 Physical and thermal properties of AZ31B magnesium alloy
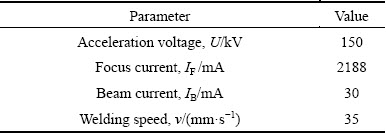
The plates with dimensions of 300 mm × 300 mm × 10 mm were welded by a ZD150-60C CV85M electron beam welder at a vacuum of 5×10² Pa. The welding direction is perpendicular to the extrusion direction of the Mg alloy sheets. The welding parameters are listed in Table 3. After welding, the joints were checked by XXQ-2005 portable X-ray detection apparatus with resolution of 0.4 mm to avoid the macrocracks.
Table 3 Electron beam welding parameters of butt joint
To avoid the influence of surface oxidation film and stress concentration on the tensile and fatigue properties, two sides of specimens were polished by using the silicon carbide paper grit from No. 600 to No. 2000 before mechanical testing. In order to observe the initial microstructure, the polished specimen surface was etched by Keller’s reagent with the following composition: 10 mL acetic acid, 4.2 g picric acid, 10 mL distilled water, and 70 mL ethanol (95%) for 15 s.
Figure 1 shows the microstructure of AZ31B magnesium alloy electron beam welded joint. As can be seen from Fig. 1(a), the shape of weld seemed as a “finger” and the depth-to-width ratio reached 8:1. And the HAZ is so narrow that is hardly to distinguish as shown in Fig. 1(c). Compared with base metal as shown in Fig. 1(d), the microstructure of fusion zone in Fig. 1(b) is fine and equiaxed, and the average grain sizes are approximately 6.0 μm. This can be accounted for high density of electron beam and high thermal conductivity of magnesium alloy itself, which caused that the grain growth was suppressed by rapid welding rate and cooling rate during the welding process.
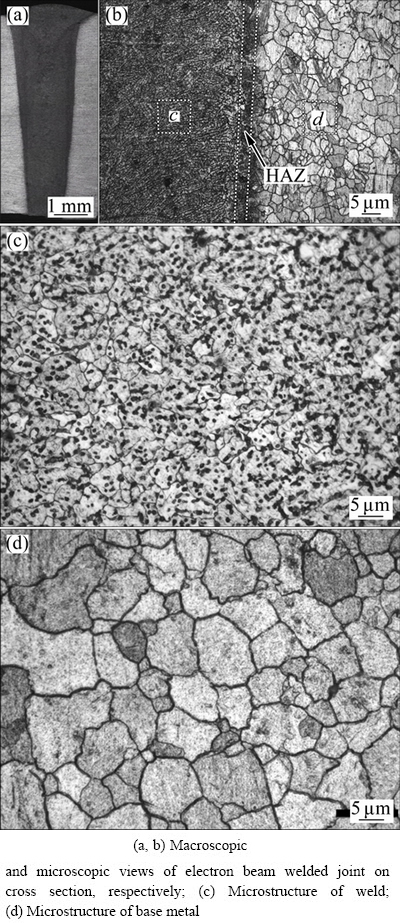
Fig. 1 Microstructures of AZ31B magnesium alloy electron beam welded joint including various zones
2.2 Experimental procedure
Figure 2 shows the dimensions of specimens used in tensile and fatigue tests. Tensile tests were performed using a DNS-100 universal testing machine. All the fatigue tests were conducted using a uniaxial PLG-200D high-frequency electromagnetic resonance load frame in ambient air. Fatigue tests were performed by applying a sinusoidal waveform with a load ratio (ratio of the minimum load to the maximum load in a loading cycle), R=0.1, and a frequency of 100 Hz. During all the tests, an infra camera (Tech VarioCAM hr) was used to record the temperature field evolution on specimen surface. Optical field-of-view conditions were achieved by installing the infra camera at a distance of approximately 50 cm between specimens and the lens of the camera. The main technical characteristics of this camera are as follows: with resolution of 320×240 focal plane array or 384×288 pixel, sensitivity/NETD of 0.08 K at 300 K and sampling frequency of 50 Hz. To increase the surface emissivity properties, the specimen surface was painted in black (matt paint) after polishing. And thermographic data were dealt with an IRBIS 3 software.
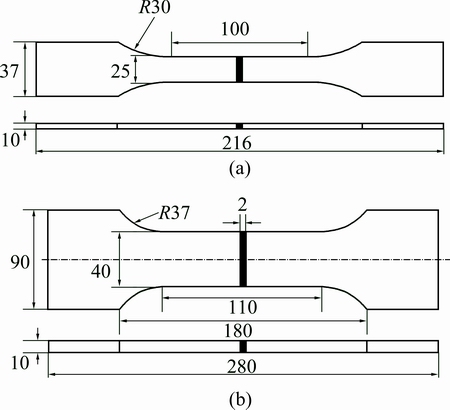
Fig. 2 Sample shapes and dimensions for tensile tests (a) and fatigue tests (b) (unit: mm)
3 Results and discussion
3.1 Tensile tests
Figure 3 exhibits the tensile curves and superficial temperature evolutions of AZ31B magnesium alloy electron beam welded joint and base metal during tensile process, respectively. Temperature evolutions in the welded joint and base metal uniformly undergo four stages: linear temperature decrease stage I, step temperature increase stage II, abrupt temperature increase stage III, and final drop after failure stage IV, as shown in Fig. 3.
In stage I, temperature presented significantly decline tendency which can be attributed to the thermoelastic effect [28]. From point B, temperature variation slope transformed into positive, corresponding to the inversion at point B′ in the tensile curve, indicates the transition from elastic deformation stage to plastic deformation stage. Meanwhile, the superficial temperature of specimens gradually rises due to the thermoplastic effect [29]. Along with increasing of the loading sequentially, the fractures happened at point D, as shown in Fig. 3. At last, the temperature gradually dropped down. Besides, we could conclude that different fracture modes were presented between the welded joint and base metal from the view of the thermographic graphs. Typical ductile fracture (45° shear fracture) was demonstrated in base metal while the weld showed relatively flat fracture morphology. And obvious stress concentration effect was found in the weld toe from the thermographic graph of the weld, which led to fracture on the weld toe [30].
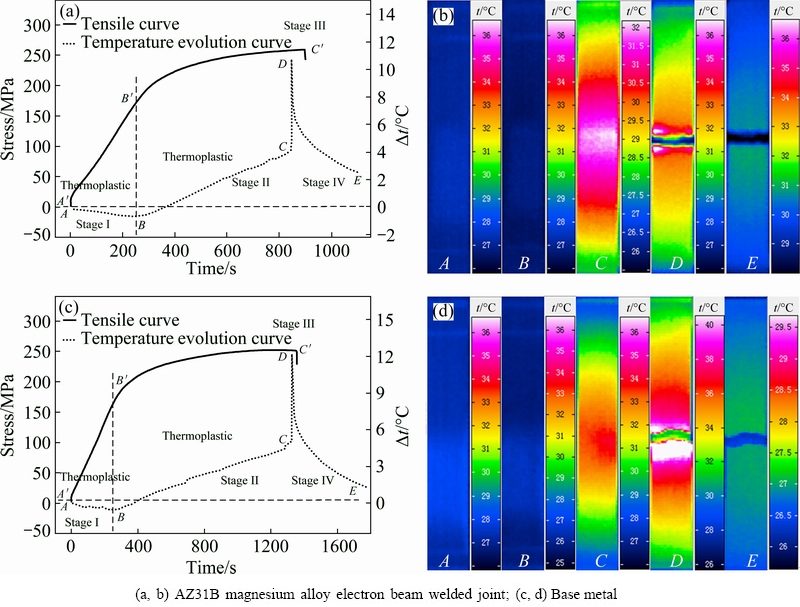
Fig. 3 Temperature evolutions and tensile curves in tensile process
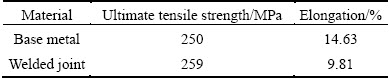
As shown in Fig. 3, non-apparent yield phenomenon appeared in the tensile processes of AZ31B magnesium alloy electron beam welded joint and base metal. The mechanical properties of AZ31B magnesium alloy electron beam welded joint and base metal are listed in Table 4. As can be seen in Table 4, electron beam welded joint exhibits a little higher tensile strength than base metal. This can be explained by the Hall-Petch relationship: σm=σ0+kd-1/2, where σm is the yield strength of the material, σ0 and k are constants related to the material, and d is the average grain size. After the electron beam welding, the grain was obviously refined, as shown in Fig. 1. And the HAZ was so narrow that can be neglected [31], so superior mechanical property was exhibited for the welded joint.
Table 4 Mechanical properties of AZ31B magnesium alloy electron beam welded joint and base metal
3.2 Temperature evolution analysis in fatigue tests
Figure 4 shows the S-N curves of AZ31B magnesium alloy electron beam welded joint and base metal. Fatigue strength of AZ31B magnesium alloy electron beam welded joint at 2×10⁶ cycles is 89 MPa and that of base metal at 1×10⁷ cycles is 107 MPa. Fatigue strength of AZ31B magnesium alloy electron beam welded joints is 83.2% that of base metal. Compared with TIG (tungsten inert gas welding) [32], electron beam welding can significantly improve the fatigue strength of magnesium alloy welded joints. This would be due to the smaller grain size developed by electron beam welding. Meanwhile, the effect of grain size on the fatigue strength can be expressed properly by Hall-Petch relationship for AZ31B magnesium alloy [33], which explained that grain refinement can enhance crack initiation and crack growth resistance.
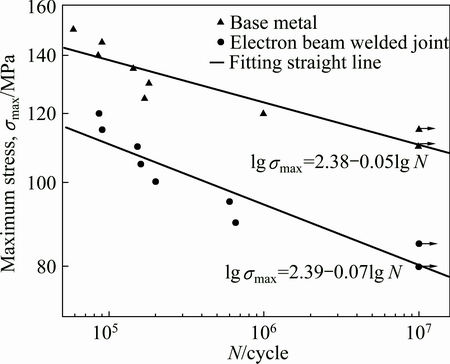
Fig. 4 S-N curves of AZ31B magnesium alloy electron beam welded joints and base metal
Figure 5 shows the superficial temperature evolution of AZ31B magnesium alloy electron beam welded joints in different stress ranges measured during fatigue tests. Dt is the maximum temperature increment, which is calculated as Dt=t-t0 (where t is the highest superficial temperature value of specimen, t0 is room temperature). Note that when the cyclic loading is greater than fatigue limit of AZ31B magnesium alloy electron beam welded joint, the consistent temperature evolution tendency is shown in all specimens compared with that of base metal in our previous research (Fig. 3) [25]. As is shown in Fig. 6, which is the typical temperature evolution for AZ31B magnesium alloy electron beam welded joint under 110 MPa, the temperature evolution uniformly undergoes five stages: initial temperature increase stage I, temperature decrease stage II, temperature equilibrium stage III, abrupt temperature increase stage IV, and final drop stage V.
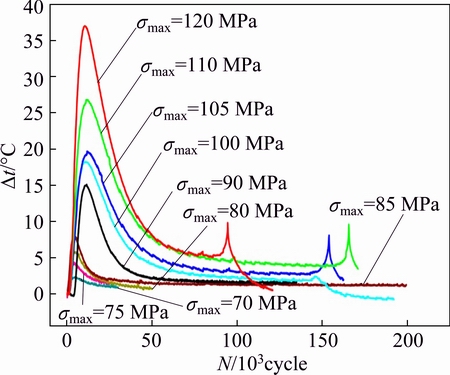
Fig. 5 Temperature evolution of AZ31B magnesium alloy electron beam welded joint measured during fatigue tests under different stress ranges
In stage I, superficial temperature is presented to rapidly increase at the beginning of the test since the energy density associated with hysteresis effect gives rise to heat generation at a greater rate than heat loss from the specimen by conduction, convection and radiation. Along with the rapid increase of temperature, large cyclic hardening effect appears inside the specimen and reaches maximum at point B [25]. And this phenomenon reflecting in the change of tensile strength during the fatigue test has been successfully utilized to determine the fatigue damage variation of materials [34].
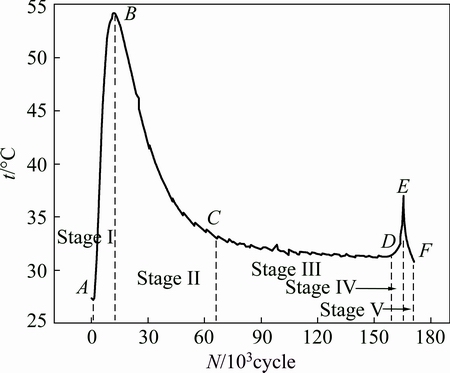
Fig. 6 Temperature evolution of AZ31B magnesium alloy electron beam welded joint measured during fatigue test under 110 MPa
In stage II, little inelastic deformation occurring inside the specimen and heat transfer is in dominant status. Besides, considering the large thermal conductivity, λ, of magnesium alloy, which is above 10 W/(m・K) [35], heat is mainly transferred by conduction in this test. And this stage is a distinctive temperature evolution for magnesium alloy and its welded joint subjected to cyclic loading compared with the steels and the aluminium alloys which have body-centered cubic crystal and face-centered cubic crystal structure, respectively [36]. This can be possibly attributed to the less slip systems of HCP (hexagonal close-packed) crystal structure for magnesium alloy.
In stage III, energy generation balances the energy dissipation, and the temperature almost reaches a constant value. After a certain number of cycles, there is a sharp increase of temperature before the final failure in stage IV, which indicated that the macrocrack was initiated in the specimen and propagated forward. Therefore, this information can be utilized to terminate the operation of magnesium alloy welded structures to prevent the catastrophic failure.
In stage V, the temperature gradually decreases to room temperature after the test stops.
3.3 Fatigue behavior based on temperature evolution
3.3.1 Fatigue limit prediction
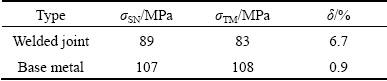
According to LUONG [17], the fatigue limit can be defined as two curves interpolating experimental thermographic data: one for stresses below and the other for stresses above the fatigue limit, and the abscissa of the intersection point of two linear regressions lines, corresponding to the fatigue limit. Figures 7 and 8 represent the Dtmax captured by IRT in stage I versus the corresponding stress levels of base metal and AZ31B magnesium alloy electron beam welded joint, respectively. It is observed that Dtmax varies as a function of the loading stress and two distinct curves with different slopes are remarkable. The fatigue limits of AZ31B magnesium alloy electron beam welded joint and base metal predicted by IRT are 83 and 108 MPa, respectively. With any experimental investigation, there is always a certain degree of unavoidable uncertainty. The percentage difference between σSN and the prediction of fatigue limit σTM obtained by thermography method is evaluated by the formula: δ=(σTM-σSN)/σSN× 100%. Table 5 shows the prediction by IRT and the comparison with the experimental values.
From the results in Table 5, good predictions are achieved between predicted values and experimental values. The absolute maximum difference in the fatigue limit predictions is found to be 6.7%. Low errors are possibly attributed to inhomogeneity in both scattering feature of the experimental data and microstructure, and mechanical property caused by the welding process. Therefore, fatigue limit of AZ31B magnesium alloy electron beam welded joint can be rapidly predicted by IRT, which is of great importance for the development and security application of magnesium alloy in automotive and aerospace industry.
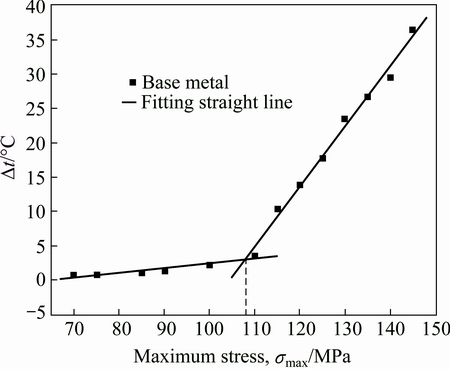
Fig. 7 Fatigue limit prediction of AZ31B magnesium alloy (base metal) by infrared thermography
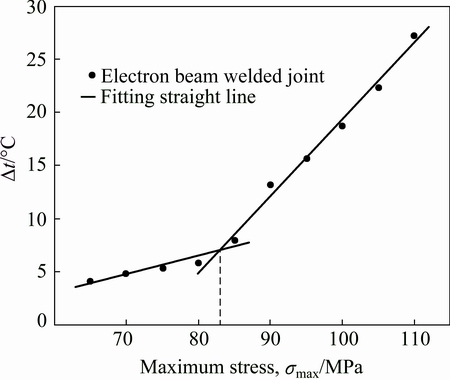
Fig. 8 Fatigue limit prediction of AZ31B magnesium alloy electron beam welded joint by infrared thermography
Table 5 Fatigue limit obtained from fatigue tests and thermographic approach
3.3.2 Damage assessment
Figure 9 presents the temperature variations of AZ31B magnesium alloy electron beam welded joint during fatigue tests. As can be seen in Fig. 9, the initial stage associated with minimal damage in the specimen of AZ31B magnesium alloy electron beam welded joint is depicted with “cold” color coding in the thermograph; whereas along with the accumulation in cycles, progressive damage in specimens is characterized with increasingly “warmer” colors. Being agreement with the temperature evolution of the AZ31B magnesium alloy electron beam welded joint as shown in Fig. 6, the warmest color happened in Fig. 9(b), which indicates that the plastic strain in the specimen researches the maximum.
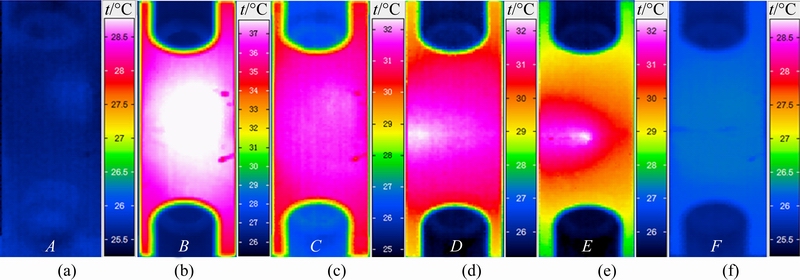
Fig. 9 Thermographic images of AZ31B magnesium alloy electron beam welded joint during fatigue test under 110 MPa
This manifests that a raise in fatigue damage in material is indicated by the increase in the density of the “warmer” colors. And latterly, the visible hot spot zone on the specimen surface can be found through the thermography images recorded by infrared camera. The hot spot in weld specimen tends to appear in the weld toe as shown in Fig. 9(d), which indicates serious fatigue damage in weld toe. It can also be observed that the hot spot extends forward along the direction of weld toe in Fig. 9(e). Finally, the specimen is naturally fractured in weld toe.
Figure 10 shows the failed specimen of AZ31B magnesium alloy electron beam welded joint. Failure in the welded specimen occurs in the weld toe, corresponding to the results obtained by IRT. This is possibly due to the remarkably inhomogenous transition of microstructure from base metal to weld in Fig. 1. This leads to serious stress concentration in the weld toe. And no post heat treatment was applied to the weld, so the residual stress in the weld toe was not relieved. Hence, the weld was failed on the weld toe. CRUPI et al [37] used the thermographic method to predict the fatigue limit of welds, and results showed that welded specimens also failed in the weld toe region. Although some variations may exist in weld specimens, such as differences in the microstructure of the material and weld quality, the behavior of specimens is very consistent.
Meanwhile, it can be concluded that stress concentration has a significant influence on the fatigue strength of the weld from above discussion. Therefore, a quantitative analysis of stress concentration would be conducted by IRT in our further research.
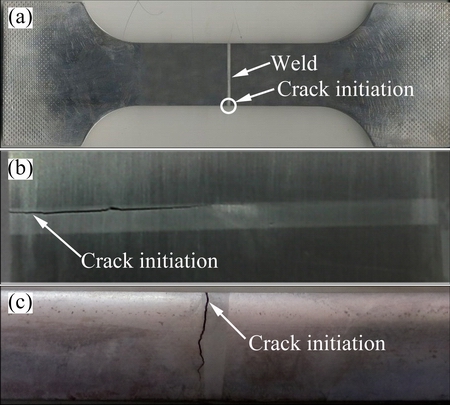
Fig. 10 Photograph of failed specimen of welded joint (a) positive view of fracture position (b) and lateral view of fracture position (c)
4 Conclusions
1) For AZ31B magnesium alloy electron beam welded joints, when the stresses are above the fatigue limit and below the yield limit, five stages of temperature variation are observed during a fatigue test: an initial temperature increase, a temperature decrease stage, a temperature equilibrium, an abrupt temperature increase and a temperature drop after the failure.
2) The fatigue strength of AZ31B magnesium alloy electron beam welded joints under 2×10⁶ cycles is 89 MPa, which can reach 83.2% that of AZ31B magnesium alloy electron beam joint under 1×10⁷ cycles. The fatigue strengths of AZ31B (base metal) and its magnesium alloy electron beam welded joints predicted by IRT are 108 and 83 MPa, respectively, and the percentage errors compared with the conventional experimental values are 0.9% and 6.7%, respectively, suggesting a fine accuracy for infrared thermography in fatigue strength prediction.
3) Fatigue failure in AZ31B magnesium alloy electron beam welded joints was predicted to suffer in the weld toe by means of infrared thermography, which coincides with the traditional experimental results. Therefore, real-time monitoring the evolution of color and hot spot zone on the specimen surface can efficiently assess the fatigue damage in specimens during fatigue tests. Meanwhile, by analyzing their changes, it is likely to avoid unexpected fatigue fracture in practical engineering structures.
References
[1] KALATEHMOLLAEI E, MAHMOUDI-ASI H, JAHED H. An asymmetric elastic-plastic analysis of the load-controlled rotating bending test and its application in the fatigue life estimation of wrought magnesium AZ31B [J]. International Journal of Fatigue, 2014, 64: 33-41.
[2] LV F, ZHANG Z F. Fatigue properties of rolled magnesium alloy (AZ31) sheet: Influence of specimen orientation [J]. International Journal of Fatigue, 2011, 33: 672-682.
[3] HE Chao, WANG Qing-yuan. Fatigue damage evaluation of low-alloy steel welded joints in fusion zone and heat affected zone based on frequency response changes in gigacycle fatigue [J]. International Journal of Fatigue, 2014, 61: 297-303.
[4] CRUPI G, CRUPI V. Fatigue assessment of welded joints using critical distance and other methods [J]. Engineering Failure Analysis, 2005, 12: 129-142.
[5] KARAKAS  Consideration of mean-stress effects on fatigue life of welded magnesium joints by the application of the Smith-Watson-Topper and reference radius concepts [J]. International Journal of Fatigue, 2013, 49: 1-17.
[6] SONSINO C M, FRICKE W. Notch stress concepts for the fatigue assessment of welded joints―Background and applications [J]. International Journal of Fatigue, 2012, 34: 2-16.
[7] MUSTAFA A, MATHIAS B. A comparative study of different fatigue failure assessments of welded bridge details [J]. International Journal of Fatigue, 2013, 49: 62-72.
[8] ZHANG L, LIU X S. Rapid determination of fatigue life based on temperature evolution [J]. International Journal of Fatigue, 2013, 54: 1-6.
[9] AMIRI M, KHONSARI M M. Life prediction of metals undergoing fatigue load based on temperature evolution [J]. Materials Science and Engineering A, 2010, 527: 1555-1559.
[10] FAN J L, GUO X L. Research on fatigue behavior evaluation and fatigue fracture mechanisms of cruciform welded joints [J]. Materials Science and Engineering A, 2011, 528: 8417-8427.
[11] NADERI M, KHONSARI M. Real-time fatigue life monitoring based on thermodynamic entropy [J]. Structural Health Monitoring, 2011, 10: 189-197.
[12] LI X D, ZHANG H. Adopting lock-in infrared thermography technique for rapid determination of fatigue limit of aluminum alloy riveted component and affection to determined result caused by initial stress [J]. International Journal of Fatigue, 2012, 36: 18-23.
[13] LA ROSA G, RISITANO A. Thermographic methodology for rapid determination of the fatigue limit of materials and mechanical components [J]. International Journal of Fatigue, 2000, 22: 65-73.
[14] FARGIONE G, RISITANO A. Rapid determination of the fatigue curve by the thermographic method [J]. International Journal of Fatigue, 2002, 24: 11-19.
[15] CRUPI V. A unifying approach to assess the structural strength [J]. International Journal of Fatigue, 2008, 30: 1150-1159.
[16] LUONG M P. Infrared thermographic scanning of fatigue in metals [J]. Nuclear Engineering and Design, 1995, 158: 363-376.
[17] LUONG M P. Fatigue limit evaluation of metals using an infrared thermographic method [J]. Mechanics of Materials, 1998, 28: 155-163.
[18] CURA F, CURTI G. A new iteration method for the thermographic determination of fatigue limit in steels [J]. International Journal of Fatigue, 2005, 27: 453-459.
[19] WILLIAMS P, KHONSARI M M. A thermographic method for remaining fatigue life prediction of welded joints [J]. Materials and Design, 2013, 51: 916-923.
[20] CHARLES JA, APPL FJ, FRANCIS J E. Using the scanning infrared camera in experimental fatigue studies [J]. Experimental Mechanics, 1975, 14(4): 133-138.
[21] ATTERMO R, OSTBERG G. Measurements of the temperature rise ahead of a fatigue crack [J]. International Journal of Fracture Mechanics, 1971, 7: 122-124.
[22] RANC N, PARIS P C. Study of thermal effects associated with crack propagation during very high cycle fatigue tests [J]. Acta Materialia, 2008, 56: 4012-4021.
[23] JURGEN B, STEFAN S. Investigation of energy dissipation and plastic zone size during fatigue crack propagation in a high-alloyed steel [J]. Procedia Materials Science, 2014, 3: 408-413.
[24] UMMENHOFER T, MEDGENBERG J. On the use of infrared thermography for the analysis of fatigue damage processes in welded joints [J]. International Journal of Fatigue, 2009, 31: 130-137.
[25] YAN Zhi-feng, ZHANG Hong-xia, WANG Wen-xian, WANG Kai, PEI Fei-fei. Temperature evolution and fatigue life evaluation of AZ31B magnesium alloy based on infrared thermography [J]. Transactions of Nonferrous Metals Society of China, 2013, 23(7): 1942-1948.
[26] YAN Z F, ZHANG H X, WANG W X. Temperature evolution mechanism of AZ31B magnesium alloy during high-cycle fatigue process [J]. Theoretical and Applied Fracture Mechanics, 2014, 70: 30-38.
[27] CUI Z Q, YANG H W, WANG W X. Research on fatigue crack growth behavior of AZ31B magnesium alloy electron beam welded joints based on temperature distribution around the crack tip [J]. Engineering Fracture Mechanics, 2015, 133: 14-23.
[28] EMERY T R, DULIE-BARTON J M. Thermoelastic stress analysis of damage mechanisms in composite materials [J]. Composites: Part A, 2010, 41: 1729-1742.
[29] MORABITO A E, CHRYSOCHOOS A. Analysis of heat sources accompanying the fatigue of 2024 T3 aluminium alloys [J]. International Journal of Fatigue, 2007, 29: 977-984.
[30] LOTSBERG I. Stress concentrations at butt welds in pipelines [J]. Marine Structures, 2009, 22: 335-337.
[31] YI Luo, HONG Ye. Influence of focusing thermal effect upon AZ91D magnesium alloy weld during vacuum electron beam welding [J]. Vacuum, 2012, 86: 1262-1267.
[32] LIU Xiao-qing, YAN Zhi-feng. Fatigue life prediction of AZ31B magnesium alloy and its welding joint through infrared thermography [J]. Theoretical and Applied Fracture Mechanics, 2013, 67-68: 46-52.
[33] UEMATSU Y, TOKAJI K. Effect of extrusion conditions on grain refinement and fatigue behavior in magnesium alloys [J]. Materials Science and Engineering A, 2006, 434: 131-140.
[34] MOCKO W. The influence of stress-controlled tensile fatigue loading on the stress-strain characteristics of AISI 1045 steel [J]. Materials and Design, 2014, 58: 145-153.
[35] PANDEY K N, CHANG S. Analysis of temperature distribution near the crack tip under constant amplitude loading [J]. Fatigue & Fracture of Engineering Materials & Structures, 2008, 31: 316-326.
[36] AMIRI M, KHONSARI M M. Rapid determination of fatigue failure based on temperature evolution: Fully reversed bending load [J]. International Journal of Fatigue, 2010, 32: 382-389.
[37] CRUPI V, GUGLIELMINO E, MAESTRO M, MARINO A. Fatigue analysis of butt welded AH36 steel joints: Thermographic method and design S-N curve [J]. Marine Structures, 2009, 22: 373-386.
杨宏伟1,崔泽琴1,2,王文先1,2,许并社1,2,许海鹰3
1. 太原理工大学 材料科学与工程学院,太原 030024;2. 先进镁基材料山西省重点实验室,太原 030024;
3. 北京航空制造工程研究所,北京 100024
摘 要:采用红外热像法对循环载荷下AZ31B 镁合金电子束焊接接头的疲劳行为进行研究。对试件在疲劳试验中表面温度演变规律和产热机制进行分析,并在此基础上对其疲劳极限进行预测,同时通过分析试件表面温度和热点区域的演变规律对其疲劳损伤进行定量评估。结果表明:采用红外热像法不仅能够实现对镁合金电子束焊接接头疲劳极限的快速预测,而且可以对其疲劳损伤进行实时定量监测。镁合金电子束焊接接头疲劳极限预测结果同传统S-N 试验结果保持一致。试件表面温度以及热点区域演变可作为评价镁合金电子束焊接接头疲劳损伤的有效依据。
关键词:镁合金;电子束焊接接头;疲劳行为;红外热像法
(Edited by Wei-ping CHEN)
Foundation item: Project (51305292) supported by the National Natural Science Foundation of China; Project (20105429001) supported by the National Aeronautical Science Foundation of China
Corresponding author: Ze-qin CUI; Tel: +86-15135154042; E-mail: cuizeqin@tyut.edu.cn
DOI: 10.1016/S1003-6326(16)64385-6

