J. Cent. South Univ. (2012) 19: 2354-2364
DOI: 10.1007/s11771-012-1282-0
RandWPSO-LSSVM optimization feedback method for large underground cavern and its engineering applications
NIE Wei-ping(聂卫平)1, XU Wei-ya(徐卫亚)2, LIU Xing-ning(刘兴宁)3
1. Guangdong Electric Power Design Institute, Guangzhou 510663, China;
2. Institute of Geotechnical Engineering, Hohai University, Nanjing 210098, China;
3. Kunming Design and Research Institute, China Hydropower Engineering Group Co., Kunming 650051, China
? Central South University Press and Springer-Verlag Berlin Heidelberg 2012
Abstract: According to the characteristics of large underground caverns, by using the safety factor of surrounding rock mass point as the control standard of cavern stability, RandWPSO-LSSVM optimization feedback method and flow process of large underground cavern anchor parameters were established. By applying the optimization feedback method to actual project, the best anchor parameters of large surge shaft five-tunnel area underground cavern of the Nuozhadu hydropower station were obtained through optimization. The results show that the predicted effect of LSSVM prediction model obtained through RandWPSO optimization is good, reasonable and reliable. Combination of the best anchor parameters obtained is 114131312, that is, the locked anchor bar spacing is 1 m × 1 m, pre-stress is 100 kN, elevation 580.45-586.50 m section anchor bar diameter is 36.00 mm, length is 4.50 m, spacing is 1.5 m × 2.5 m; anchor bar diameter at the five-tunnel area side wall is 25.00 mm, length is 7.50 m, spacing is 1 m × 1.5 m, and the shotcrete thickness is 0.15 m. The feedback analyses show that the optimization feedback method of large underground cavern anchor parameters is reasonable and reliable, which has important guiding significance for ensuring the stability of large underground caverns and for saving project investment.
Key words: random weight particle swarm optimization; least squares support vector machine; large underground cavern; anchor parameters; optimization feedback; rock-point safety factor
1 Introduction
In recent years, some large-scale water control projects have been constructed one after another in China, and many of them have been designed with large or super-large underground caverns as the main hydraulic structures, such as the Longtan, Xiaowan, Nuozhadu, Shuibuya hydropower stations. In construction of underground power houses, the construction scale tends to become larger and larger [1]. However, the local instability of surrounding rock mass of large underground caverns has caused troubles in the whole process of construction, brought about a large number of construction accidents, and resulted in enormous personnel risk and property losses [2]. Construction of large cavern group system is an open, dynamic, non-linear, irreversible complex system with the stress path dependence. Many factors are uncertain or even unknown. Therefore, only the feedback concept can be used to control the system developing toward what people are expecting. In recent years, along with development of numerical simulation and analysis technology, great progress has also been made in the large underground cavern group feedback analysis and optimization design [3-6]. The long term specialists are mainly focusing on studies of the long-term stability of cavern or cavern group [7-10], but now more and more Chinese specialists begin to recognize the great differences of safety and economy between the design support scheme and the optimized design scheme of the complex underground cavern project. They begin to use empirical method or make numerical calculation of a limited pre-determined scheme [11] and then further to get the preferred support scheme. This approach has considerable arbitrariness and lacks scientific basis, therefore, the optimal solution is only of local optimum. Many specialists are dedicated to researching for obtaining the global optimal solution [12-14]. Since 1980s, a number of novel intelligent optimization algorithms have arisen one after the other, such as, the simulated annealing, genetic algorithm, ant colony algorithm, neural network, particle swarm, and they have been applied in large underground cavern anchor support feedback optimization analyses to search for global optimal solution. For example, JIANG [15] has made comprehensive application of genetic algorithm and neural network methods in making global optimization studies of the anchor parameters of Shuibuya underground power house. It can be foreseen that, the integrated method combining the intelligent optimization methods with numerical methods will become one of the most effective approaches to solve the global optimization problems of large support schemes of the large underground caverns. This work, based on previous studies, addressing the large-span and complex structure of the five-tunnel area of the Nuozhadu hydropower station, studies the optimization feedback of large underground cavern anchor parameters by using RandWPSO-LSSVM method and takes the safety factor of surrounding rock mass as the cavern stability control standard, and the multi values such as the stability and economy as comprehensive evaluation indexes. This study concept has great engineering significance and economic value for rapid global optimization cavern support measures and for guiding the construction.
2 Principles of RandWPSO and LSSVM
2.1 Principle of RandWPSO
Particle swarm optimization (PSO) is an evolutionary computation technique, which was first developed by EBERHART and KENNEDY in 1995 [16-17]. PSO algorithm initializes a group of random particles first, and then particles follow the current best particle to search in the solution space, that is, to find the best solution through iteration. Assume the position and velocity of the t-th step iteration of the i-th particle in d dimensional search space are respectively xi, j(t) and vi, j(t), j=1, 2, …, d. In each iteration, the particle updates itself by pbest found by tracking the particle itself and gbest found by the whole group at present. When two optimal solutions are found, the new velocity and new position formulas of the particle are

 (1)
(1)
 (2)
(2)
where w is inertia weight factor; c1 and c2 are positive learning factors; r1 and r2 are uniformly distributed random numbers between 0 and 1; t is the iteration step; pi,j is the optimal solution of the i-th particle in the t-th step iteration, and pg,j is the global optimal solution of the population in the t-th iteration step.
PSO algorithm has great advantages in solving a large number of non-linear, non-differentiable and multi-peak complex optimization problems, but, sometimes, when it has large workload, it often results in disadvantages of low efficiency of PSO search, large calculation workload, being prone to precocity and to falling into the trap of local optimum [18]. To overcome these shortcomings, RandWPSO (random weight particle swarm optimization) is used to improve the conventional particle swarm algorithm. Set w in the standard PSO algorithm to be random number obeying a certain random distribution, approaching the best point in the initial period of evolution, and the random value w may generate a relatively small w to accelerate the convergence speed. In addition, if the best point cannot be found in the initial period of algorithm, the w linearity decreases, resulting in the algorithm not converge to the final best point, but the w random generation can overcome this limitation. The w calculation formula is as follows:
 (3)
(3)
where N(0,1) stands for random number of standard normal distribution; rand(0,1) is random number between 0 and 1; μmax is the maximum value of random weight average values; μmin is the minimum value of random weight average values; ε is the variance of random weight.
2.2 Principle of LSSVM
Least squares support vector machine (LSSVM) was proposed by SUYKENS et al [19]. It is an extension of the standard SVM. The optimization index uses quadratic term, and equality constraint is used to substitute the inequality constraints of the standard SVM, that is, the quadratic programming problem is converted to linear system of equations for the solution, thus the computation complexity is reduced and the speed solving the linear equations is quickened. The method is to change the inequality constraints of the standard SVM into equality constraint as follows:
 (4)
(4)
Structural risk minimization becomes
 (5)
(5)
To solve the above optimization problem and change the constrained optimization problem into unconstrained optimization problem, the Lagrange function is established as
 (6)
(6)
The KKT conditions are
 (7)
(7)
Then we have
 (8)
(8)
where Y={y1, …, yl}; I={1, …, 1}; b={b}; K= f T(xi)f (x)=K(xi, x); α={αi, …, αl}. K(xi, x) is to meet the kernel function of the Mercer condition, and LSSVM model is mainly to choose the support vector machine parameters: the kernel function and the penalty factor C. The kernel function has many different types. Usually, the radial basis kernel function (RBF) has a better fitting and generalization ability, and is often commonly used in the projects. Therefore, the radial basis kernel function is chosen as the kernel function of the model. RBF formula is:
 (9)
(9)
By solving Eq. (9), LSSVM output is
 (10)
(10)
Obviously, LSSVM method is much faster than the standard SVM.
3 Optimization feedback steps based on RandWPSO-LSSVM anchor parameters
The complexity of large underground caverns determines that optimization analysis of the anchor scheme is a challenge. The characteristics of optimization of anchor parameters [20] are: 1) The optimization indexes of the stability evaluation and economic evaluation are contradictory; 2) The analysis of cavern group stability is extremely complex; 3) Different combinations of anchor parameters can form a large number of schemes, so the optimization computation load is large; 4) Different combinations of anchor parameters of the entire cavern group should be able to fully reflect the different effects on the cavern stability, that is, different support effects.
Using RandWPSO-LSSVM optimization method enables the three-dimensional global optimization problem to be realized, and the computing speed is increased greatly. The specific steps of optimization of large underground cavern anchor parameters are as follows:
1) Determine the optimization evaluation index of the anchor parameters and multiple attribute evaluation index based on maximizing deviations;
2) Make orthogonal design anchor parameters scheme learning sample and testing sample;
3) Make analysis of the sample three-dimensional elastic-plastic numerical simulation; under the precondition of meeting the control index of the surrounding rock mass stability, use RandWPSO- LSSVM algorithm search to get the best LSSVM prediction model; when the optimized anchor parameter individual particle is input to the best LSSVM prediction model, the RandWPSO algorithm searches for the optimal anchor parameters.
4) When the optimal anchor parameters are fed back on the numerical simulation computation, make comprehensive evaluation of the stability of the construction surrounding rock mass of large underground caverns and feed back the rationality of the design.
At present, many underground cavern stability indexes take the surrounding rock mass limit deformation value as the control standard. However, as for the caverns of the Nuozhadu hydropower station with the surge shaft span far more than 20 m, there is no specific index in the current specifications that can be used for reference. Therefore, the rock-point safety factor derived from the Mohr-Coulomb criterion commonly used in projects [21] can be used as the control standard of underground cavern surrounding rock mass stability in this work. According to the “Classification and Design Safety Standard of Hydropower Projects” (DL5180―2003), and “Design Code for Hydropower House” (SL266―2001), as for the types of rock base foundation, the minimum safety factor for ensuring the stability of large underground cavern surrounding rock mass is required to be 1.05. For Mohr-Coulomb envelope curve, as shown in Fig. 1, the safety factor expressed by friction angle φ, large and small main stress σ1 and σ3 are described in Eq. (11):
 (11)
(11)
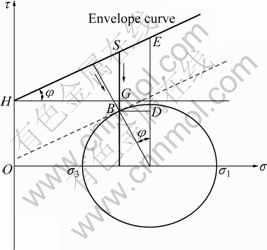
Fig. 1 Mohr-Coulomb envelope curve
The optimization process of anchorage parameters is shown in Fig. 2.
4 Engineering application
4.1 Project overview
The Nuozhadu hydropower station tail water building structure includes three tail water branch tunnels connected with one tail water tunnel. Their crossing is connected with a tail water surge draft, and totally three tail water surge drafts are arranged. The three surge shafts are arranged in a straight line, with a spacing of 102.0 m. The geological formation includes grade III faults, F20, F21 and F22. The excavation diameter of the surge shaft is 29.3-34.3 m, with a clearance height of 92.0 m; the excavation cross-section dimension of the tail water branch tunnel is of horseshoe-shape of 14.9 m ×18.75 m (width×height); the tail water tunnel is a round excavation, with excavation diameter of the standard circular section of 19.40-21.70 m; the lower part of the surge draft is a five-tunnel crossing suspension structure of elevation of 580.45-561.00 m; the structure span is large, having serious impact on the stability of surrounding rock mass during the cavern construction. Making a good design of anchor parameters of the five-tunnel area is an important guarantee for normal construction and operation of the entire surge shaft. The excavation site of the five-tunnel area is shown in Fig. 3.

Fig. 2 Optimization process of anchor parameters
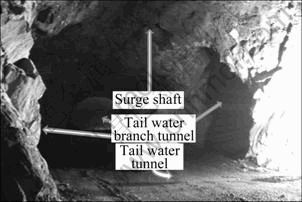
Fig. 3 Excavation site of five-tunnel area
4.2 Establishment of three-dimensional finite element model
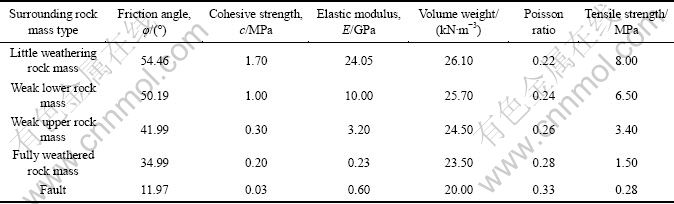
The range of three-dimensional computation model: X from -349 m to -103 m, Y from 0 m to 450 m, Z from 501 m to 865 m, divided into 184 336 units, and 38 954 nodes. It uses displacement boundary and solid element simulation. Steel bar and anchor bar use CABLE unit simulation. The underground cavern layout and fault finite element computation model and 3D geological model of the project area are shown in Fig. 4 and Fig. 5, respectively. The cavern excavation has totally 38 steps. According to the design parameters provided by HYDROCHINA Kunming Engineering Corporation, the finite element computation mechanical parameters of each rock layer are given in Table 1 and the design anchor parameters of various parts are given in Table 2. The initial crustal stress is applied by using lateral pressure coefficient method.
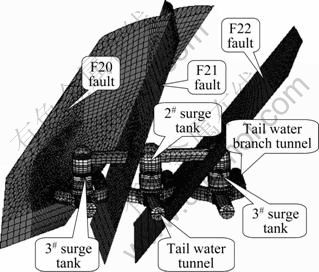
Fig. 4 Underground cavern layout and faults finite element computation model
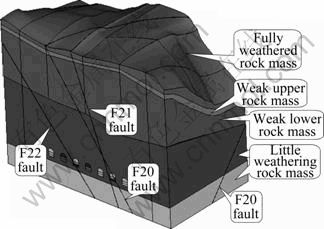
Fig. 5 3D geological model of surge shaft project area
4.3 Determination of optimization evaluation index of anchor parameters
By taking into consideration the economic efficiency of the anchor scheme and the stability of the cavern, the following seven evaluation index values are used to evaluate the economic efficiency and safety of the project construction. 1) Stability indexes: the minimum safety factor of surrounding rock mass; the maximum average displacement of the surge shaft arch rock (the average of the maximum displacement of the arches of three surge shafts) in the optimized area; the maximum average displacement of the surge shaft side walls (the average of the maximum displacement of the side walls of the three surge shafts); the maximum average displacement of the five-tunnel area side walls (the average of the maximum displacement of the side walls of the three positions of the five-tunnel area); the volume of the tensile stress zone (the volume of the surrounding rock mass with tensile stress greater than 0); the volume of the plastic zone. 2) Economic indexes: the support cost (to be determined based on the material cost and labor cost of various anchor schemes).
Table 1 Mechanical parameters for finite element calculation
The span of the five-tunnel area of the surge shaft lower part of Nuozhadu hydropower station is large, and the structure is complex. The planned scope for optimization is the elevation with 561.00-586.50 m section of the surge shaft. The parameters needed to be optimized include: the anchor bar diameter, spacing and length in the elevation section of 580.45-586.50 m; the spacing and pre-stressed grade of the locked pre-stressed anchor bar (shortened as the locked anchor bar) at the intersection of the shaft body and the five-tunnel crossing area, and the intersection of the tail water branch tunnel and the five-tunnel crossing area; the diameter, spacing, length of the side wall anchor bar at the five-tunnel area; and the shotcrete thickness, altogether nine factors, and each factor takes four levels, as listed in Table 3.
4.4 Optimization sample structure
To make scheme combination of the encoded values in Table 3, for example, the scheme with mode code 134212312, the represented sample scheme is shown in Fig. 6. To use L32(49) table to design various level of orthogonal experiment, 32 sample schemes are obtained. Through numerical calculation and the support cost estimate, the evaluation index values of each sample scheme are as follows: the minimum safety factor range of the surrounding rock mass is 1.050 33-1.082 59; the maximum average displacement of the surge shaft arch rock is 5.971 3-6.241 mm; the maximum average displacement of the surge shaft side wall is 8.358- 9.167 mm; the maximum average displacement of the five-tunnel area side wall is 10.547-11.171 3 mm; the volume of the plastic zone is 1.232 31×105-1.256 89× 105 m3; the volume of the tensile stress zone is 1.699 14× 105-1.702 72×105 m3; the support cost is 943 150.77- 2 326 067.30 RMB YUAN. In calculation, the locked anchor bar uses the pre-stressed anchor bar unit, the system anchor bar uses the anchor bar unit and the shotcrete uses the shell unit.
Table 2 Design anchor parameters of various positions
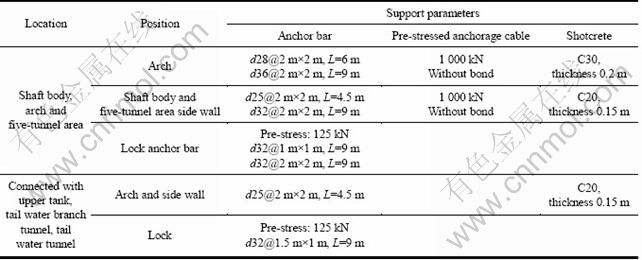
Table 3 Coding of anchor parameters
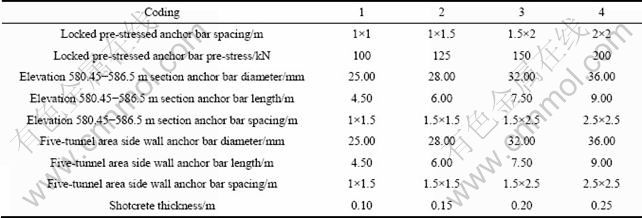
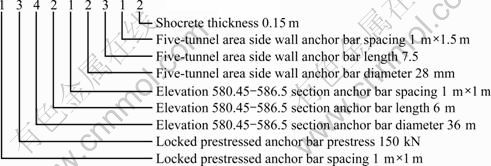
Fig. 6 Sample scheme mode code
When there are significant differences in the orders of magnitude and the dimension of various scheme index, the index values should be normalized, as shown in Eq. (12).
 (12)
(12)
where  is the normalized result; Mk,l is the value of the k-th component of the l-th index; Mmin is the minimum value of the l-th index; Mmax is the maximum value of the l-th index.
The comprehensive optimized index, f(x), for the anchoring scheme, is calculated from the weighted method according to
 (13)
(13)
where wl is the weight coefficient of the l-th index.
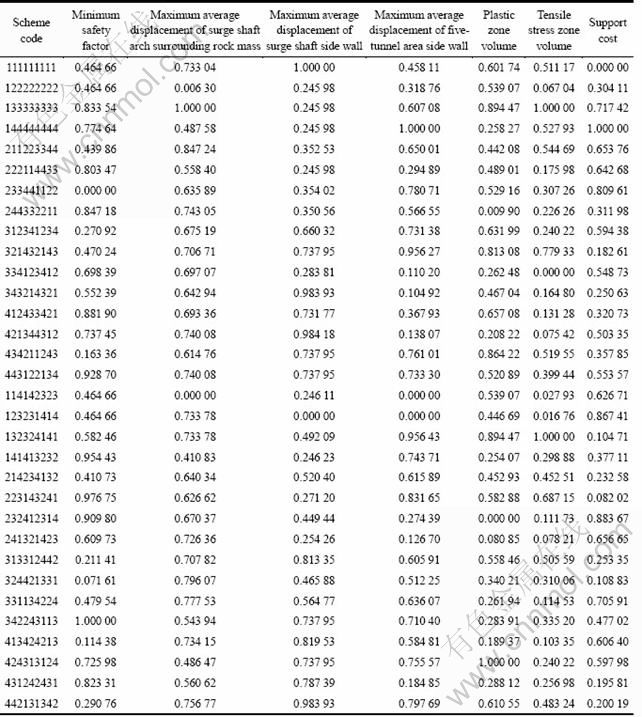
The calculation normalized results of various scheme index are listed in Table 4.
4.5 Analysis of optimization results
Known from the numerical calculation, the minimum safety factor of the surrounding rock mass in each scheme is greater than the code requirement. Therefore, the project meets the requirement of the above surrounding rock mass stability control standard, and optimization analysis for anchor parameters can be made. According to the above normalized scheme table, through calculation by multiple attribute group decision- making approach based on maximizing deviations [22], the best weight vector ω=(0.160, 0.093, 0.154, 0.016 2, 0.141, 0.143, 0.147) of severn evaluation indexes of the optimized zone is obtained. Integration of the evaluation index value of each scheme is made according to the group decision-making weight vector, and the comprehensive optimized index f(x) of the anchoring scheme is obtained and used as the objective function of RandWPSO-LSSVM optimization algorithm.
When optimizing the anchor parameters, the RandWPSO parameters are set as follows: c1=c2=2.05, μmax=0.80, μmin=0.50, ε=0.20, particle number i=40, the maximum iteration step is kmax=200, the searching region of LSSVM parameter is C=50.00-1 000.00, σ2= 0.70- 10.00. The sample can be converged by testing 130 steps, the LSSVM best parameter combination is C=255.32, σ2=10.00; for the comparison of the predicated value and the sample test value is shown Fig. 7. Known from the comparison of the predicated value and the sample test value, the maximum relative error of the two is 3.21%, which indicates that the LSSVM has established the relations between the predicated value and the test value. The prediction result is quite good, and LSSVM prediction model obtained by RandWPSO optimization is rational and reliable.
On the basis of the best LSSVM prediction model obtained, RandWPSO algorithm is used to search the best anchor parameters. The RandWPSO parameters are set as follows: c1=c2=2.05, μmax=0.80, μmin=0.50 and ε= 0.20. Particle number i=40, the maximum iteration step kmax=500, and the parameters of the best LSSVM prediction model are C=255.32 and σ2=10.00. The obtained combination of the best anchor parameters is 114131312, i.e., when the locked anchor bar spacing is 1 m × 1 m, pre-stress is 100 kN, elevation 580.45- 586.50 m section anchor bar diameter is 36.00 mm, length is 4.50 m, spacing is 1.5 m × 2.5 m, five-tunnel area side wall anchor bar diameter is 25.00 mm, length is 7.50 m, spacing is 1 m × 1.5 m, and shotcrete thickness is 0.15 m, the economy and stability of the anchoring optimization is the best, and the comprehensive evaluation index convergence value is 0.167 3. The convergence result of the anchor parameter optimization adaptive values is shown in Fig. 8.
Table 4 Orthogonalization experimental design normalized value of anchor parameter mode code
5 Optimization feedback of anchor parameters
By substituting the combination of best anchor parameters 114131312 and the design anchor parameters to 3D finite element model for forward feedback calculation, the surrounding rock mass calculation mechanical property parameters adopting the design value, the comparison values of each evaluation index value under the two conditions are obtained, and they are given in Table 5. The elevation z=573.50 m horizontal section surrounding rock mass deformation comparison, x=-225.97 m longitudinal section plastic zone distribution condition comparison and rock-point safety factor distribution condition comparison are shown in Fig. 9, Fig. 10 and Fig. 11, respectively.
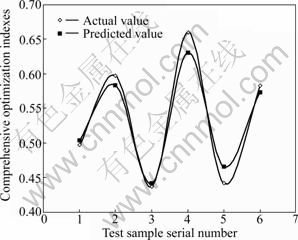
Fig. 7 Comparison of predicted value and actual value of comprehensive optimization indexes
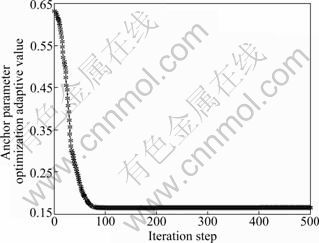
Fig. 8 Convergence result of anchor parameter optimization adaptive values
Table 5 Comparison calculation results of under condition of design anchor and best anchor parameters
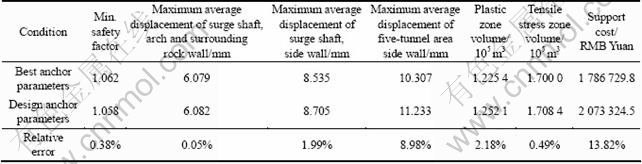
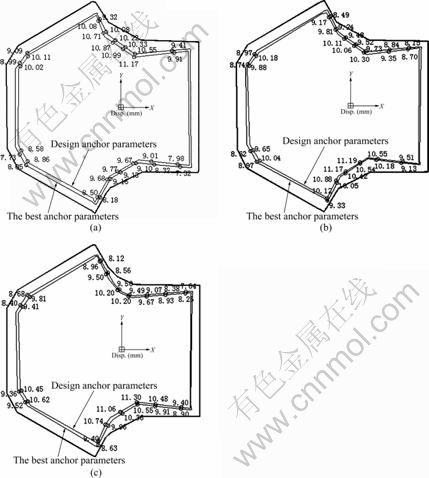
Fig. 9 Comparison of elevation z=573.50 m horizontal section deformation conditions: (a) #1 surge shaft; (b) #2 surge shaft; (c) #3 surge shaft
Known from Figs. 9-11, for the design value of the best anchor parameters compared with the calculation value of the design anchor parameters, the minimum safety factor is higher, and the other index values are lower. The surrounding rock mass deformation is obviously small, the five-tunnel area side wall plastic zone is obvious less, and the maximum value of the evaluation index value relative error is 13.82%, indicating that the cavern economy and stability of the calculated best anchor parameters are better than those under the condition of the design anchor parameters, and it has great guiding significance for maintaining stability of the large underground cavern and saving investment of the project.
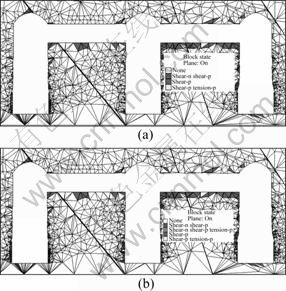
Fig. 10 Comparison of x=-225.97 m longitudinal section plastic zone distribution under two conditions: (a) Best anchor parameters condition; (b) Design anchor parameters condition
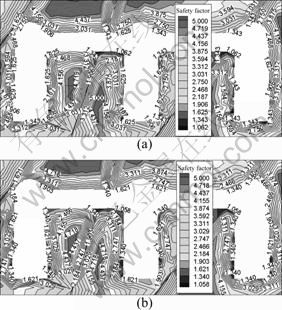
Fig. 11 Comparison of x=-225.97 m longitudinal section rock- point safety factor distribution under two conditions: (a) Best anchor parameters condition; (b) Design anchor parameters condition
6 Conclusions
1) With consideration of the characteristics of large underground caverns, taking the surrounding rock mass safety factor as the cavern stability control standard, RandWPSO-LSSVM optimization feedback method for large underground cavern anchor parameters is established, and the specific steps and flow process are given.
2) Based on the actual project, with comprehensive consideration given to the economy of the anchorage scheme and stability of the caverns, through adopting the minimum safety factor of sourrounding rock mass, the maximum average displacement of surge shaft arch surrounding rock mass, the maximum average displacement of surge shaft side wall, the maximum average displacement of fiver-tunnel area side wall, the tensile stress zone volume, the plastic zone volumn, and the support cost as the comprehensive evaluation indexes, and orthogonal design learning and testing sample, the sample can be converged only by testing 130 steps when making anchor parameter optimization. The obtained LSSVM best parameter combination is C=255.32, σ2= 10.00 and the maximum relative error of the predicted value and the actual value is 3.21%, indicating that LSSVM has established the relations between the predicted value and the actual value successfully. The prediction effect is quite good, and the LSSVM prediction model obtained by RandWPSO optimization is rational and reliable.
3) By optimization of the anchor parameters, the combination of the best anchor parameters of the five-tunnel area of the large surge shaft lower part of the Nuozhadu hydropower station is 114131312, i.e., the locked anchor bar spacing is 1 m × 1 m, the pre-stress is 100 kN, the elevation 580.45-586.50 m section anchor bar diameter is 36.00 mm, length is 4.50 m and spacing is 1.5 m × 2.5 m; the five-tunnel area side wall anchor bar diameter is 25.00 mm, length is 7.50 m, spacing is 1 m×1.5 m and shotcrete thickness 0.15 m. The feedback analysis shows that the cavern stability under the best anchor parameter condition is better than that under the design anchor parameter condition, and the optimization feedback method for the large underground cavern anchor parameters used in this work is rational and reliable.
References
[1] FENG Xia-ting, JIANG Quan, XIANG T B. Dynamic feedback analysis and design optimization for large underground powerhouse [J]. Rock Mechanics for Underground Mining, 2009, 10(1): 87-104.
[2] QIAN Kang. Collapse disaster analysis of #1 diversion tunnel of Tianshengqiao Hydropower Station [J]. Geological Hazards and Environmental Protection, 1996, 7(4): 7-12.
[3] HOJO A, NAKAMURA M, SAKURAI S, AKUTAGAWA S. Characterization of non-elastic ground behavior of a large underground power house cavern by back analysis [J]. International Journal of Rock Mechanics & Mining Sciences, 1997, 34(3/4): 801-808.
[4] FENG Xia-Ting, HUDSON J A. The ways ahead for rock engineering design methodologies [J]. International Journal of Rock Mechanics & Mining Sciences, 2004, 41(2): 255-273.
[5] HUDSON J A, FENG Xia-ting. Updated flowcharts for rock mechanics modelling and rock engineering design [J]. International Journal of Rock Mechanics & Mining Sciences, 2007, 44(2): 174-195.
[6] LEANDRO R, ALEJANO, TABOADA J, FERNANDO G B, RODRIGUEZ P. Multi-approach back-analysis of a roof bed collapse in a mining room excavated in stratified rock [J]. International Journal of Rock Mechanics & Mining Sciences, 2008, 45(6): 899-913.
[7] GNIRK P F, FOSSUM A F. On the formulation of stability and design of design criteria for compressed air energy storage in hard rock cavernst [C]// Proceedings of the Intersociety Energy Conversion Engineering Conference. Washington: Am Chem Soc, 1979: 429-440.
[8] MILLER, STEPHEN A, GARDNER, BRUCE H. Long-term stability of Bryan mound solution caverns for LPG storage, with worst-case scenario [C]// Proceedings of the Symposium-Solution Mining of Salts and Brines. New York, NY, USA Soc of Mining Engineers of AIME, 1985: 71-80.
[9] HAGAN T N. Design and performance of underground excavation [C]// ISRM Symposium of Int Soc for Rock Mechanics. Lisbon: Port British Geotechnical Soc, 1984: 255-262.
[10] XU Wei-ya, NIE Wei-ping, ZHOU Xian-qi, SHI Chong, WANG Wei, FENG Shu-rong. Long-term stability analysis of large-scale underground plant of Xiangjiaba hydro-power station [J]. Journal of Central South University of Technology, 2011, 18(2): 511-520.
[11] LI Xi-bing, ZHOU Zi-long, LI Qi-yue, HU Liu-qing. Parameter analysis of anchor bolt support for large-span and jointed rock mass [J]. Journal of Central South University of Technology, 2005, 12(4): 483-487.
[12] AN Hong-gang. Analysis of large cavern stability and optimization of integrated intelligent integration method [D]. Beijing: Graduate School of Chinese Academy of Sciences, 2002: 5.
[13] CHEN Wei-zhong, ZHU Wei-shen, LI Shu-cai, QIU Xiang-bo. Analysis and studies of Shuibuya hydropower station large underground cavern construction sequence and anchor parameters optimization [J]. Chinese Journal of Rock Mechanics and Engineering, 2003, 22(10): 1623-1628.
[14] SHAO Min. Numerical simulation analysis of underground cavern excavation of two-dimensional dynamic process [J]. Chinese Journal of Geotechnical Engineering, 2000, 22(4): 421-425.
[15] JIANG An-nan. Study of feedback optimizing and analyzing the schemes of excavation and supporting of large cavern group using integrated intelligent method [D]. Shenyang: Northeastern University, 2005.
[16] EBERHART R C, KENNEDY J. A new optimizer using particle swarm theory [C]// Proceedings of the Sixth International Symposium on Micromachine and Human Science. Nagoya, Japan, 1995: 39-43.
[17] KENNEDY J, EBERHART R C. Particle swarm optimization [C]// IEEE International Conference on Neural Networks. Piscataway, NJ: IEEE Service Center, 1995: 1942-1948.
[18] YANG Wei, LI Qi-qiang. A survey on particle swarm optimization [J]. China Engineering Sciences, 2004, 6(5): 87-92.
[19] SUYKENS J A K, van GESTEL T, de BRABANTER J. Least squares support vector machines [M]. Singapore: World Scientific Publishers, 2002: 34-46.
[20] SHENG Ji-liang. Underground rock stability of fuzzy comprehensive evaluation model studies [J]. Chinese Journal of Rock Mechanics and Engineering, 2003, 22(1): 2418-2421.
[21] NIE Wei-ping, XU Wei-ya, ZHOU Xian-qi. Grey relation analysis of parameter sensitivity of cavern stability based on 3D elastoplastic finite elements [J]. Chinese Journal of Rock Mechanics and Engineering, 2009, 28(supp.2): 3885-3893. (in Chinese)
[22] XU Ze-shui. Uncertain Multi-attribute decision making methods and applications [M]. Beijing: Tsinghua University Press, 2005: 55-59.
(Edited by HE Yun-bin)
Foundation item: Project(50911130366) supported by the National Natural Science Foundation of China
Received date: 2011-07-10; Accepted date: 2011-10-25
Corresponding author: NIE Wei-ping, PhD; Tel: +86-13924089106; E-mail: nwp_jzit@tom.com

