������������ṹ�ľ�����Ӷ���ѧģ���� �ṹ����ѧģ�͵ıȽ�
��Դ�ڿ����й���ɫ����ѧ��(Ӣ�İ�)2014���5��
�������ߣ�����ȫ �� �� ������
����ҳ�룺1488 - 1499
�ؼ��ʣ��۽ṹ��Ԫ�ֲ������Ӷ���ѧģ�⣻�ṹ����ѧģ�ͣ����������
Key words��distribution of microstructural units; molecular dynamic simulation; structural thermodynamic model; calcium silicate melts
ժ Ҫ��ͨ��������Ӷ���ѧģ�⼰һ���½��Ľṹ����ѧģ�ͼ������˹��������ľ���ṹ��Ԫ��ȫ�̷ֲ����������ַ�����õ�5��SiO�������Qi�ֲ����бȽϣ�����Raman����ʵ�������бȽϣ�����Ǻϵ÷dz��á��ⲻ���������ṹ��Ԫ��ȫ�ɷַ�Χ�ڵ�ȫ���ֲ�������֤�������ǵ�ģ���ʺ�����Թ���ʵ�����ݵĺ�������ѧ���㡣���ͬʱ���ɲ�ͬ�绯��Ӧ���Ƶ�5���ɷ�����Ҳ����ȷ���֡����Ӹýṹ����ѧģ�����״λ����Qi֮����������ӷ�ʽQi-Ca-Qj��Qi-[Ob]-Qj�ķֲ���������ɴ�֤�����гɷ��ж����Եȼ�����Ϊ��Ҫ�����ӷ�ʽ��
Abstract: The distributions of local structural units of calcium silicate melts were quantified by means of classical molecular dynamics simulation and a newly constructed structural thermodynamic model. The distribution of five kinds of Si-O tetrahedra Qi from these two methods was compared with each other and also with the experimental Raman spectra, an excellent agreement was achieved. These not only displayed the panorama distribution of microstructural units in the whole composition range, but also proved that the thermodynamic model is suitable for the utilization as the subsequent application model of spectral experiments for the thermodynamic calculation. Meanwhile, the five refined regions mastered by different disproportionating reactions were obtained. Finally, the distributions of two kinds of connections between Qi were obtained, denoted as Qi-Ca-Qj and Qi-[Ob]-Qj, from the thermodynamic model, and a theoretical verification was given that the dominant connections for any composition are equivalent connections.
Trans. Nonferrous Met. Soc. China 24(2014) 1488-1499
Yong-quan WU, Chen DAI, Guo-chang JIANG
Shanghai Key Laboratory of Modern Metallurgy & Materials Processing, School of Materials Science and Engineering, Shanghai University, Shanghai 200072, China
Received 14 June 2013; accepted 18 December 2013
Abstract: The distributions of local structural units of calcium silicate melts were quantified by means of classical molecular dynamics simulation and a newly constructed structural thermodynamic model. The distribution of five kinds of Si-O tetrahedra Qi from these two methods was compared with each other and also with the experimental Raman spectra, an excellent agreement was achieved. These not only displayed the panorama distribution of microstructural units in the whole composition range, but also proved that the thermodynamic model is suitable for the utilization as the subsequent application model of spectral experiments for the thermodynamic calculation. Meanwhile, the five refined regions mastered by different disproportionating reactions were obtained. Finally, the distributions of two kinds of connections between Qi were obtained, denoted as Qi-Ca-Qj and Qi-[Ob]-Qj, from the thermodynamic model, and a theoretical verification was given that the dominant connections for any composition are equivalent connections.
Key words: distribution of microstructural units; molecular dynamic simulation; structural thermodynamic model; calcium silicate melts
1 Introduction
Properties of calcium silicate melts, such as viscosity, configurational entropy, are directly related to their microstructure, especially the distribution of Si-O tetrahedra and their connections. Investigations on the microstructure of calcium silicate melts, therefore, are fundamental towards understanding the physical properties of metallurgical slag [1], geological magmas [2], and ceramic materials [3], which control the mechanism of practical phenomena. The vital of all to master the physicochemical behavior of calcium silicate melts is the measurement of the relative abundances of microstructural units and their mixing properties from computational [4-8] and spectral experiments [9-12], as well as some theoretical models [13,14].
Up to now, most studies were concentrated on the silicate glasses instead of melts because of the harsh experimental condition of high liquidus temperature up to 1700-2000 K for silicate melts. In 1970, SHUKER and GAMMON [15] presented the outline of a calculation leading to an equation for the spectral scattering intensity (especially the Raman intensity) in terms of the density of states of the vibrations in amorphous materials. Since then, hundreds of works were reported on the study of the scattering coefficients, but all of them were concentrated on the low-frequency region, where the boson peak is located in. Therefore, the quantification of microstructural units from deconvolution of envelope is still far from resolution. So far, the investigations of silicate glasses under atmospheric pressure identified the basic structural units as five kinds of Si-O tetrahedrons, denoted as Qi, where i represents the number of bridging oxygen, with the utilization of Raman spectroscopy [15-18] and 29Si NMR [19,20]. Besides, in order to move away the stone of high temperature, the new technique of high-temperature Raman spectroscopy [21] has also been developed in the past decade. Recently, our newly theoretical research [22] has also partly resolved the evaluation of Raman coupling coefficient and its Integration-Raman scattering coefficient. Thus, the quantification of Raman spectra can be achieved. On the other hand, the obstacle of high temperature means nothing for ��computer experiments��, such as molecular dynamic simulation and Monte Carlo method. Even so, all knowledge about the microstructure from Raman spectral measurement and ��computer experiments�� is still discrete. To obtain the panorama of distribution of microstructural units, a structural thermodynamic model is indispensable.
In this work, two kinds of results about the unique distribution of tetrahedral units for calcium silicate melts from classic molecular dynamics simulation, and a structural thermodynamic model, as well as the in-situ high-temperature Raman spectral (HTRS) measurement are presented and compared with each other. One of ultimate functions of this work is to serve as the basis and complete knowledge about microstructural distributions for some structural or formulated models applied for the calculations of spectral, thermodynamic and transporting properties.
2 Description of theoretical calculation and experimental measurement
2.1 Molecular dynamics simulation
The MD simulation code applied in this study is MOLDY version 2.26 from Department of Earth Sciences, UK, with the insertion of our own designed analysis module of equilibrium configurations. All ions in the simulation are treated as rigid with their formal charges: Ca2+, Si4+, and O2-. The potential applied in these simulations is of two-body Born-Mayer-Huggins (BMH) form that has been tested in the previous work [22]:
 (1)
(1)
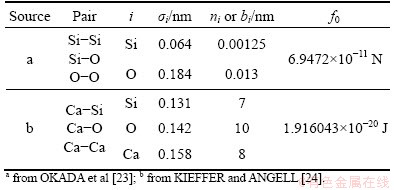
where u(rij) is the interatomic potential and rij denotes the interatomic distance. The first term in the right side represents Coulomb interaction and the second term is inter-core short-range repulsion. For three pairs of Si-Si, Si-O and O-O, the values sourced from OKADA et al [23], in which the two parameters of Bij, and ��ij expressed as Bij=��ij=bi+bj, are used; for the rest three pairs applied are the values from KIEFFER and ANGELL [24], in which the parameter of Bij is expressed as Bij=1+qi/ni+qj/nj where ni represents the number of out-shell electrons in atom i, and ��ij is maintained constant, 0.029 nm. Because of the different expressions between OKADA et al [23] and KIEFFER and ANGELL [24] for Bij, the parameter of f0 has different physical meanings and units just as listed in Table 1.
Table 1 Parameters for Born-Mayer-Huggins (BMH) potential
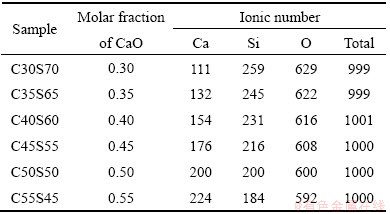
The canonical ensemble employing  thermostat [25] for the temperature control is used for the structural relaxation runs. In this work, the initial configuration is generated with ��skew start�� method [26], which is proven to be very fitting for the simulation of liquid state. The initial velocities of ions are chosen from the Maxwell-Boltzmann distribution [27] at the specified initial temperature of 6000 K. After the structural relaxation of about 3000 steps, the objective temperature of 2000 K is reset. Another 5000 steps are used to achieve the systematic equilibrium. Then, the relative abundance of tetrahedral units is averaged for 5000 equilibrium configurations obtained every other 120 steps with a defined cutoff Si-O distance of 0.2 nm, which corresponds to the position of the first minimum of Si-O partial radial distribution function (RDF). So, the total number of simulation steps is 608000. Because the time step is set as 0.001 ps, the total simulating time is 608 ps. Finally, the compositions and ionic number of all samples in MD simulation are listed in Table 2.
Table 2 Molar fraction and ionic number of samples in MD simulation
2.2 Structural thermodynamics of self-consistent model
This structural thermodynamic model treats the calcium silicate melts with seven structural units: dissociative Ca2+, free oxygen O2- and five kinds of Si-O tetrahedral units denoted as Qi. Therefore, for one system, two sets of components will be used in the deduction of this model: one is the macro components of
 (2)
(2)
 (3)
(3)
As we know, Gibbs free energy of a system is contributed by enthalpy and entropy, where the entropy can be further divided into two parts of the configuration and non-configuration.

 (4)
(4)
where the enthalpy and non-configurational entropy are treated as the sum of characteristic enthalpies and entropies of five tetrahedral units because Ca2+ and O2- are both single atomic units. Then the Gibbs free energy can be rewritten as

 (5)
(5)
where the subscript 0 represents the molar quantities, namely  and
and  represent the characteristic enthalpy and entropy per mole of unit Q2. The term of Go represents the free energy of independent system of Qi, in which each Qi has no interactions with others.
 (6)
(6)
Thus, the 10 parameters of characteristic enthalpies  and non-configurational entropies
  are the inner properties of Qi and can be directly calculated from the spectral or calorimetric enthalpies and entropies of corresponding single crystals. For instance, the single crystal CaSiO3 has only one kind of tetrahedral unit Q2, so its enthalpy and entropy can be defined as the characteristic enthalpy and entropy of Q2, respectively. In addition to the contribution of configurational entropy, which represents the connections between Qis, we can make the independent system into the real melt, interacting system.
For the configurational entropy is directly related with the spatial topology of the seven microstructural units, two contributions should be considered, one is the connection between tetrahedral units via Qi-Ca-Qj and the other is that via Qi-[Ob]-Qj, where Ob is the bridging oxygen and the brackets indicate that Ob is co-possessed by two tetrahedra. The molar fraction of Xi is corresponding to the number of structural units of ni. By extending the thought of quasi-lattice model of YOKOKAWA and NIWA [14], all the structural units should be arranged into the lattice points. Firstly, the connection centers of Ca and Ob should be distributed and the number of ways of distribution of these two kinds of centers is given by
 .
.
The distributions of two kinds of connections are listed in Table 3.
Table 3 Distribution of two kinds of connections
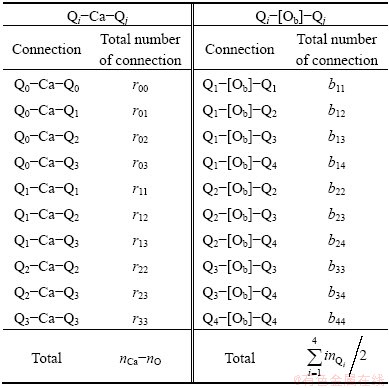
Obviously, Q4 does not appear in the first connection because it has no non-bridging oxygen, Onb. Similarly, the second connection has no Q0 because Q0 has no bridging oxygen, Ob. Then, the numbers of ways of these two kinds of distributions are given by

where rij represents the number of Qi-Ca-Qj and

where bij is the number of Qi-[Ob]-Qj. It should be noted that the free oxygen is also distributed. Because free oxygen always coordinates with calcium, the number of ways of this distribution is given by  . Summarizing the above analyses, the normalized total number of ways of distribution is


 (7)
(7)
With the application of the thermodynamic regulation that the configurational entropy should be the maximum when the system approaches equilibrium and the expression of the configurational entropy Scr=kln �� where k is the Boltzmann constant, Eq. (7) can be rewritten as


 (8)
(8)
Expressing the configurational entropy with Eq. (8) and applying the Stirling formula 
 , we obtained


 (9)
(9)
Dividing the terms in above equation with 
 and representing the Boltzmann constant k with the molar gas constant R according to R=N0��k where N0 is Avogadro constant, the final expression of configurational entropy can be achieved:


 (10)
(10)
With the combination of Eq. (5) and Eq. (10), we can calculate the thermodynamic properties from the microstructural information.
As mentioned somewhere above, the characteristic enthalpies and non-configurational entropies can be evaluated from two kinds of sources: the spectral and the calorimetric. As the first application step of this model, the 10 parameters are still obtained from the calorimetric data of ��corresponding single crystals�� (Ca2SiO4 corresponding to Q0, Ca1.5SiO3.5 to Q1, CaSiO3 to Q2, Ca0.5SiO2.5 to Q3 and finally SiO2 to Q4). Here, the concept of ��corresponding single crystal�� (CSC) should be elucidated firstly. In 1975, BRAWER [28] suggested the concept of ��corresponding crystal�� to interpret the Raman spectra and structural units of silicate glasses. According to his definition, the structure of its unit cell is an average over all the structural units of glass. Mostly, those ��corresponding crystals�� are fictitious creation which may not exist in nature and whose existence may in fact be impossible. The idea of BRAWER was reformed by the present authors to define the concept of CSC, which corresponds to the minimum types of structural units in crystal with the same macro composition as the given melt. Practically, only the thermodynamic data for the real existing Ca3SiO5, Ca2SiO4, CaSiO3 and SiO2 can be found [13,29], but those for the unstable Ca1.5SiO3.5 and Ca0.5SiO2.5 lack. Fortunately, the relation of calorimetric properties of CSCs with the mole ratio of Ca to Si, just as shown in Fig. 1, is perfectly linear. Thus, the characteristic enthalpies and entropies of Ca1.5SiO3.5 and Ca0.5SiO2.5 can be reasonably and easily extrapolated from the experimental values of those stable CSCs.
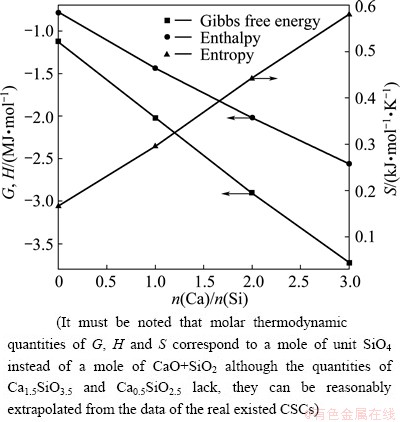
Fig. 1 Gibbs free energy, enthalpy and entropy of four real existed CSCs
It must be noted that the molar quantities of the G, H, and S in Fig. 1 correspond to a mole of unit SiO4 instead of a mole of CaO+SiO2. Here, S is not the non-configurational but the total entropy. In order to achieve the non-configurational entropy, the configurational part must be subtracted from the total. Because only one or two kinds of Qis exist in any CSC under the constraint of minimum types of structural units, the molar fraction of Qi can be directly calculated from the molar fraction of macro components. Thus, the configurational entropy can be directly calculated from Eq. (10) for all CSCs, just as shown in Fig. 2(a) and the result is displayed in Fig. 2(b). The vertical lines in Fig. 2(a) indicate the molar fractions of structural units of five CSCs with only one kind of Qi and correspond to the minimum entropies highlighted by the five circles in Fig. 2(b). Subtracting the calculated configrational entropies of CSCs from the calorimetric entropies of five CSCs, the non-configrational entropies, or says, the characteristic entropies of Qis can be achieved. Then, the final values are collected in Table 4.
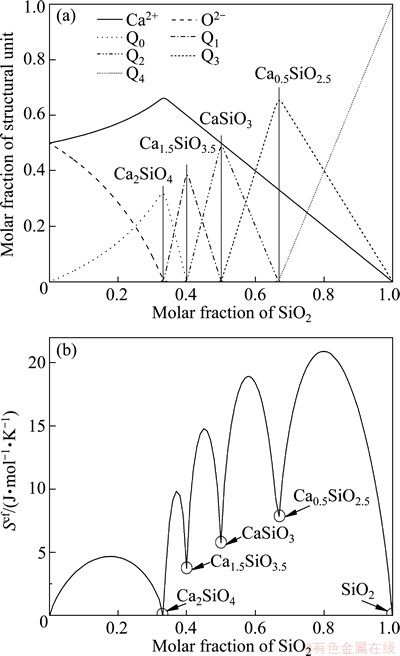
Fig. 2 Distribution of microstructural units (a) and corresponded configurational entropy (b) of CSCs for full composition range
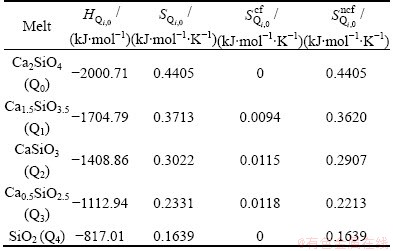
Table 4 Characteristic enthalpies and entropies at 2000 K for calcium silicate melts
Above deduction of this model implies its future utilization as the subsequent application of some structural analyzing experiments, such as Raman and NMR spectra. But the first step is to make this model self-consistent using the optimization mechanism to find the minimum of Gibbs free energy under a certain thermodynamic condition. At the same time, the relative abundance of structural units corresponding to the minimum of systematic Gibbs free energy is also automatically obtained, which is why we call the model self-consistent. From optimization theory, this optimizing process can be treated as the optimization problem under linear restrictions and resolved with the method of penalty function [30]. The express of the optimization of Gibbs free energy is
 (11)
(11)
where s.t. means satisfactory restrictions. The terms in above equation are all extended and interpreted in appendix.
3 Results and discussion
3.1 Static and statistic structural properties from MD simulation
Partial radial distribution functions (RDFs) and corresponding coordinate number functions (CNNs) of Si-O and Si-Si, which are most important for the understanding of the distribution of structural units, are presented in Fig. 3.
In these simulations, the average pair distances of Si-O, Ca-O, O-O and Si-Si are within the ranges of 1.613-1.617  , 2.350-2.356 , 2.624-2.626 and 3.170-3.194 for all six samples. WASEDA and TOGURI [31] determined the four quantities of CaSiO3 melt by X-ray diffraction, orderly 1.61 , 2.35 , 2.67 and 3.21 , and the following three quantities of SiO2, 1.62 , 2.65 and 3.12 . BELASHCHENKO et al [5] simulated the structures of alkaline earth silicate melts and obtained the quantities of 1.63 , 2.31 , 2.65 and 3.26 for molten calcium silicate. KEEN and DOVE [32] quantified the relationship between the atomic structures of the amorphous, the ordered and disordered crystalline phases of silica using neutron total scattering measurements, and gave the quantities of Si-O, O-O and Si-Si for ��-quartz, 1.609 , 2.616-2.645 and 3.059 . All of these quantities, from not only calculations but also XRD and neutron scattering, are in agreement with each other very well. Additionally, both CNNs in Fig. 3 of Si-O and Si-Si have platforms. The CNN platform of Si-O indicates the stable structural units via the corresponding y-axis value, whereas that of Si-Si reveals the connection between the units. From Fig. 3, a traditional conclusion can be achieved that the Si-O tetrahedron, which corresponds to the y-axis value of platform, i.e. 4, mainly constructs the network structure. Meanwhile, the platform of Si-Si, which can also offer the average coordinate number and consequently the degree of the systematic polymerization, becomes broader and lower with the decrease of SiO2. Pickup of the y-axis values of Si-Si platforms demonstrates a linear correlation with the molar fraction of CaO, as shown in Fig. 4. The rate of the line slope is -0.05667. If Ca is complete network modifier and Si is network former, the ideal rate should be -0.06, which is slightly lower than the simulated value. Thus, we can say that Ca plays a very strong network modifier role in the structure of silicate melt.
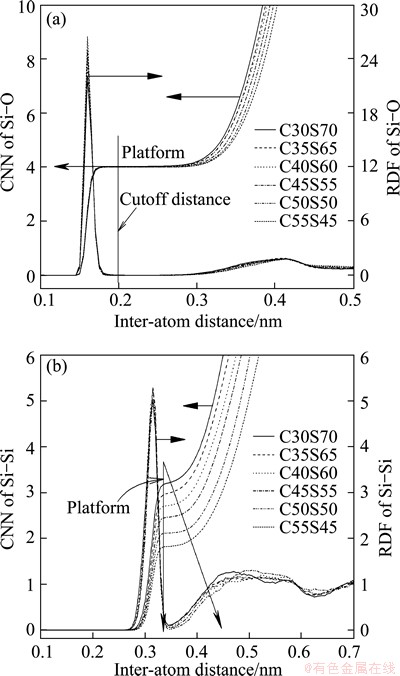
Fig. 3 RDFs and CNNs of Si-O and Si-Si from MD simulation
According to the sorting of bridging and non-bridging oxygen, Si-O can also be divided into Si-Ob and Si-Onb, where Ob and Onb denote the bridging and non-bridging oxygen. The average bond lengths of Si-Ob and Si-Onb, which is very important for the vibrational properties, are displayed in Fig. 5. It is obvious that the effect of composition on Si-Onb length is much stronger than that on Si-Ob. This character can explain the frequency-shifting phenomenon in the experimental Raman spectra.
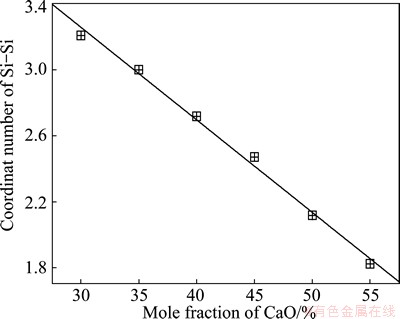
Fig. 4 Average coordinate number of Si-Si extracted from CNNs of Si-Si
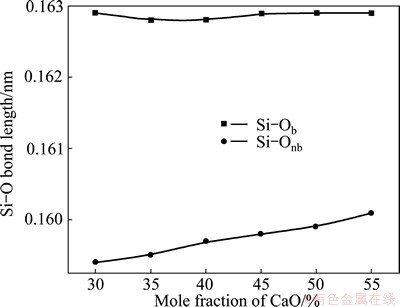
Fig. 5 Bond lengths of Si-Ob and Si-Onb from MD simulation
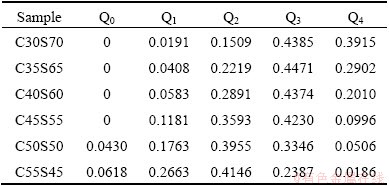
For the main purpose, the simulated equilibrium configurations are decomposed into five kinds of Si-O tetrahedral units and the concentrations are listed in Table 5. In the decomposition process, two steps were performed: the first is to search for the coordinated oxygen in the whole configuration including the images in the neighboring periodic boxes, and the next is to determine the number of bridging oxygen in each tetrahedron, which includes the judgment of bridging or non-bridging oxygen. That��s to say, a cutoff distance must be provided in order to determine whether the selected Si-O pair is bonded with each other. From Fig. 3(a), a reasonable cutoff distance, 0.2 nm, can be achieved. In fact, any value falling into the range of about 0.19-0.26 nm, which corresponds to the first minimum of pair RDF of Si-O, can be selected as the cutoff distance. By comparing with the NMR results of the alkaline silicate glasses [33], the simulated distribution of calcium silicate melts is broader but has a very similar trend. These simulated concentrations will be discussed by comparing with the results of experimental Raman spectra and our thermodynamic model later.
Table 5 Simulated concentrations of Si-O tetrahedral units (molar fraction)
3.2 Results of structural thermodynamic model and comparison of three kinds of results
One can tell that the results from both MD simulations and experiments are discrete but not continuous. Therefore, the structural thermodynamic model was constructed to give the panorama of the distribution of Qi. Figure 6(a) displays the complete distribution at 2000 K when the normalization condition is acted on the whole microstructural units,
 .
.
We can find that the free oxygen appears only in the region of XSiO2<0.33, which has been proven by various experimental and theoretical studies. Because most researchers in this and related fields are more concerned about the distribution of five Qis in the composition range of 0.33
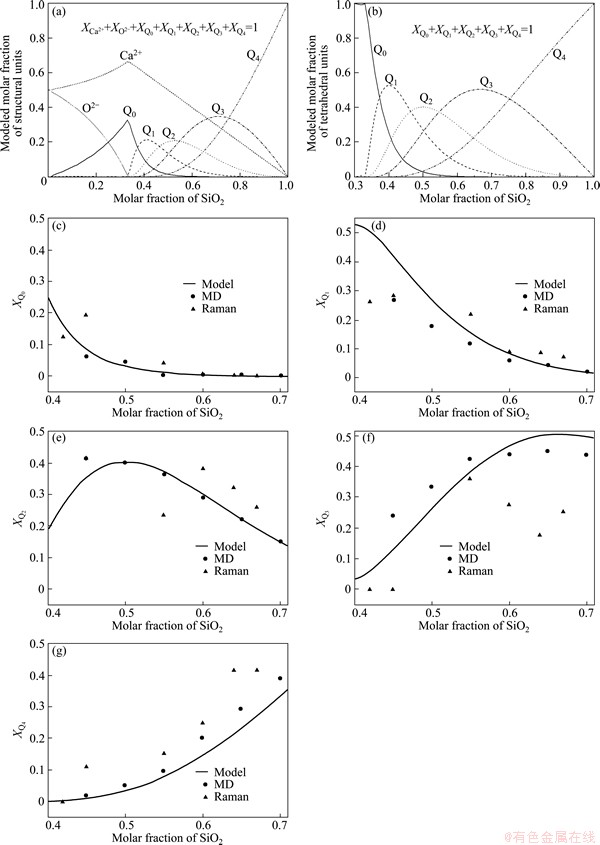
Fig. 6 Distribution of structural (tetrahedral) units from thermodynamic model, MD simulation and in-situ high-temperature Raman spectra
The original spectra [11, 22, 34] show a very clear effect of temperature and frequency on the intensity and the background radiation makes it very difficult to compare with each other. Thus, the corrected lines for temperature- and frequency-dependent scattering intensity [35] are used. All spectral lines have two envelopes located at 500-700 cm-1 and 600-1200 cm-1, respectively. Meanwhile, the series of envelopes change systematically with the calcium oxide concentration. With the increase of calcium oxide, the frequency of high-frequency envelope shifts from about 1030 to 860 cm�C1 and that of medium-frequency envelope shifts from 550 to 620 cm-1. The similar phenomenon occurs for the intensities of these two envelopes. According to our previous theoretical study of Raman spectra [22,36], the medium-frequency envelope is mainly contributed by the symmetrical bending of bridging oxygen (SBB mode) Si-Ob-Si, and for the high-frequency envelope, the symmetrical stretching (SS mode) of the Si-O bonds in tetrahedron and further analysis indicate that the contribution of stretching motion of non-bridging oxygen to SS mode is much greater than that of bridging oxygen. From the MD simulated results in Fig. 5, the bond length of Si-Onb becomes longer with the increase of CaO, but very slight change for Si-Ob. That��s to say, with the increase of CaO, the action of Si on Onb becomes weaker and consequently the red shift of high-frequency envelope occurs with the change of composition. Plenty of works have proved that the high-frequency envelope in Raman spectra is contributed by various Qi except Q4. Thus, in order to achieve the concentration of Qi, the high-frequency envelopes should be deconvolved into several single bands just overlapped with each other as follows: 810-850 cm-1 for Q0, 900-950 cm-1 for Q1, 1000-1050 cm-1 for Q2 and ~1100 cm-1 for Q3, from the reviews of McMILLAN [12] and the studies of BRAWER and WHITE [37] about the Raman shifts of silicate glasses and crystals. As for the SS mode of Q4 in the high-frequency region, its intensity is so weak that no signal for it can be detected even in the spectra of amorphous SiO2. The theoretical explanation for the frequency and intensity regulations can be found in Refs. [22,36]. From the Raman scattering theory, the area fractions under the characteristic bands do not directly represent their relative abundance. There is a factor named Raman scattering coefficient defined as follows:
 (12)
(12)
where Mi, Ai and Ci denote the molar fraction, area fraction of characteristic band of Qi and its corresponding Raman scattering coefficient, respectively. A major difficulty in computing the relative abundances of Qis from Raman spectra lies in the determination of these relative Raman scattering coefficients. In studies of alkali silicate melts, MYSEN and FRANTZ [17] used NMR data[38] in conjunction with their Raman data for sodium silicate to calculate the ratio of Raman scattering coefficients for Q3 and Q2. YOU et al [34] have also given the same ratio with the inner standard of polycrystal NaNO2 powder. In this work, we used our theoretical results of the five relative Ci [36,39]: 1.0 for Q0, 0.518 for Q1, 0.249 for Q2, 0.099 for Q3 and 0.016 for Q4, which agree very well with the experimental values of MYSEN and FRANTZ [17] and YOU et al [34]. By dividing the coefficients from Ai as shown in Eq. (12), we can obtain the relative abundance of Q0-Q3. To further achieve the abundance of Q4, the mass conservation formulated by Eq. (3) must be used. Then, after the normalization process we obtained the final molar fractions of Qi from Raman spectra as shown in Fig. 6.
The theories applied in these three kinds of methods are completely different from each other, but they achieved agreeable results. The key is the equilibrium of system. Although the Raman spectra root in the vibrations of structural units, but the system when being measured are in a macro-thermodynamic equilibrium condition, which indicates that the Gibbs free energy of system is the minimum and this condition is just the only convergence condition of the thermodynamic model. As for the MD simulation, when analyzing the distribution of units, the simulated system has been relaxed around the equilibrium state for a period of time. So, all the three methods gave a unique distribution of units under thermodynamic equilibrium and that��s to say, reached the same goal by different routes. The initial purpose to construct this thermodynamic model is to calculate the equilibrium thermodynamic properties of silicate melts with the utilization of the microstructural information obtained from spectral measurements, e.g. high-temperature Raman spectra and NMR. So, the agreement has partly proven the probability of this kind of application. Attention should be paid to a fact that this model can only be applied to the melts instead of glasses because the glasses are in the unstable state, which is not met for the basic demand of this model.
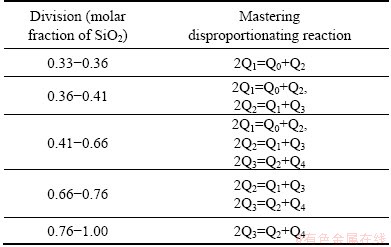
From the viewpoint of structural thermodynamics, the master of the distribution of Qi in equilibrium is so-called disproportionating reactions between different Qis:
 (13)
(13)
Farther analysis of Fig. 6(b) can achieve the following five divisions in the composition range of 0.33
Table 6 Mastering disproportionating reactions in different divisions corresponding to five divisions
3.3 Distribution of connections of Qi-Ca-Qj and Qi-[Ob]-Qj
Between the tetrahedral units, two kinds of connections are introduced denoted as Qi-Ca-Qj and Qi-[Ob]-Qj, which represent, the connection via the electrovalent bond between non-bridging oxygen Onb and cation Ca2+ and the connection via sharing bridging oxygen Ob, respectively. In fact, these connections indicate the properties of super structural units in calcium silicate melt, such as the rings, sheets, chains and disordered three-dimension network. They are also the important structural properties to influence the macro thermodynamic and dynamic properties.
In our thermodynamic model, after the achievement of distribution of Qi, we can estimate the distributions of these two kinds of connections. Because the configurational entropy is the direct quantification of these distributions, and so, we can obtain the following relations according to the equilibrium condition:
 (14)
(14)
 (15)
(15)
where Rij represents the fraction of connection of Qi-Ca-Qj and Bij is the fraction of Qi-[Ob]-Qj. Above relations are just proportional and consequently, the calculated quantities of Rij and Bij must be normalized obeying the normalization restrictions of
 and
and  .
.
The results are displayed in Fig. 7. In the past century, most attentions were paid to the so-called equivalent connections, especially the equivalent connection between the same Qi via bridging oxygen, e.g. Q4-[Ob]-Q4, Q3-[Ob]-Q3 etc. For example, most studies, e.g. Ref. [40], of the vibrational spectra of complex structural units of amorphous silicates were always concentrated to the ring, chain or sheet constructed with same kind of Qis, which indicate that all the connections in the structural cells are equivalent. These are based on an assumption that in silicate melt, equivalent connection always precedes non-equivalent connection. This assumption has never been verified but is supported for the first time by our calculation of the distribution of connections to some extent. As shown in Fig. 7, the bold lines, which figure the distribution of dominant connections, are all constructed with the equivalent connections. That��s to say, for any composition, the most dominant connection is equivalent connections. Additionally, with the reference of the distribution of Qi (Fig. 6(b)), it can be found that the compositions corresponding to the maximum of equivalent connection are different from the compositions corresponding to the maximum of the tetrahedral units: the location of maximum of Qi-Ca-Qi shifts to the right side relative to the position of the maximum of Qi and that for Qi-[Ob]-Qi shifts to the left, e.g. XSiO2(R22max)> XSiO2(XQ2max) > XSiO2 (B22max).
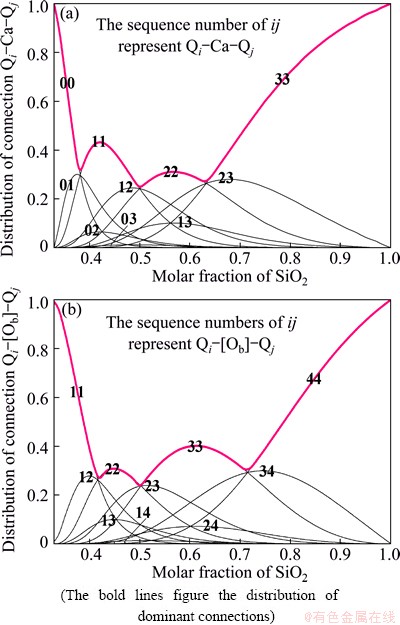
Fig. 7 Distributions of connection of Qi-Ca-Qj (a) and Qi-[Ob]-Qj (b)
4 Conclusions
In this work, two methods were applied to studing the distribution of microstructural units in CaO-SiO2 melts. Firstly, MD simulation gave the result that the average coordinate number of oxygen around silicon is very stable, 4, which indicates that the stable structural units in calcium silicate melts are different Si-O tetrahedra. Secondly, we present the deduction of a newly constructed thermodynamic model from the basic definition of microstructural units. Finally, by comparing the discrete results from MD simulation and referenced Raman spectra with the continuous result of the newly constructed thermodynamic model, we reached the same goal by different routes and obtained the panorama distribution of Qi and their connections.
Appendix
The extension and interpretation of terms in Eq. (11) are
 (16)
(16)
b=[0 0 0 0 0 0 0 -1 -1 -1 -1 -1 -1 -1]T (17)
 (18)
(18)

 (19)
(19)
 (20)
(20)
 (21)
(21)
where a is the mole ratio of CaO to SiO2, which is practically defined as the basicity of metallurgical slag. The first fourteen inequality restrictions indicate the general limits to the molar fraction, 0��Xi��1. The first two equality restrictions are the independent correlations with the macro components of {XCaO, XSiO2} and the final equality restriction is the normalizing condition.
References
[1] MATSUSHITA T, WATANABE T, HAYASHI M, MUKAI K. Thermal, optical and surface/interfacial properties of molten slag systems [J]. International Materials Reviews, 2011, 56(5-6): 287-323.
[2] FOWLER S J, SPERA F, BOHRSON W, BELKIN H E, de VIVO B. Phase equilibria constraints on the chemical and physical evolution of the campanian ignimbrite [J]. Journal of Petrology, 2007, 48(3): 459-493.
[3] DARWISH H, IBRAHIM S, GOMAA M M. Electrical and physical properties of Na2O-CaO-MgO-SiO2 glass doped with NdF3 [J]. Journal of Materials Science: Materials in Electronics, 2013, 24(3): 1028-1036.
[4] MICHOT L J, DELVILLE A, HUMBERT B, PLAZANET M, LEVITZ P. Diffusion of water in a synthetic clay with tetrahedral charges by combined neutron time-of-flight measurements and molecular dynamics simulations [J]. Journal of Physical Chemistry C, 2007, 111(27): 9818-9831.
[5] BELASHCHENKO D K, GOPENGAUZ I E, GRYTSENKO A B, OSTROVSKIJ O I. Computational study on structure of non-crystalline oxides 2MeO��SiO2 (Me=Mg, Ca, Sr, Ba, Fe) [J]. ISIJ International, 1992, 32(9): 990-997.
[6] WU Y Q, JIANG G C, YOU J L, HOU H Y, CHEN H. Coordination properties and structural units distribution of Q(T)(i) in calcium aluminosilicate melts from MD simulation [J]. Journal of Central South University of Technology, 2004, 11(1): 6-14.
[7] WU Y Q, YOU J L, JIANG G C. Molecular dynamics study of the structure of calcium aluminate melts [J]. Journal of Inorganic Materials, 2003, 18(3): 619-626.
[8] WU Y Q, HUANG S P, YOU J L, JIANG G C. Molecular dynamics of structural properties of molten CaO-SiO2 with varying composition [J]. Transactions of Nonferrous Metals Society of China, 2002, 12(6): 1218-1223.
[9] MENESES D D, ECKES M, DEL CAMPO L, SANTOS C N, VAILLS Y, ECHEGUT P. Investigation of medium range order in silicate glasses by infrared spectroscopy [J]. Vibrational Spectroscopy, 2013, 65: 50-57.
[10] WANG Z, SHU Q F, CHOU K C. Structure of CaO-B2O3-SiO2- TiO2 glasses: A Raman spectral study [J]. ISIJ International, 2011, 51(7): 1021-1027.
[11] YOU J L, JIANG G C, WEN Q, XU K D. Raman spectroscopic study of silicon-oxygen tetrahedrons microstructure in xCaSiO3 center dot LiBO2 solid solutions [J]. Spectroscopy and Spectral Analysis, 2002, 22(5): 787-789.
[12] McMILLAN P. Structural studies of silicate glasses and melts��Applications and limitations of Raman spectroscopy [J]. American Mineralogist, 1984, 69: 622-644.
[13] HILLERT M, SUNDMAN B, WANG X. An assessment of the CaO-SiO2 system [J]. Metallurgical Transactions B, 1990, 21(2): 303-312.
[14] YOKOKAWA T, NIWA K. Free energy and basicity of molten silicate solution [J]. Transactions of Japanese Institute of Metals, 1969, 10: 81-84.
[15] SHUKER R, GAMMON R W. Raman-scattering selection-rule breaking and the density of states in amorphous materials [J]. Physical Review Letters, 1970, 25(4): 222-225.
[16] BENASSI P, MAZZACURATI V, MONACO G, RUOCCO G, SIGNORELLI G. Brillouin and Raman cross sections in silicate glasses [J]. Physical Review B, 1995, 52(2): 976-981.
[17] MYSEN B O, FRANTZ J D. Silicate melts at magmatic temperatures: In-situ structure determination to 1651 ��C and effect of temperature and bulk composition on the mixing behavior of structural units [J]. Contributions to Mineralogy and Petrology, 1994, 117(1): 1-14.
[18] WOLF G H, DURBEN D J, MCMILLAN P F. High-pressure Raman spectroscopic study of sodium tetrasilicate (Na2Si4O9) glass [J]. The Journal of Chemical Physics, 1990, 93(4): 2280-2288.
[19] CLAYDEN N J, ESPOSITO S, JAYASOORIYA U A, SPRUNT J, PERNICE P. Solid state 29Si NMR and FT Raman spectroscopy of the devitrification of lithium metasilicate glass [J]. Journal of Non-Crystalline Solids, 1998, 224(1): 50-56.
[20] SCHALLER T, STEBBINS J F, WILDING M C. Cation clustering and formation of free oxide ions in sodium and potassium lanthanum silicate glasses: nuclear magnetic resonance and Raman spectroscopic findings [J]. Journal of Non-Crystalline Solids, 1999, 243(2-3): 146-157.
[21] JIANG G C, YOU J L, YU B K, HAUNG S P. Developments of high temperature Raman spectroscopic techniques [J]. Spectroscopy and Spectral Analysis, 2000, 20(2): 206-209.
[22] WU Y Q, JIANG G C, YOU J L, HOU H Y, CHEN H, XU K D. Theoretical study of the local structure and Raman spectra of CaO-SiO2 binary melts [J]. Journal of Chemical Physics, 2004, 121(16): 7883-7895.
[23] MATSUMIYA T, NOGAMI A, FUKUDA Y. Applicability of molecular dynamics to analyses of refining slags [J]. ISIJ International, 1993, 33(1): 210-217.
[24] KIEFFER J, ANGELL C A. Structural incompatibilities and liquid--liquid phase separation in molten binary silicates: A computer simulation [J]. The Journal of Chemical Physics, 1989, 90(9): 4982-4991.
[25] HOOVER W G. Canonical dynamics: Equilibrium phase-space distributions [J]. Physical Review A, 1985, 31(3): 1695-1697.
[26] REFSON K. Moldy user's manual [M]. Revision 2.26. Oxford: Department of Earth Sciences, 2001.
[27] ALLEN M P, TILDESLEY D J. Computer simulation of liquids [M]. Oxford: Clarendon Press, 1987.
[28] BRAWER S. Theory of the vibrational spectra of some network and molecular glasses [J]. Physical Review B, 1975, 11(8): 3173-3194.
[29] PELTON A, BLANDER M. Thermodynamic analysis of ordered liquid solutions by a modified quasichemical approach��Application to silicate slags [J]. Metallurgical Transactions B, 1986, 17(4): 805-815.
[30] XUE Jia-qing. Theory and methods of optimization [M]. Beijing: Press of Metallurgical Industry, 1995. (in Chinese)
[31] WASEDA Y, TOGURI J M. The structure of molten binary silicate systems CaO-SiO2 and MgO-SiO2 [J]. Metallurgical Transactions B, 1977, 8(3): 563-568.
[32] KEEN D A, DOVE M T. Local structures of amorphous and crystalline phases of silica, SiO2, by neutron total scattering [J]. Journal of Physics: Condensed Matter, 1999, 11: 9263-9273.
[33] MAEKAWA H, MAEKAWA T, KAWAMURA K, YOKOKAWA T. The structural groups of alkali silicate glasses determined from 29Si MAS-NMR [J]. Journal of Non-Crystalline Solids, 1991, 127(1): 53-64.
[34] YOU J L, JIANG G C, XU K D. High temperature Raman spectra of sodium disilicate crystal, glass and its liquid [J]. Journal of Non-Crystalline Solids, 2001, 282(1): 125-131.
[35] LONG D A. Raman spectroscopy [M]. New York: McGraw-Hill, 1977.
[36] WU Y Q, JIANG G C, YOU J L, HOU H Y, CHEN H. Raman scattering coefficients of symmetrical stretching modes of microstructural units in sodium silicate melts [J]. Acta Physica Sinica, 2005, 54(2): 961-966.
[37] BRAWER S A, WHITE W B. Raman spectroscopic investigation of the structure of silicate glasses. I. The binary alkali silicates [J]. The Journal of Chemical Physics, 1975, 63(6): 2421-2432.
[38] STEBBINS J F. Effects of temperature and composition on silicate glass structure and dynamics: Si-29 NMR results [J]. Journal of Non-Crystalline Solids, 1988, 106(1-3): 359-369.
[39] WU Y Q, YOU J L, JIANG G C, CHEN H. Theoretical study of structural and Raman spectral properties of CaSiO3 quenched from melt to glass [J]. Chinese Journal of Inorganic Chemistry, 2004, 20(2): 133-138. (in China)
[40] SITARZ M, MOZGAWA W, HANDKE M. Vibrational spectra of complex ring silicate anions��Method of recognition [J]. Journal of Molecular Structure, 1997, 404(1-3): 193-197.
����ȫ���� ����������
�Ϻ���ѧ ���Ͽ�ѧ�빤��ѧԺ���ִ�ұ��������Ʊ��ص�ʵ���ң��Ϻ� 200072
ժ Ҫ��ͨ��������Ӷ���ѧģ�⼰һ���½��Ľṹ����ѧģ�ͼ������˹��������ľ���ṹ��Ԫ��ȫ�̷ֲ����������ַ�����õ�5��SiO�������Qi�ֲ����бȽϣ�����Raman����ʵ�������бȽϣ�����Ǻϵ÷dz��á��ⲻ���������ṹ��Ԫ��ȫ�ɷַ�Χ�ڵ�ȫ���ֲ�������֤�������ǵ�ģ���ʺ�����Թ���ʵ�����ݵĺ�������ѧ���㡣���ͬʱ���ɲ�ͬ�绯��Ӧ���Ƶ�5���ɷ�����Ҳ����ȷ���֡����Ӹýṹ����ѧģ�����״λ����Qi֮����������ӷ�ʽQi-Ca-Qj��Qi-[Ob]-Qj�ķֲ���������ɴ�֤�����гɷ��ж����Եȼ�����Ϊ��Ҫ�����ӷ�ʽ��
�ؼ��ʣ��۽ṹ��Ԫ�ֲ������Ӷ���ѧģ�⣻�ṹ����ѧģ�ͣ����������
(Edited by Hua YANG)
Foundation item: Project (2012CB722805) supported by the National Basic Research Program of China; Projects (50504010, 50974083, 51174131, 51374141) supported by the National Natural Science Foundation of China; Project (50774112) supported by the Joint Fund of NSFC and Baosteel, China; Project (07QA4021) supported by the Shanghai ��Phosphor�� Science Foundation, China
Corresponding author: Yong-quan WU; Tel: +86-21-56332144; E-mail: yqwu@shu.edu.cn
DOI: 10.1016/S1003-6326(14)63217-9

