Trans. Nonferrous Met. Soc. China 30(2020) 1071-1077
Meso-damage evolution and mechanical characteristics of low-porosity sedimentary rocks under uniaxial compression
Jian-hua HU, Dong-jie YANG
School of Resources and Safety Engineering, Central South University, Changsha 410083, China
Received 17 May 2019; accepted 28 December 2019
Abstract: Low pore sedimentary rocks (from Guangxi, China) were subjected to uniaxial compression loading experiment under different initial stresses. The rock samples were investigated by nuclear magnetic resonance before and after the loading. The relationships between the mesoscopic rock damage and macroscopic mechanical parameters were established, and the initial damage stress of the low-porosity sedimentary rock was determined. The results showed that this type of rock has the initial stress of damage. When the initial loading stress is lower than the initial stress of damage, the T2 spectrum area of the rock sample gradually decreases, and the primary pores of the rock are further closed under the stress. The range of the initial stress of damage for this type of rock is 8-16 MPa. When the loading stress exceeds the initial stress of damage, the T2 spectrum area gradually increases, indicating that the porosity of the rock increases and microscopic damage of the rock appears. The rock damage degree is defined, and the nonlinear function between the rock damage degree and the initial loading stress is established.
Key words: uniaxial compressive strength; porosity; T2 spectrum area; rock damage degree
1 Introduction
Rocks are regarded as heterogeneous porous materials with a large number of randomly distributed natural defects including micro-pores, cracks, and discontinuities [1]. Under the action of external loading, the micro-pores in the rock constantly change, which may lead to fractures in some areas and the formation of macroscopic cracks, leading to instability failure of the rock [2]. The process of rock damage evolution and the damage law had been extensively researched by physical experiments and numerical simulations. LUONG [3] used infrared imaging technology to investigate the thermal phenomena accompanying the process of rock fracture. The thermal energy released from the internal damage was taken as the research parameter, and the damage process and failure mechanism based on the force-thermal coupling process were analyzed. BAGDE and PETROS [4] used the MTS816 rock mechanics test system to study the effect of static and dynamic cyclic uniaxial loads on the mechanical properties and damage of the sandstone. The results showed that the fatigue strength of rock was positively correlated with the dynamic loading frequency and negatively correlated with the dynamic loading amplitude. MARTIN and CHANDLER [5,6] studied the crack evolution process of granite based on the stress�Cstrain characteristics. The results showed that with the cyclic loading and unloading of granite, the initial stress of the damage was not related to the increase in the damage and the damage stress gradually decreased until finally approaching the crack initiation stress. DIEDERICHS [7] argued that the sharp decrease in rock stiffness was due to the reduction in damage stress. Similarly, the irreversible volume strain inside the rock is also believed to be closely related to the development of the damage in rock [8]. BAGDE and PETROS [9] studied the effects of the amplitude and frequency of uniaxial cyclic loading on the strength degradation and deformation behavior of rocks. Meanwhile, the effects of microstructure, structure and quartz content in rock samples on the fatigue strength and cyclic dynamic response were also studied, indicating that micro-fracture was the main cause of fatigue failure. BASTIAN et al [10] conducted uniaxial and triaxial cyclic compression tests on Hawkesbury sandstone and studied its mechanical properties under cyclic loading. YIN et al [11] carried out static mechanical experiments on granite at different temperatures and the results showed that the failure modes of granite before and after the high temperature treatment were significantly different. SENGUN [12] investigated the effect of thermal damage on the physical and mechanical properties of carbonate rocks, suggesting that at 600 ��C, the bulk density, uniaxial compressive strength, elastic modulus and the shore hardness were all reduced but the apparent porosity increased. TAHERI et al [13] studied the changes in the mechanical properties of Hawkesbury sandstone under different cyclic loading conditions using uniaxial and triaxial compression tests, revealing that the unstable crack growth appeared at about 65% of the accumulated axial strain. ZHAO et al [14] used physical models and acoustic emission technology to study the fracture evolution process of brittle rocks with prefabricated circular pores under uniaxial compression and they proposed that the tensile and compressive stresses were the key factors causing the fracture of samples with circular pores. DRAGON et al [15] developed a continuous damage model and studied the coupling problem between the plasticity and damage caused by crack friction. CHANG and LEE [16] studied the mechanism of rock fracture damage by acoustic emission moment tensor analysis under triaxial compression and discussed the effect of micro-crack accumulation on rock micro-damage. LEMAITRE [17] and CHABOCHE [18] derived the damage variable from the stress�Cstrain characteristics of the damaged material. They believed that the effective damage variable could be understood as the variable obtained from the undamaged part under the action of the same stress on the damaged part. LI et al [19] studied the damage evolution characteristics of the pore structure of sandstone after 180 freeze�Cthaw cycles by nuclear magnetic resonance (NMR). Concrete failure has been significantly emphasized in literatures for brittle, or quasi-brittle materials such as rock; however, these results fail to reflect the evolution process of initiation, propagation and transfixion of internal cracks during rock fracture and instability. In addition, the effect of rock porosity changes on mesoscopic damage is rarely studied.
Conventional uniaxial rock experiments under different initial loading stresses were carried out. The porosity and T2 spectrum area of rock samples before and after loading were measured by NMR. Quantitative parameters of rock pore change were obtained. The degree of the rock damage caused by different initial loading stresses was investigated by the residual peak strength of the rock samples, and a theoretical model of meso-damage evolution of rock under uniaxial compression was established.
2 Experimental
2.1 Sample preparation
The rock used in this study was siliceous limestone with a diameter of 54 mm and a length of approximately in the range of 150-400 mm. The samples conformed to the requirement of the 2.0-2.5 ratio recommended by the International Society for Rock Mechanics. To reduce the difference between the rock samples and the effect of rock anisotropy on the experiment, cores were selected from the same core box for the sample preparation [20]. Figure 1 shows the representative rock samples used in this study.
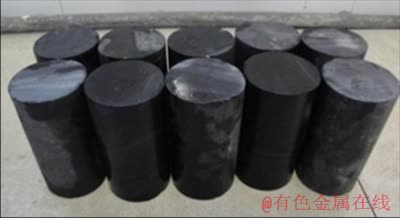
Fig. 1 Representative rock samples used in this study
2.2 Experimental facility
The main test instruments used in this experiment were a servo-controlled testing machine system (Instron 1342, with 2000 kN capacity), a rotary vane vacuum saturation device, and a nuclear magnetic resonance instrument (Shanghai Newmark Technology Co. Ltd.).
2.3 Experimental method
In this experiment, six groups (A, B, C, D, E, and F) were formed, with three rock samples of siliceous limestone in each group. The main steps of the experiment were as follows:
(1) The six sets of rock samples were vacuumed and saturated using a rock vacuuming device. Dry vacuum pumping was done for 240 min, followed by wet pumping for 120 min to ensure complete water saturation in each of the rock samples.
(2) The initial porosity and initial T2 spectrum area of the saturated rock were measured by NMR, as shown in Fig. 2.
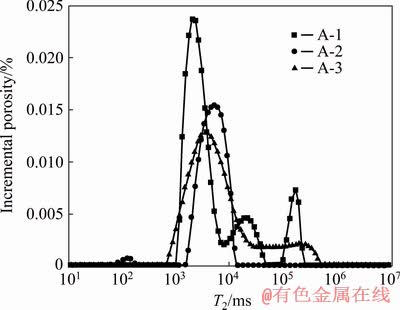
Fig. 2 Pore distributions of Group A rock samples
(3) Group A samples were tested using an Instron 1342-2000 kN type electro-hydraulic servo testing machine. The specimens were subjected to uniaxial loading, followed by measuring the uniaxial compressive strength of the Group A. Figure 3 shows the complete stress�Cstrain curves. Other groups of rock specimens B, C, D, E and F were subjected to loading of 10%, 20%, 40%, 60%, and 80% of the initial uniaxial compressive stresses (��c), respectively, which did not cause failure of rock.
(4) Steps 1 and 2 were repeated to carry out saturated water experiments on the rock samples in Groups B, C, D, E and F and measure the porosity and T2 spectrum of the loaded samples.
(5) Finally, the rock samples in Groups B, C, D, E and F were subjected to the secondary uniaxial loading test to obtain the residual peak strength of the rock and study the relationship between the microscopic rock damage and porosity.
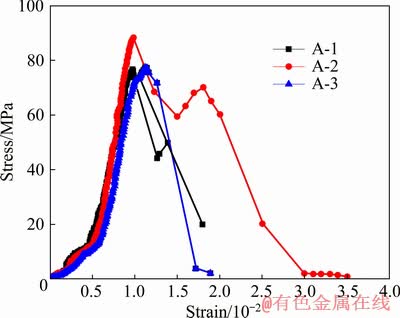
Fig. 3 Stress�Cstrain curves of Group A rock samples
3 Results and discussion
3.1 Effects of different initial loading stresses on porosity
The uniaxial peak compressive strength of Group A rock samples is 76.4, 87.9 and 77.4 MPa, with an average of 80.6 MPa. For the convenience of calculation, the uniaxial peak compressive strength of rock is considered to be 80 MPa. The changes in the initial loading stress and porosity are given in Table 1, where the initial loading stress of the rock samples in Groups B and C is 10%��c (8 MPa) and 20%��c (16 MPa), respectively. Based on the individual differences, the rock samples show compressibility on the whole. The porosities of Groups D, E, and F increase when the initial loading stress is 40%��c, 60%��c, and 80%��c, respectively. The rock is in the stage of fracture generation and propagation, and porosity increases with increasing of initial loading stress.
Table 1 Changes in porosity under different initial loading stresses
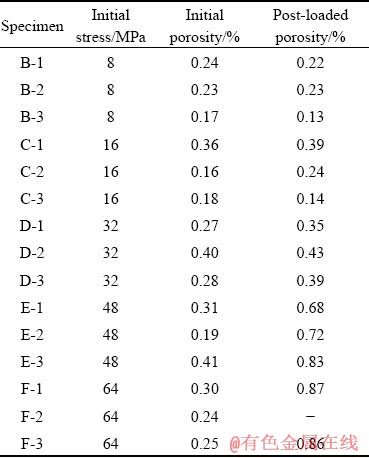
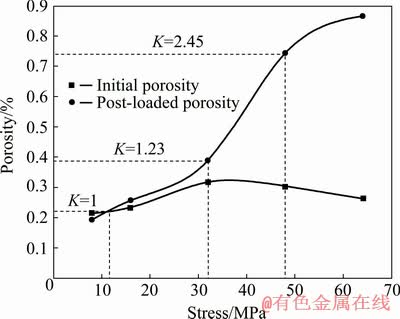
Fig. 4 Porosity variation curves of siliceous limestone with different initial loading stresses
Figure 4 shows the porosity change curves of samples with different initial loading stresses. The whole curve can be divided into three stages: initial slow growth, rapid growth, and slow growth. When the initial loading stress increases to 32 MPa, the curve is a straight line, and the slope remains basically unchanged, showing initial slow growth stage of rock porosity. From 32 to 48 MPa, the slope of the curve increases, which represents the rapid growth stage of porosity in the rock. When the loading stress exceeds 48 MPa, the slope of the curve remains essentially unchanged, which means the curve mainly is in the slow growth stage and the fracture shifts into the penetrating stage. In order to quantitatively study the relationship between the initial loading conditions and porosity, the porosity ratio is defined as the evaluation standard:
 (1)
(1)
where ��1 is the average porosity before loading, and ��2 is the average porosity after loading. When K<1, the rock sample is in the stage of microfracture compaction; when K=1, the rock sample is in the critical state of microfracture compaction and occurrence; when K>1, the rock sample is in the stage of fracture occurrence and expansion until failure.
A comparative analysis of the experimental porosity data obtained from uniaxial loading of such rocks indicates that (1) When K=1, i.e., when the initial stress is in the range 8-16 MPa, the rock is in the critical state of microfracture compaction. This is to say, the critical state of fracture expansion is when the compressive strength reaches (10%-20%)��c. (2) When the initial loading stress reaches (40%-60%)��c of the uniaxial compressive strength of the rock, i.e., 1.23c and K>2.45, i.e., the stress exceeds 48 MPa, the micro-cracks gradually break through to form macroscopic cracks until rock failure.
The initial stress of the rock critical crack expansion is determined to be (10%-20%)��c of the uniaxial compressive strength, and the initial stress value of rock damage is in the range of 8-16 MPa.
Figure 5 shows the relationship between the porosity increment ratio and external loading stress of siliceous limestone. The relation between the external loading stress and pore increment ratio can be obtained by exponential function fitting. As shown in Fig. 5, when the external loading stress is in the range of 50-70 MPa, the internal porosity of the siliceous limestone slightly changes, which means that the rock is basically destroyed after this.
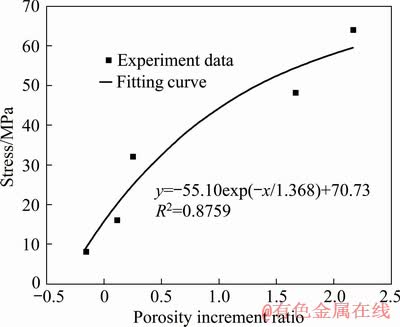
Fig. 5 Relationship between porosity increment ratio and external loading stress of siliceous limestone
3.2 Degree of rock damage
As the initial loading stress increases, the secondary peak strength of the rock continues to decrease, which means that the rock damage degree continues to increase [21]. This process can be defined by
 (2)
(2)
where D is the damage degree, and ��i is the second peak strength.
After each group of samples was loaded with different initial loading stresses, the changes in the secondary peak strength obtained from rock samples and their damage degrees are given in Table 2.
Table 2 Secondary peak strength and damage degree of rock samples with different initial loading stresses
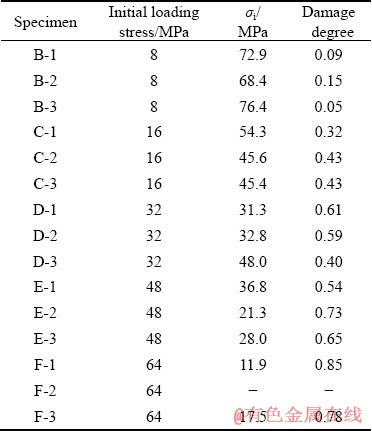
Figure 6 shows the relationship between the initial loading stress and the average damage degree. With increasing initial loading stress, the average damage degree of the rock increases. When the initial loading stress changes in the range of 8-16, 16-32, 32-48 and 48-64 MPa, the increment in the average damage degree is 0.3, 0.14, 0.11 and 0.17, respectively. Therefore, the increase rate of average damage degree is the largest when the initial loading stress is less than 16 MPa, and it becomes small when the initial loading stress is in the range of 16-48 MPa and large when the initial loading stress is more than 48 MPa. The damage degree of rock caused by different initial loading stresses can be calculated by fitting the data in Fig. 6.
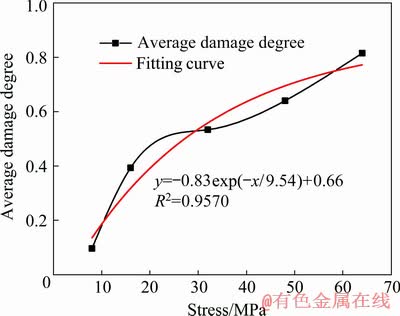
Fig. 6 Relationship between initial loading stress and average damage degree
Figure 7 shows the fitting relationship between the average damage degree of rock samples and porosity increment ratio. It is shown that the increment in porosity is negative at the initial stage, which means that the original pores of rock are closed to varying degrees due to the rock compressed, and the external force is not enough to generate new pores. However, there is a low-stress microscopic damage in the rock. When the rock is subjected to the initial loading stress, its compressive strength decreases with the increasing trend of porosity; when the porosity increment ratio increases to approximately 0.8, the damage degree of the rock begins to increase slowly while the rock is in the elastic deformation stage, and the porosity increment ratio continues to increase until the rock is destroyed.
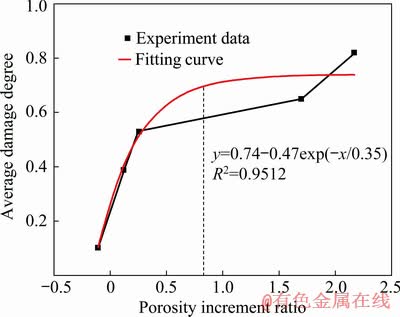
Fig. 7 Relationship between rock damage degree and porosity increment ratio
3.3 Relationship between initial loading stress and T2 spectrum area
The relationship between initial loading stress and T2 spectrum area is established from the data, as listed in Table 3. When the initial loading stress is 8 MPa, the increase rate of the T2 spectrum area after loading is negative, and the rock is in the compaction stage. When the initial loading stress is 16 MPa, the increase rate of the T2 spectrum area after loading is positive and negative, which indicates that the rock is in the stage of continuous compaction and new fractures form at the same time. When the initial loading stress is 32, 48 and 64 MPa, the increase rates of the T2 spectrum area after loading are positive. The change in T2 spectrum area is basically consistent with the change in porosity, indicating that the T2 spectrum area is a reliable parameter for characterizing the rock damage.
Table 3 Effect of different loading stresses on T2 spectrum area
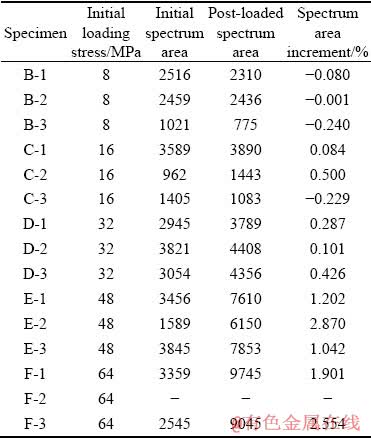
Figure 8 shows the relationship between different initial loading stress and the increment of the T2 spectrum area. As shown in Fig. 8, when the stress is up to about 15 MPa, the increment of T2 spectrum area is 0. The pores inside the rock will be compacted when the stress is smaller than 15 MPa; as the stress gradually increases beyond 15 MPa, the new micro-cracks begin to expand, and the porosity gradually increases. The relationship between the T2 spectrum area and loading stress is consistent with the relationship between the porosity increment and loading stress.
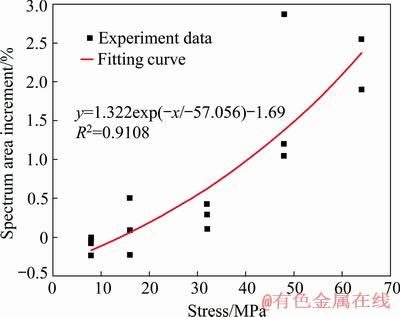
Fig. 8 Relationship between initial loading stress and T2 spectrum area increment
4 Conclusions
(1) Low-porosity sedimentary rocks have an initial stress of damage. When the loading stress is lower than the initial damage stress, the T2 spectrum area of the rock gradually decreases, which indicates that the natural pore is further compacted. It is shown that the initial damage stress of low-porosity sedimentary rock is in the range of 8-16 MPa.
(2) For this type of siliceous limestone, when the external load exceeds the initial damage stress, the porosity of the rock gradually increases and the meso-damage of the rock begins to develop. However, with the initial stress increasing, the process of porosity change has three stages, namely the slow growth stage, the rapid growth stage and the sluggish growth stage.
(3) The degree of rock damage shows a non-linear relationship with the initial loading stress. In addition, the relationship between the increment of porosity and the initial loading stress is in an exponential form.
References
[1] SHANG J, WEST L J, HENCHER S R, ZHAO Z. Geological discontinuity persistence: Implications and quantification [J]. Engineering Geology, 2018, 241: 41-54.
[2] ALIYU M M, SHANG J, MURPHY W, LAWRENCE J A, COLLIER R, KONG F, ZHAO Z. Assessing the uniaxial compressive strength of extremely hard cryptocrystalline flint [J]. International Journal of Rock Mechanics and Mining Science, 2019, 113: 310-321.
[3] LUONG M P. Infrared thermovision of damage processes in concrete and rock [J]. Engineering Fracture Mechanics, 1990, 35: 291-301.
[4] BAGDE M N, PETROS V. Fatigue properties of intact sandstone samples subjected to dynamic uniaxial cyclical loading [J]. International Journal of Rock Mechanics and Mining Sciences, 2005, 42: 237-250.
[5] MARTIN C D, CHANDLER N A. The progressive fracture of lac du bonnet granite [J]. International Journal of Rock Mechanics and Mining Science & Geomechanics Abstracts, 1994, 31: 643-659.
[6] MARTIN C D. Seventeenth Canadian geotechnical colloquium: The effect of cohesion loss and stress path on brittle rock strength [J]. Canadian Geotechnical Journal, 1997, 34: 698-725.
[7] DIEDERICHS M S. Manuel Rocha medal recipient rock fracture and collapse under low confinement conditions [J]. Rock Mechanics and Rock Engineering, 2003, 36: 339-381.
[8] SU K, GHOREYCHI M, CHANCHOLE S. Experimental study of damage in granite [J]. Geo Technique, 2000, 50: 235-241.
[9] BAGDE M N, PETROS V. Fatigue and dynamic energy behaviour of rock subjected to cyclical loading [J]. International Journal of Rock Mechanics and Mining Sciences, 2009, 46: 200-209.
[10] BASTIAN T, CONNELLY B, LAZO OLIVARES C, YFANTIDIS N, TAHERI A. Progressive damage of Hawkesbury sandstone subjected to systematic cyclic loading [J]. Journal of Research Projects Review, 2014, 3: 7-14.
[11] YIN Tu-bing, SHU Rong-hua, LI Xi-bing, WANG Pin, LIU Xi-ling. Comparison of mechanical properties in high temperature and thermal treatment granite [J]. Transactions of Nonferrous Metals Society of China, 2016, 26: 1926-1937.
[12] SENGUN N. Influence of thermal damage on the physical and mechanical properties of carbonate rocks [J]. Arabian Journal of Geosciences, 2014, 7: 5543-5551.
[13] TAHERI A, YFATIDIS N, OLIVARES C, OLIVARES C L, CONNELLY B J, BASTIAN T J. Experimental study on degradation of mechanical properties of sandstone under different cyclic loadings [J]. Geotechnical Testing Journal, 2016, 39: 673-687.
[14] ZHAO Xing-dong, ZHANG Hong-xun, ZHU Wan-cheng. Fracture evolution around pre-existing cylindrical cavities in brittle rocks under uniaxial compression [J]. Transactions of Nonferrous Metals Society of China, 2014, 24: 806-815.
[15] DRAGON A, HALM D, DESOYER T. Anisotropic damage in quasi-brittle solids: Modeling, computational issues and applications [J]. Computer Methods in Applied Mechanics and Engineering, 2000, 183: 331-352.
[16] CHANG S H, LEE C I. Estimation of cracking and damage mechanisms in rock under triaxial compression by moment tensor analysis of acoustic emission [J]. International Journal of Rock Mechanics and Mining Sciences, 2004, 41: 1069-1086.
[17] LEMAITRE J. A continuous damage mechanics model for ductile fracture [J]. Journal of Engineering Materials and Technology, 1983, 107: 83-89.
[18] CHABOCHE J L. Continuous damage mechanics-A tool to describe phenomena before crack initiation [J]. Nuclear Engineering and Design, 1981, 64: 233-247.
[19] LI Jie-lin, ZHOU Ke-ping, LIU Wei-jie, DENG Hong-wei. NMR research on deterioration characteristics of microscopic structure of sandstones in freeze-thaw cycles [J]. Transactions of Nonferrous Metals Society of China, 2016, 26: 2997-3003.
[20] BIENIAWSKI Z T, BERNEDE M J. Suggested methods for determining the uniaxial compressive strength and deformability of the rock materials: Part 1. Suggested method for determining deformability of rock materials in uniaxial compression [J]. International Journal of Rock Mechanics and Mining Sciences & Geomechanics Abstracts, 1979, 16: 138-140.
[21] SHANG Jun-long, HU Jian-hua, ZHOU Ke-ping, LUO Xian-wei, ALIYU M M. Porosity increment and strength degradation of low-porosity sedimentary rocks under different loading conditions [J]. International Journal of Rock Mechanics and Mining Sciences, 2015, 75: 216-223.
��������µͿ�϶�����ҵ�ϸ�������ݻ�������ֵ
�����������
���ϴ�ѧ ��Դ�밲ȫ����ѧԺ����ɳ 410083
ժ Ҫ���Թ��������Ϳ�϶������Ϊ�����ڲ�ͬ��ʼ����Ӧ�����������Ͻ�����ʯ����ѹ��ʵ�飬���ú˴Ź��������ʯ��������ǰ��ı仯������ϸ������������ѧ���������Ĺ����������о����������������ʯ�������˵�Ӧ����ʼֵ���ڳ�ʼ����Ӧ�����ڸó�ʼֵʱ����ʯ������T2��������٣���ʯԭ����϶��Ӧ�������½�һ���ܱգ�������ʯ���˵�Ӧ����ʼֵ��ΧΪ8~16 MPa����ʯ������س�������Ӧ����ʼֵ����ʯ������T2����������ӣ�����ʯ�Ŀ�϶���ӣ�������ʯϸ�����˿�ʼ��չ��������ʯ�����˶ȣ�������ʯ�����˶����ʼ����Ӧ���ķ����Ժ�����ϵ��
�ؼ��ʣ����Όѹǿ�ȣ���϶�ȣ�T2����������˳̶�
(Edited by Bing YANG)
Foundation item: Project (41672298) supported by the National Natural Science Foundation of China
Corresponding author: Dong-jie YANG; Tel: +86-18684911183; E-mail: yangdjxx@csu.edu.cn
DOI: 10.1016/S1003-6326(20)65278-5

