�����Ѷ�Al-25Zn-3Cu��Al-25Zn-3Cu-3Si�Ͻ�Ľṹ����ѧ��Ħ��ѧ��ʴ���ܵ�Ӱ��
��Դ�ڿ����й���ɫ����ѧ��(Ӣ�İ�)2020���2��
�������ߣ�Ali PaSa HEKIMOGLU Merve CALIS
����ҳ�룺303 - 317
�ؼ��ʣ�Al-Zn-Cu�Ͻ���̬����֯����������ʴ�����ѣ�Ħ��ĥ����������ѧ����
Key words��Al-Zn-Cu alloy; as-cast microstructure; characterization; corrosion; fracture; friction and wear characteristics; mechanical properties
ժ Ҫ��Ϊ���о�����ϸ�����¿�����Al-25Zn-3Cu���Ͻ����ܵ�Ӱ�죬���ý��������취�Ʊ�Al-25Zn-3Cu��Al-25Zn-3Cu-0.01Ti��Al-25Zn-3Cu-3Si ��Al-25Zn-3Cu-3Si-0.01Ti�Ͻ���ɨ��羵(SEM)�۲�Ͻ������֯���ֱ��ò���Ӳ�ȷ�����������ⶨ�Ͻ��Ӳ�Ⱥ���ѧ���ܣ�������ʽĦ��������о��Ͻ��Ħ��ѧ���ԣ��õ绯ѧ��ʴʵ��װ���о��Ͻ�ĸ�ʴ���ܡ������ʾ��A1-25Zn-3Cu ��Ԫ�Ͻ������֯���Ц�����+�Ǻͦ� (Al2Cu) �ࡣ����3%Si(��������)��A1-25Zn-3Cu�Ͻ�����֯���γɹ����������0.01%Ti(��������)��Al-25Zn-3Cu ��Al-25Zn-3Cu-3Si�Ͻ�ľ����ߴ�ֱ��СԼ20%��39%��Ӳ�ȷֱ��HRB 130��HRB 141���ӵ�HRB 137��HRB 156���Ͻ������ǿ�ȷֱ��278 MPa��320 MPa���ӵ�297 MPa��336 MPa������ǿ�ȷֱ��317 MPa��334 MPa���ӵ�340 MPa��352 MPa�������Ѻ��������ӣ��Ͻ����ĥ����ߣ�����ʴ�Խ��͡�
Abstract: To investigate the effect of grain refinement on the material properties of recently developed Al-25Zn-3Cu based alloys, Al-25Zn-3Cu, Al-25Zn-3Cu-0.01Ti, Al-25Zn-3Cu-3Si and Al-25Zn-3Cu-3Si-0.01Ti alloys were produced by permanent mold casting method. Microstructures of the alloys were examined by SEM. Hardness and mechanical properties of the alloys were determined by Brinell method and tensile tests, respectively. Tribological characteristics of the alloys were investigated by a ball-on-disc type test machine. Corrosion properties of the alloys were examined by an electrochemical corrosion experimental setup. It was observed that microstructure of the ternary A1-25Zn-3Cu alloy consisted of ��, ��+�� and �� (Al2Cu) phases. It was also observed that the addition of 3 wt.% Si to A1-25Zn-3Cu alloy resulted in the formation of silicon particles in its microstructure. The addition of 0.01 wt.% Ti to the Al-25Zn-3Cu and Al-25Zn-3Cu-3Si alloys caused a decrement in grain size by approximately 20% and 39% and an increment in hardness from HRB 130 to 137 and from HRB 141 to 156, respectively. Yield strengths of these alloys increased from 278 to 297 MPa and from 320 to 336 MPa while their tensile strengths increased from 317 to 340 MPa and from 334 to 352 MPa. Wear resistance of the alloys increased, but corrosion resistance decreased with titanium addition.
Trans. Nonferrous Met. Soc. China 30(2020) 303-317
Ali PaSa HEKIMOGLU, Merve CALIS
Mechanical Engineering Department, Engineering Faculty, Recep Tayyip ErdoGan University, Rize 53100, Turkey
Received 23 May 2019; accepted 10 January 2020
Abstract: To investigate the effect of grain refinement on the material properties of recently developed Al-25Zn-3Cu based alloys, Al-25Zn-3Cu, Al-25Zn-3Cu-0.01Ti, Al-25Zn-3Cu-3Si and Al-25Zn-3Cu-3Si-0.01Ti alloys were produced by permanent mold casting method. Microstructures of the alloys were examined by SEM. Hardness and mechanical properties of the alloys were determined by Brinell method and tensile tests, respectively. Tribological characteristics of the alloys were investigated by a ball-on-disc type test machine. Corrosion properties of the alloys were examined by an electrochemical corrosion experimental setup. It was observed that microstructure of the ternary A1-25Zn-3Cu alloy consisted of ��, ��+�� and �� (Al2Cu) phases. It was also observed that the addition of 3 wt.% Si to A1-25Zn-3Cu alloy resulted in the formation of silicon particles in its microstructure. The addition of 0.01 wt.% Ti to the Al-25Zn-3Cu and Al-25Zn-3Cu-3Si alloys caused a decrement in grain size by approximately 20% and 39% and an increment in hardness from HRB 130 to 137 and from HRB 141 to 156, respectively. Yield strengths of these alloys increased from 278 to 297 MPa and from 320 to 336 MPa while their tensile strengths increased from 317 to 340 MPa and from 334 to 352 MPa. Wear resistance of the alloys increased, but corrosion resistance decreased with titanium addition.
Key words: Al-Zn-Cu alloy; as-cast microstructure; characterization; corrosion; fracture; friction and wear characteristics; mechanical properties
1 Introduction
A series of zinc (Zn)-aluminum (Al) based alloys have been developed in order to replace the high density and expensive traditional alloys such as bronze, brass and cast iron used in engineering applications [1]. Among these alloys, Zamak, ZA and ALZEN series are commercialized and used successfully in some industrial applications [2,3]. Detailed research and development studies have shown that Zn-Al based alloys have the lower density, higher specific strength, wear resistance, and corrosion resistance compared to traditional alloys [4-8]. In addition to these advantages, because of their low melting point, their productions are easy and the casting costs are low. However, despite these advantages, Zn-Al based alloys are known to have some disadvantages. The main disadvantages of these alloys are inadequate hardness and mechanical strength for some applications and lower operating temperature due to their low melting points [9]. Some studies have been made on eliminating their disadvantages by increasing the aluminum content of Zn-Al based alloys and/or adding alloying elements [6,10-12]. These studies showed that the usage temperature is increased and the hardness and mechanical properties are improved, as the aluminum content increases in the Zn-Al alloys. Research studies have also shown that the specific strength of Zn-Al alloys increases with increasing aluminum content.
Due to the positive effect of high aluminum content on the mechanical properties of Zn-Al alloys, recent studies have focused on Al-Zn based alloys containing more than 50 wt.% aluminum [11-16]. These studies have shown that the Al-Zn alloys containing 70%-80% aluminum have the highest strength and specific strength among the binary Al-Zn alloys [11,12]. In addition to high aluminum content, the hardness and strength values of binary Al-Zn alloys have been found to be increased even further with the addition of copper, silicon and titanium [14,17-21]. The improvement obtained in the mechanical properties of Al-Zn alloys by the addition of copper and silicon was explained in terms of solid solution and dispersion hardening mechanisms [11,12]. The increase in the hardness and strength of these alloys caused by the addition of titanium was related to the mechanism of grain refinement [20,21]. Recent studies [12,14,20,21] on the high aluminum containing Al-Zn alloys have resulted in the development of Al-25Zn-3Cu, Al-25Zn-3Cu-3Si and Al-25Zn-0.01Ti alloys having superior mechanical properties. Detailed information on the structural, mechanical and tribological properties of these alloys is available in the literatures [11,12,14]. However, less work has been carried out to investigate the effect of grain refinement on the structural, mechanical, tribological and corrosion properties of the Al-25Zn-3Cu and Al-25Zn- 3Cu-3Si alloys. Therefore, the aim of this study is to determine the effects of grain refinement caused by titanium addition on the structural, mechanical, tribological and corrosion properties of Al-25Zn- 3Cu and Al-25Zn-3Cu-3Si alloys.
2 Experimental
2.1 Alloy preparation and microstructure
The Al-25Zn-3Cu (Alloy A), Al-25Zn- 3Cu-0.01Ti (Alloy B), Al-25Zn-3Cu-3Si (Alloy C) and Al-25Zn-3Cu-3Si-0.01Ti (Alloy D) alloys were produced by using commercially pure aluminum (99.8 wt.%), high purity zinc (99.9 wt.%) and silicon (99.9 wt.%). Copper and titanium additions were made using Al-50Cu and Al-10Ti master alloys, respectively. Titanium addition level (0.01 wt.%) was determined by taking into consideration the previous studies [18,20,21] on structural and mechanical properties of Al-Zn-Ti alloys. The alloys were melted in an induction- melting furnace with medium frequency and poured into SAE 8620 steel mold at temperature of approximately 700 ��C. The castings of the alloys were carried out in room conditions. Figure 1 shows a technical drawing of the mold used for casting of the alloys. Chemical compositions of the produced alloys were verified by inductively coupled plasma-optical emission spectrometry (ICP-OES) technique.
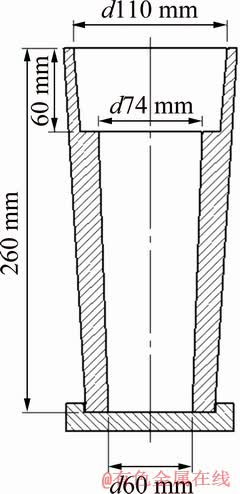
Fig. 1 Technical drawing of mold used in castings
Metallographic samples were polished with standard metallographic techniques, etched with 3% sodium hydroxide solution, and examined by SEM. SEM examinations were carried out using backscatter electron imaging mode at an accelerating voltage of 15 kV. The phases present in the microstructure of the alloys were identified by metallographic observations, energy dispersive spectroscopy (EDS) and X-ray diffraction (XRD) method. These analyses were performed at 30��-80�� scan range using a Cu K�� radiation source with a scan rate of 3 (��)/min on flat samples and a wavelength of 1.54059  . The grain sizes of the alloys were measured using the linear intersection method on photographs taken in backscatter electron mode according to ASTM E112-10 standard. For each alloy, the average of the grain size value obtained with at least one hundred measurements in different sections was given as grain size.
2.2 Mechanical tests
The hardness of the experimental alloys was determined by Brinell hardness measurement method by using a load of 612.5 N and a ball with the diameter of 2.5 mm. The hardness value of each alloy was determined by averaging at least fifteen measurements. Tensile tests were carried out with the specimens having the gauge length of 8 mm �� 40 mm at a strain rate of 10-3 s-1. At least six tensile tests were carried out for each alloy and the yield and tensile strengths, and elongation to fracture were determined by taking the average of the test results. By using the data obtained from these tests, the quality indexes of the alloys were calculated with Eq. (1) [22,23]:
Q=��b+k1lg �� (1)
where Q is the quality index, ��b is the tensile strength (MPa), �� is the elongation to fracture value (%), and k1 is the material constant for aluminum alloys (150 MPa). Microhardness of the tested alloys was measured under a load of 98.12 mN using a Vickers microhardness tester.
2.3 Tribological tests
Tribological tests were performed by using a ball-on-disc type tribotester according to ASTM G99 Standard. The schematic illustration of the machine is shown in Fig. 2. Detailed information about the design and operation of the machine is given in the literature [24]. The test specimens were prepared from the alloy ingots by machining with the dimension of 7 mm in thickness and 22 mm in diameter. They were polished with abrasive paper with 2000 grit number before the test. Wear samples were tested against a 100Cr6 steel ball with 6 mm in diameter. The tests were carried out under a load of 5 N and at a sliding speed of 0.15 m/s for a sliding distance of 1000 m. These test parameters were determined by considering the studies made on aluminum alloys with this kind test setup. Each friction-wear test was performed with a new sample and ball. The coefficients of friction of the alloys were calculated by dividing the frictional force by normal load. The change of friction coefficient was continuously recorded during the tests. The amount of wear occurring in the test samples was calculated as volume loss. The volume loss values of the alloys were determined by dividing the measured mass loss values by the density values. A balance with an accuracy of ��0.01 mg was used to determine the mass loss values.
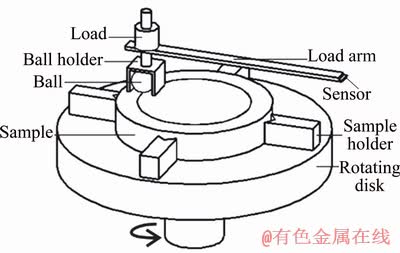
Fig. 2 Schematic illustration of wear test machine
2.4 Corrosion tests
Corrosion tests of the alloys were carried out in an electrochemical test apparatus whose schematic representation is given in Fig. 3. Test specimens were produced by machining with a surface area of 1 cm2 and a height of 5 mm from the alloy ingots. They were cold mounted and the surfaces to be tested were polished with 320, 600, 1200 and 2000 grit number abrasive paper, respectively, before the corrosion tests. Corrosion tests were performed in pure water + 3.5% NaCl solution. At least five corrosion tests were performed for each alloy and Tafel polarization curve was obtained. Corrosion rate (R) of each alloy was determined by using the Jcorr value obtained from Tafel curve in Eq. (2) [25]:
R=(3272Jcorr��W)/(D��A) (2)
where Jcorr is the corrosion current, W is the equivalent mass of the tested alloy, D is the density of tested alloy, and A is the surface area (1 cm2) of the test sample. In the corrosion tests, the difference between the anode (sample) and the cathode (reference calomel electrode) was -0.93 V. For the potentiodynamic polarization cycle, the starting voltage (��start), -0.25 V, the end voltage (��end), +0.25 V, the voltage step (��step), 1 mV and the scanning speed, 5 mV/s, were taken.
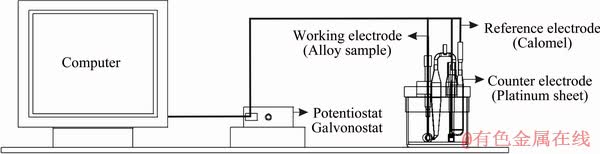
Fig. 3 Schematic illustration of corrosion test setup
3 Results and discussion
3.1 Microstructures
Chemical compositions of the experimental alloys are given in Table 1.
The microstructures of the tested alloys are shown in Figs. 4-7 and EDS analysis results of the phases observed in the microstructures of these alloys are given in Table 2. SEM mapping analysis results showing the existence and distribution of all the alloying elements and only titanium in the matrix of Alloys B and D are presented in Figs. 8 and 9, respectively. The microstructures of Alloys A and B were observed to consist of primary alpha (��) dendrites, ��+�� and theta (��) phases (Figs. 4 and 5). These phases are formed by the eutectic reactions of S ��+�� and S��+�� which take place during solidification of the alloys. It is known that these reactions take place in both Al-Cu and Al-Zn systems at temperatures of approximately 548 and 382 ��C, respectively [26,27]. However, the �� and �� phases may also be formed by the eutectoid reaction of ����+�� which takes place in Al-Zn system after forming of �� phase by the peritectic reaction of ��+s��. The microstructure of the silicon containing Alloy C was observed to be composed of needle-shaped silicon and irregular polygonal-shaped silicon particles in addition to the phases observed in Alloy C (Fig. 6). The needle- shaped silicon particles are known to occur by eutectic reaction during cooling in aluminum and silicon containing alloys. Therefore, they are called as eutectic silicon particles [14]. The irregular polygonal-shaped coarse silicon particles are known as primary silicon particles. These may have been caused by the non-equilibrium cooling of the alloy. Figures 5 and 7 show the microstructures of the titanium-containing Alloy B and Alloy D, respectively. We could not detect a different phase in these alloys besides those seen in Alloys A and C, but the size of the �� grains was reduced and the number of them was increased. Not detecting of any new phase in the microstructure of the titanium containing alloys can be explained with the help of Al-Ti and Zn-Ti phase diagrams [24]. According to these phase diagrams, aluminum and zinc can solute low rates of titanium in the solid state. Therefore, the 0.01 wt.% titanium can be fully dissolved in the �� and ��+�� phases of these alloys.
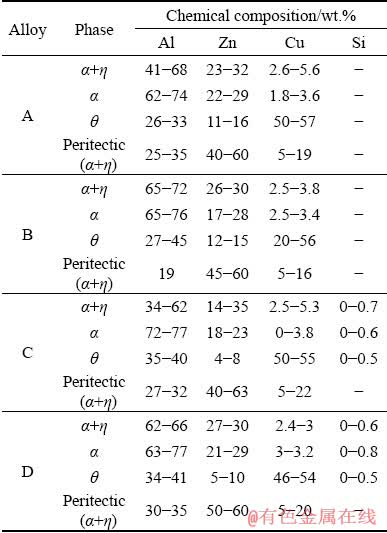
Table 1 Chemical compositions of experimental alloys (wt.%)
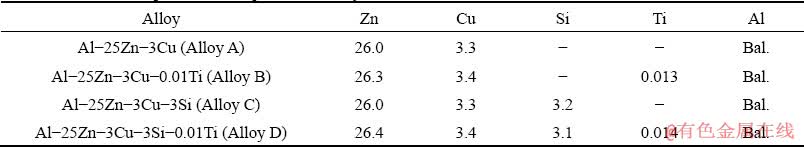
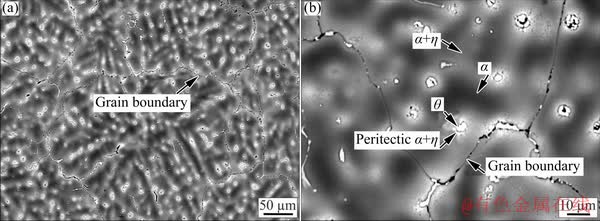
Fig. 4 Low (a) and high (b) magnification SEM micrographs showing microstructure of Alloy A
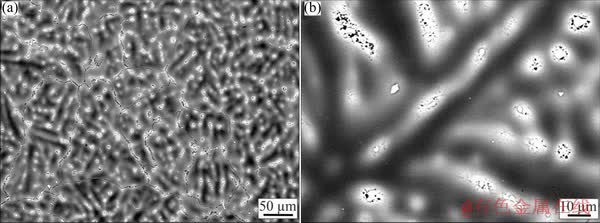
Fig. 5 Low (a) and high (b) magnification SEM micrographs showing microstructure of Alloy B
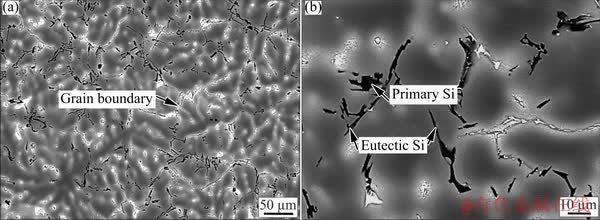
Fig. 6 Low (a) and high (b) magnification SEM micrographs showing microstructure of Alloy C
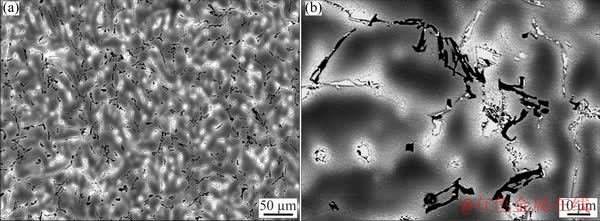
Fig. 7 Low (a) and high (b) magnification SEM micrographs showing microstructure of Alloy D
Table 2 EDS analysis results of phases observed in microstructures of tested alloys
The grain size measurement results and bar charts showing the average grain size of the tested alloys with the titanium addition are given in Fig. 10. The average grain sizes of Alloys A, B, C and D were calculated to be 104, 84, 101 and 62 ��m, respectively. These results show that the titanium additions caused a decrement in grain size of the Alloy A (Al-25Zn-3Cu) and Alloy C (Al-25Zn- 3Cu-3Si) from 104 to 84 ��m and from 101 to 62 ��m, respectively (Fig. 10). In other words, approximately 20% and 39% refining in grain size is achieved in the Alloy A and Alloy C, respectively, with titanium additions. Different theories have been presented on the mechanisms of grain refinement in aluminum alloys by grain refiners containing titanium [28]. Among these theories, the carbide-borides, peritectic, peritectic hulk, duplex nucleation and solute theories are widely used for the explanation of grain refinement mechanism in the Al based alloys. Our results are more consistent with the solute theory because titanium is completely solved in the microstructure of the alloys and no new phase is observed with the titanium addition.
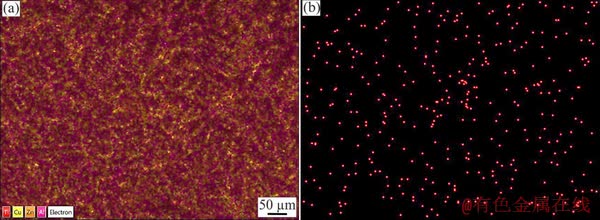
Fig. 8 SEM mapping analysis results showing existence and distribution of all alloying elements (a) and only titanium (b) in matrix of Alloy B
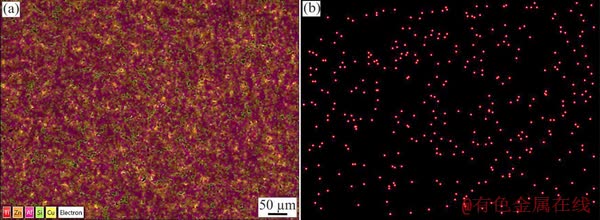
Fig. 9 SEM mapping analysis results showing existence and distribution of all alloying elements (a) and only titanium (b) in matrix of Alloy D
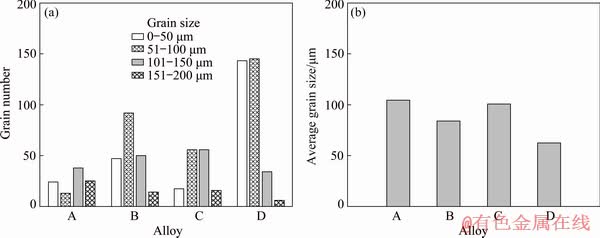
Fig. 10 Bar charts showing grain numbers and sizes (a) and average grain sizes (b) of tested alloys
The reduction in the grain size of �� phase due to the addition of titanium can be explained by the MAXWEELL and HELLAWELL [29,30] growth- restriction factor:
Q��=C0m(k2-1) (3)
where Q�� is the growth-restriction factor, C0 is the average bulk solute content, m is the gradient of the liquidus line, and k2 is the partition coefficient. From this correlation, it is understood that increasing the solubility in a phase causes an increase in the growth restricting factor and thus leads to a limitation of grain growth. The dissolution of titanium in the ��-phase of Alloy A and Alloy C could have limited the growth of this phase and caused a reduction in its grain size. The reduction in grain size is known to cause solidification to continue around more nuclei and to increase the number of grains [29,31]. It is also known that the nuclei grow by taking the element having higher solidification temperature from the liquid metal [32]. This can lead to the reduction or depletion of aluminum having higher solidification point than zinc in liquid metal within an earlier period of cooling. Reduction or depletion of aluminum in the liquid metal in an early stage of the solidification, in addition to the growth- restriction mechanism mentioned above, may have limited the growth of �� dendrites during cooling [31].
The XRD patterns obtained from the sample of the tested alloys confirmed the presence of the phases observed in the micrographs (Fig. 11). In the Alloy A, Al peaks were observed at 2�� degree of 38��, 44��, 64��, 77��, Zn peaks were observed at 2�� degree of 36��, 38��, 42��, 53��, 69��, and Al2Cu peaks were observed at 2�� degree of 42��, 58��, 68�� (Fig. 11(a)). No titanium peak was detected in the Alloy B (Fig. 11(b)). In addition to the peaks observed in the alloys A and B, silicon peaks were observed at 2�� degree of 47��, 56��, 78�� in Alloys C and D (Figs. 11(c) and (d)). When the results of the XRD studies and microstructural investigations are evaluated together, it is seen that the addition of 0.01 wt.% titanium does not lead to the formation of any visible new phase in Alloys A and C. This can be due to the dissolution of the added titanium in other phases. It has been suggested in literature [21] that titanium-containing phases in Al-Zn alloys are clearly visible after 0.01 wt.% Ti. Our results are consistent with this literature knowledge.
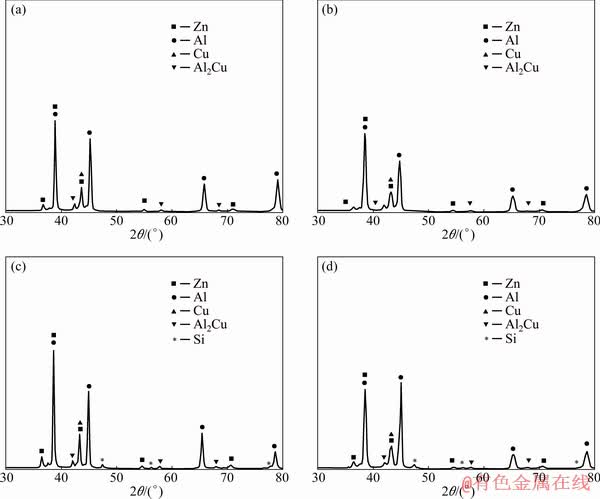
Fig. 11 XRD patterns showing phases in Alloys A (a), B (b), C (c) and D (d)
3.2 Mechanical properties
The hardness, yield strength, tensile strength and elongation to fracture of the tested alloys are given in Fig. 12. It is shown that titanium addition resulted in a significant increase in these values. The improvement in the hardness and mechanical properties of Alloys A and C with the titanium addition can be explained with the effects of grain size reduction and solid solution mechanism formed by solution of the titanium in the �� and ��+�� phases. Relation between grain size and strength in polycrystalline metals is generally expressed by the Hall-Petch formula [32]
��=��0+k3d-1/2 (4)
where �� is the strength, d is the average grain size, ��0 is the strength of the single crystal, and k3 is a constant depending on material. It is indicated that the strength of an alloy is inversely proportional to the square root of the grain size. The relation between grain size and strength is rationalized by dislocation theory. This theory assumes that grain boundaries behave as a barrier to slip dislocations and cause dislocations to pile up on their slip planes behind the grain boundaries. It is also assumed that the number of dislocations in these pile-ups increase with both increasing grain size and magnitude of the applied stress. In addition, these pile-ups produce a stress concentration in the grain next to that containing a pile-up that varies with the number of dislocations in the pile-up and magnitude of the applied stress. Thus, fine-grained materials have less stress multiplication in the next grain compared to coarse-grained materials. This means that slip to pass through the boundary needs a greater stress in the fine-grained materials than coarse-grained materials [33]. Therefore, a reduction in the grain size causes an increase in the strength of the alloys. Microhardness of �� phase alloys increased with titanium additions (Fig. 13). From these data, it can be understood that titanium increases the strength of aluminum-zinc based alloys by not only grain refinement but also solid solution formation and hardening mechanism.
Titanium addition to alloys A and C resulted in an increase in their quality index values (Fig. 14). This is due to the increase in both their tensile and elongation with titanium additions. Among the titanium containing alloys, Alloy B has higher quality index value than Alloy D. This is due to the fact that the Alloy B has a higher elongation to fracture than Alloy D.
3.3 Fracture surfaces
SEM micrographs of the tensile fracture surfaces of the tested alloys are given in Fig. 15. Fracture surfaces of Alloys A and B are composed of mainly cups and cones or dimples (Figs. 15(a) and (b)). Dimples formation is explained based on nucleation and growing of the microvoids in the central region of the tensile test samples, where the diffuse notch (created by necking) causes separation due to triaxial (hydrostatic) tension. These microvoids merge, resulting in forming of larger voids. Simultaneously, smaller voids are formed and dispersed in the remainder of the test samples.
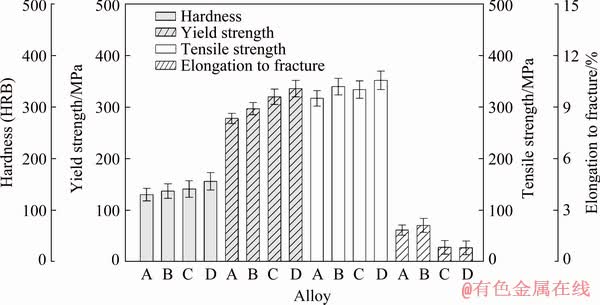
Fig. 12 Bar charts showing values of hardness, yield strength, tensile strength, and elongation to fracture of alloys
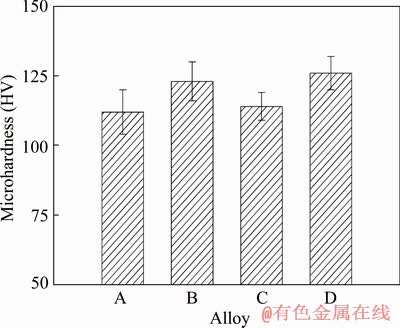
Fig. 13 Bar charts showing microhardness values of �� phase of tested alloys
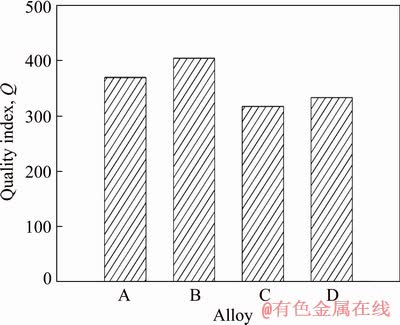
Fig. 14 Bar charts showing quality indexes of tested alloys
The cross section of the tensile test samples includes a plurality of voids at a stage between the neck and the final fracture. The fracture process is based on combining these cavities in a plane perpendicular to the loading direction and becoming a central crack [34]. This crack progresses towards the outer surface of the sample and changes its path as the process approaches to the final fracture. The fracture occurs along the shear plane and leads to forming of slip lip. These kind of fracture surfaces are characterized by dimples. These dimples represent the numerous concave depressions left on the opposite fracture faces of the broken specimen. The voids are generally known to initiate from inclusions or intermetallic particles [35]. However, no inclusions or intermetallic particles were observed on the fracture surfaces. This can be due to the high purity of the alloys produced and the low proportion of intermetallic particles they contain.
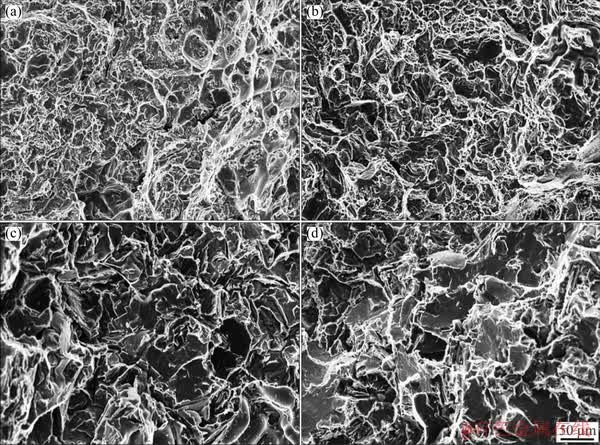
Fig. 15 SEM micrographs showing fracture surfaces of tensile test sample of Alloys A (a), B (b), C (c), and D (d)
In addition to dimples, cleavage planes were observed on the fracture surfaces of the silicon containing Alloys C and D (Figs. 15(c) and (d)). Cleavage is a sign of brittle fracture. Cleavage fracture is well known for occurring in materials with little or no plastic deformation capacity, and fracture mechanism is known by separation of atomic bonds. The reason for the formation of cleavage planes in Alloys C and D is explained by the fact that the silicon particles present in the microstructure cause brittle fracture of the alloy [34]. The fracture mechanism in Al based alloys containing silicon is suggested to be related to the bond strength of the matrix with the silicon crystals and the ease of fracture of the silicon crystals [36-38]. The fracture originating from silicon crystals shows the intergranular damage character and more cracks are formed in silicon crystals. This is because the stresses formed in the matrix are transferred to the silicon crystals at a higher rate. Therefore, the strength values of the silicon crystals overcome more easily. As a result, the primary silicone particles crack in the cleavage form [39].
The micrographs of the longitudinal sections below the fracture surfaces of tensile test samples of the alloys are presented in Fig. 16. These micrographs show that the fracture occurs in the zinc-rich interdendritic regions of the tested alloys and when the fracture line reaches the �� dendrites, it preferably propagate along dendrite boundary. This can be due to the properties of ��+�� phase regions surrounding the aluminum-rich �� dendrites. It is known that the �� phase is more brittle than the �� phase because zinc has a higher shear modulus than aluminum [23]. Therefore, �� phase regions are easy and much deformable in the strain field of a moving dislocation and so cracks preferably initiate and progress in this phase regions.
3.4 Tribological properties
Wear volume of Alloys A and C decreased with titanium addition (Fig. 17). This can be due to the increase in the strength of these alloys by the addition of titanium. It is known [5], that the wear resistance of both Zn-Al and Al-Zn based alloys is directly proportional to the strength values. Friction coefficient of Alloys A and C also decreased with titanium addition (Fig. 17). This may be caused by decreasing in the ductility. It is known that less plastic flow occurs on the surface of the materials as the ductility decreases and this leads to a reduction in frictional forces [40]. Decrease in the friction force results in low friction coefficient.
The wear surface micrographs show that smearing and microcracks form on the wear surfaces, but smearing is main mechanism for the tested alloys (Fig. 18). The smearing layers can be formed by back transferring the wear particles on the sample surfaces by the effect of the applied force. Therefore, it can be said that the type of wear in the alloys tested is mainly adhesive. The microcracks result from the brittleness of the smearing layer as reported in previously published work [41].
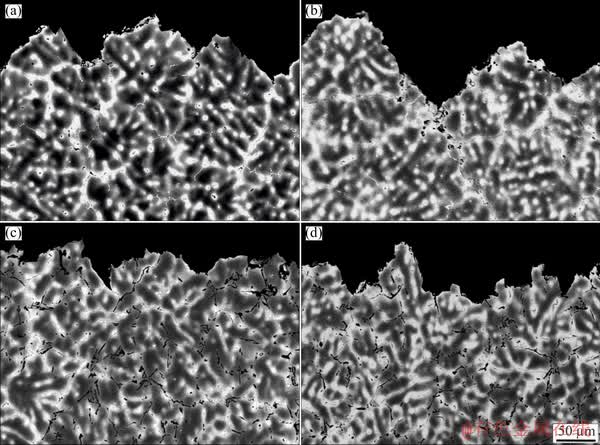
Fig. 16 SEM micrographs showing longitudinal sections below fracture surfaces of tensile test sample of Alloys A (a), B (b), C (c), and D (d)
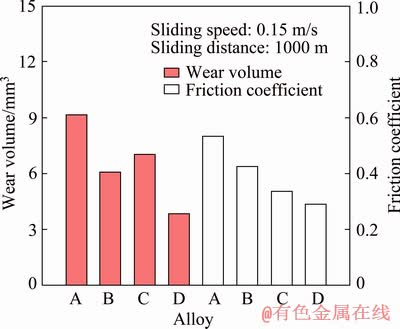
Fig. 17 Bar charts showing wear volume and friction coefficient of tested alloys
The micrographs showing the wear debris collected from the disc surface are given in Fig. 19. This debris appears to consist of a mixture of particles with different sizes and shapes. It was also observed that the titanium additions had no significant effect on the size and shape of the wear particles. This can be due to the brittleness of the surface layer as described in the literature [3]. The brittleness of smearing layer facilitates cracking and grinding of the wear particles, and this results in the formation of similar wear particles.
3.5 Corrosion resistance
SEM micrographs showing the surfaces of the corrosion test samples before and after the tests are given in Figs. 20 and 21, respectively. Corroded surface photographs show that the corrosion is generally formed on the boundary of the dendrites and/or in the interdendritic regions (Fig. 21). This behavior can be explained based on the properties and distribution of phases in microstructures of alloys and intergranular corrosion mechanism [42]. The dendritic �� phase is surrounded by ��+�� phase, and there are also �� phase and eutectic silicon particles along dendrite borders and/or within �� phase. The �� phase is a solid solution rich in aluminum, the �� is an intermetallic compound containing aluminum and copper, and the �� phase is a solid solution rich in zinc. According to the galvanic series [23], zinc is a more anodic element than the others. Therefore, it is more prone to corrosion in the case of contact with these elements. The titanium-containing alloys have higher corrosion rates or lower corrosion resistance (Fig. 22). The increase of the corrosion rate of the alloys due to the titanium addition can be explained by the reduction in grain size and hence the increase on grain boundaries. As it is known, grain boundaries or dendrite borders are sensitive to corrosion due to the fact that they separate the different phases [8,42,43]. Therefore, an increase in grain boundaries due to titanium addition can also cause an increase in corrosion.
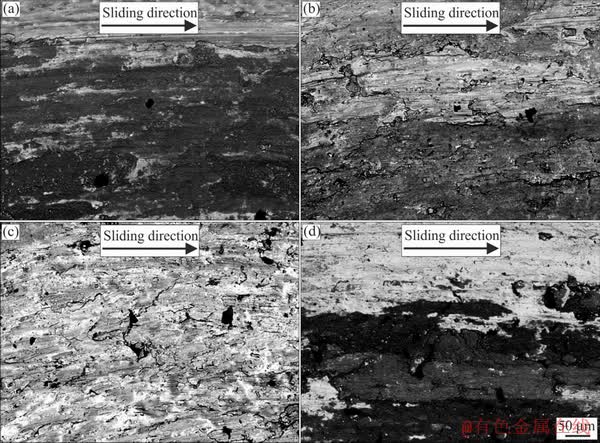
Fig. 18 SEM micrographs showing wear surfaces of Alloys A (a), B (b), C (c) and D (d)
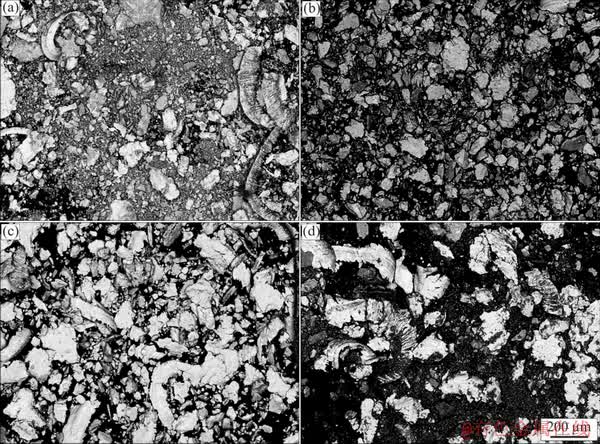
Fig. 19 SEM micrographs showing wear debris of Alloys A (a), B (b), C (c) and D (d)
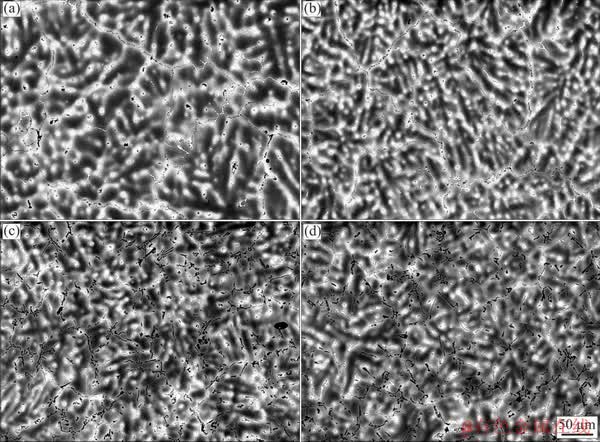
Fig. 20 Morphologies of sample surfaces of Alloys A (a), B (b), C (c) and D (d) before corrosion test
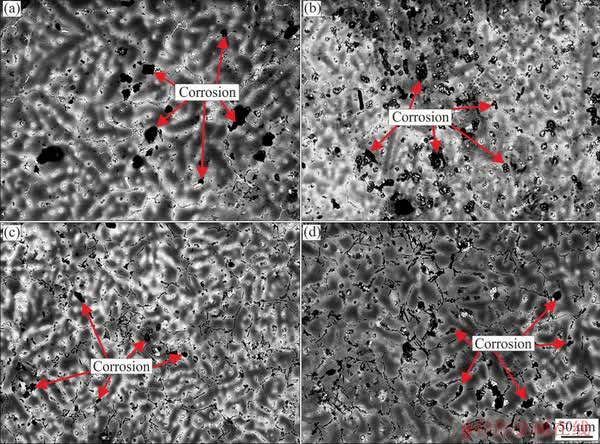
Fig. 21 Morphologies of sample surfaces of Alloys A (a), B (b), C (c) and D (d) after corrosion test
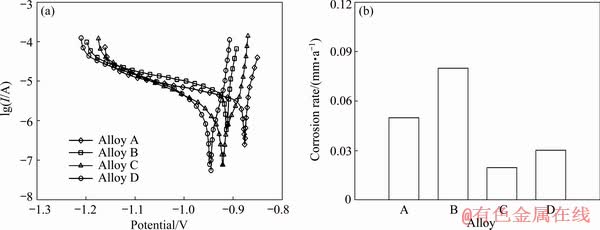
Fig. 22 Tafel potentiodynamic polarization curves (a) and bar chart showing corrosion rate of tested alloys (b)
4 Conclusions
(1) The microstructure of the Al-25Zn-3Cu alloy consists of aluminum-rich ��-dendrites, ��+�� phase and the copper-rich �� (Al2Cu) phase. The microstructure of the Al-25Zn-3Cu-Si alloy is composed of eutectic and primary silicon particles, in addition to the phases present in Al-25Zn-3Cu alloy.
(2) The addition of 0.01 wt.% Ti causes a significant decrease in the grain size of the Al-25Zn-3Cu and Al-25Zn-3Cu-3Si alloys.
(3) The addition of 0.01 wt.% Ti to Al- 25Zn- 3Cu and Al-25Zn-3Cu-3Si alloys significantly increases their hardness, yield strength, tensile strength, and elongation to fracture.
(4) The addition of 0.01 wt.% Ti increases the wear resistance of the Al-25Zn-3Cu and Al-25Zn- 3Cu-3Si alloys. Adhesion is the dominant wear mechanism for Al-25Zn-3Cu-0.01Ti and Al- 25Zn-3Cu-3Si-0.01Ti alloys.
(5) Titanium addition reduces the corrosion resistance of Al-25Zn-3Cu and Al-25Zn-3Cu-3Si alloys.
References
[1] GOODWIN F E, PONIKVAR A L. Engineering properties of zinc-alloys [M]. 3rd ed. USA: International Lead Zinc Research Organization, 1989.
[2] LEE P P, SAVASKAN T, LAUFER E. Wear resistance and microstructure of Zn-Al-Si and Zn-Al-Cu alloys [J]. Wear, 1987, 117: 79-89.
[3] HEKIMOGLU A P, SAVASKAN T. Effects of contact pressure and sliding speed on the unlubricated friction and wear properties of Zn-15Al-3Cu-1Si alloy [J]. Tribology Transactions, 2016, 59: 1114-1121.
[4] HEKlMOGLU A P, SAVASKAN T. Structure and mechanical properties of Zn-(5-25)Al alloys [J]. International Journal of Materials Research, 2014, 105: 1084-1089.
[5] SAVASKAN T, HEKIMOGLU A P. Relationships between mechanical and tribological properties of Zn-15Al-based ternary and quaternary alloys [J]. International Journal of Materials Research, 2016, 107: 646-652.
[6] SAVASKAN T, P��RCEK G, HEKlMOGLU A P. Effect of copper content on the mechanical and tribological properties of ZnAl27-based alloys [J]. Tribology Letters, 2003, 15: 257-263.
[7] SAVASKAN T, MALEKl R A, TAN H O. Tribological properties of Zn-25Al-3Cu-1Si alloy [J]. Tribology International, 2015, 81: 105-111.
[8] OSORIO W R, FREIRE C M, GARCIA A. The effect of the dendritic microstructure on the corrosion resistance of Zn-Al alloys [J]. Journal of Alloys and Compounds, 2005, 397: 179-191.
[9] PRASAD B. Effects of partially substituting copper by silicon on the physical, mechanical, and wear properties of a Zn-37.5%Al-based alloy [J]. Materials Characterization, 2000, 44: 301-308.
[10] SAVASKAN T, HEKlMOGLU A P, P��RCEK G. Effect of copper content on the mechanical and sliding wear properties of monotectoid-based zinc-aluminium-copper alloys [J]. Tribology International, 2004, 37: 45-50.
[11] HEKlMOGLU A P, TURAN Y E. Effect of zinc content on the microstructure and mechanical properties of the Al- (5-50)Zn alloys [J]. G��m��Shane University Journal of Science and Technology Institute, 2019, 9: 16-25.
[12] SAVASKAN T, BlCAN O, ALEMDAG Y. Developing aluminium�Czinc-based a new alloy for tribological applications [J]. Journal of Materials Science, 2009, 44: 1969-1976.
[13] ZHOU Wen-biao, TENG Guo-bing, LIU Chong-yu, QI Hai-quan, HUANG Hai-fu, CHEN Yong, JIANG Hang-jie. Microstructures and mechanical properties of binary Al-Zn alloys fabricated by casting and heat treatment [J]. Journal of Materials Engineering and Performance, 2017, 26: 3977-3982.
[14] SAVASKAN T, BICAN O. Dry sliding friction and wear properties of Al-25Zn-3Cu-(0-5)Si alloys in the as-cast and heat-treated conditions [J]. Tribology Letters, 2010, 40: 327-336.
[15] ZHANG Tao, LU Shi-hong, WU Yun-xin, GONG Hai. Optimization of deformation parameters of dynamic recrystallization for 7055 aluminum alloy by cellular automaton [J]. Transactions of Nonferrous Metals Society of China, 2017, 27: 1327-1337.
[16] CHEN Zhong-wei, GAO Jian-ping. Formation of twinned dendrites during unidirectional solidification of Al-32%Zn alloy [J]. Transactions of Nonferrous Metals Society of China, 2018, 28: 802-811.
[17] SAVASKAN T, BlCAN O. Effects of silicon content on the microstructural features and mechanical and sliding wear properties of Zn-40Al-2Cu-(0-5)Si alloys [J]. Materials Science and Engineering A, 2005, 404: 259-269.
[18] BURAS J, SZUCKI M, PIWOWARSKI G, KRAJEWSKI W K, KRAJEWSKI P K. Strength properties examination of high zinc aluminium alloys inoculated with Ti addition [J]. China Foundry, 2017, 14: 211-215.
[19] WANG Jian-hua, WANG Xian-de, TU Hao, SU Xu-ping. Effects of titanium on microstructure and mechanical properties of ZnAl4Y alloy [J]. China Foundry, 2011, 8: 397-400.
[20] KRAJEWSKI W K, FAERBER K, KRAJEWSKI P K. The influence of grain refinement and feeding quality on damping properties of the Al-20Zn cast alloy [J]. Archives of Foundry Engineering, 2018, 18: 209-214.
[21] HEKlMOGLU A P, CALIS M. Effect of grain refinement with titanium on the microstructure, mechanical and corrosion properties of Al-25Zn alloy [J]. Journal of the Faculty of Engineering and Architecture of Gazi University, 2020, 35: 311-322.
[22] CACERES C H. Microstructural effects on the strength- ductility relationship of Al-7Si-Mg casting alloys [J]. Materials Science Forum, 2000, 331-337: 223-228.
[23] SAVASKAN T. Materials science and testing of materials [M]. 8th ed. lstanbul: Papatya Bilim, 2017.
[24] ALEMDAG Y, BEDER M. Microstructural, mechanical and tribological properties of Al-7Si-(0-5)Zn alloys [J]. Materials & Design, 2014, 63: 159-167.
[25] ASTM G102-89. Standard practice for calculation of corrosion rates and related information from electrochemical measurements [S]. ASTM International, West Conshohocken, PA. 2015.
[26] ASM International Handbook Committee. ASM handbook volume 3: alloy phase diagrams [M]. USA: ASM International, 2016.
[27] ZHU Yao-hua. General rule of phase decomposition in Zn-Al based alloys (II)��On effects of external stresses on phase transformation [J]. Materials Transactions, 2004, 45: 3083-3097.
[28] LI Hong-ying, LI De-wang, ZHU Zhi-xiang, CHEN Bao-an, CHEN Xin, YANG Chang-long, ZHANG Hong-yu, KANG Wei. Grain refinement mechanism of as-cast aluminum by hafnium [J]. Transactions of Nonferrous Metals Society of China, 2016, 26: 3059-3069.
[29] MAXWELL I, HELLAWELL A. A simple model for grain refinement during solidification [J]. Acta Metallurgica, 1975, 23: 229-237.
[30] CHEN Zong-ning, KANG Hui-jun, FAN Guo-hua, LI Jie-hua, LU Yi-ping, JIE Jin-chuan, ZHANG Yu-bo, LI Ting-ju, JIAN Xi-gao, WANG Tong-min. Grain refinement of hypoeutectic Al-Si alloys with B [J]. Acta Materialia, 2016, 120: 168-178.
[31] HEKlMOGLU A P, TURAN Y E, ISMAILOGLU I I, AKYOL M E, SEN E. Effect of boron additions on the microstructure and mechanical properties of Al-30Zn alloy [J]. Journal of the Faculty of Engineering and Architecture of Gazi University, 2019, 34: 523-534.
[32] ABBASCHIAN R, ABBASCHIAN L, REED-HILL R E. Physical metallurgy principles [M]. 4th ed. Stamford: Cengage Learning, 2009.
[33] LIN Feng-Huei, LIAW Jen-Ren, HON Min-Hsiung, WANG Cheng-Yi. The effects of Na4P2O7��10H2O addition on the mechanical properties of sintered Ca2P2O7 bioceramic [J]. Materials Chemistry and Physics, 1945, 41: 110-116.
[34] ASM International Handbook Committee. ASM handbook volume 12: Fractography [M]. USA: ASM International, 2018.
[35] ALIPOUR M, AZARBARMAS M, HEYDARI F, HOGHOUGHI M, ALIOOST M, EMAMY M. The effect of Al-8B grain refiner and heat treatment conditions on the microstructure, mechanical properties and dry sliding wear behavior of an Al-12Zn-3Mg-2.5Cu aluminum alloy [J]. Materials & Design, 2012, 38: 64-73.
[36] ABUHASEL K A, lBRAHlM M F, ELGALLAD E M, SAMUEL F H. On the impact toughness of Al-Si cast alloys [J]. Materials & Design, 2016, 91: 388-397.
[37] ZHOU J, DUSZCZYK J. Fracture features of a silicon- dispersed aluminium alloy extruded from rapidly solidified powder [J]. Journal of Materials Science, 1990, 25: 4541-4548.
[38] CACERES C H, GRIFFITHS J R. Damage by the cracking of silicon particles in an Al-7Si-0.4Mg casting alloy [J]. Acta Materialia, 1996, 44: 25-33.
[39] HAFIZ M F, KOBAYASHI T. A study on the microstructure- fracture behavior relations in Al-Si casting alloys [J]. Scripta Metallurgica & Materialia, 1994, 30: 475-480.
[40] BHUSHAN B. Modern tribology handbook [M]. USA: CRC Press, 2001.
[41] SAVASKAN T, MALEKI R A. Friction and wear properties of Zn-25Al-based bearing alloys [J]. Tribology Transactions, 2014, 57: 435-444.
[42] ASM International Handbook Committee. ASM handbook volume 13A: Corrosion: Fundamentals, testing, and protection [M]. USA: ASM International, 2018.
[43] OSORIO W R, GOULART P R, GARCIA A, SANTOS G A, NETO C M. Effect of dendritic arm spacing on mechanical properties and corrosion resistance of Al 9 Wt Pct Si and Zn 27 Wt Pct Al alloys [J]. Metallurgical and Materials Transactions A, 2006, 37: 2525-2538.
�ṹ����ѧ��Ħ��ѧ��ʴ���ܵ�Ӱ��
Ali PaSa HEKIMOGLU, Merve CALIS
Mechanical Engineering Department, Engineering Faculty, Recep Tayyip ErdoGan University, Rize 53100, Turkey
ժ Ҫ��Ϊ���о�����ϸ�����¿�����Al-25Zn-3Cu���Ͻ����ܵ�Ӱ�죬���ý��������취�Ʊ�Al-25Zn-3Cu��Al-25Zn-3Cu-0.01Ti��Al-25Zn-3Cu-3Si ��Al-25Zn-3Cu-3Si-0.01Ti�Ͻ���ɨ��羵(SEM)�۲�Ͻ������֯���ֱ��ò���Ӳ�ȷ�����������ⶨ�Ͻ��Ӳ�Ⱥ���ѧ���ܣ�������ʽĦ��������о��Ͻ��Ħ��ѧ���ԣ��õ绯ѧ��ʴʵ��װ���о��Ͻ�ĸ�ʴ���ܡ������ʾ��A1-25Zn-3Cu ��Ԫ�Ͻ������֯���Ц�����+�Ǻͦ� (Al2Cu) �ࡣ����3%Si(��������)��A1-25Zn-3Cu�Ͻ�����֯���γɹ����������0.01%Ti(��������)��Al-25Zn-3Cu ��Al-25Zn-3Cu-3Si�Ͻ�ľ����ߴ�ֱ��СԼ20%��39%��Ӳ�ȷֱ��HRB 130��HRB 141���ӵ�HRB 137��HRB 156���Ͻ������ǿ�ȷֱ��278 MPa��320 MPa���ӵ�297 MPa��336 MPa������ǿ�ȷֱ��317 MPa��334 MPa���ӵ�340 MPa��352 MPa�������Ѻ��������ӣ��Ͻ����ĥ����ߣ�����ʴ�Խ��͡�
�ؼ��ʣ�Al-Zn-Cu�Ͻ���̬����֯����������ʴ�����ѣ�Ħ��ĥ����������ѧ����
(Edited by Bing YANG)
Corresponding author: Ali PaSa HEKlMOGLU; E-mail: ali.hekimoglu@erdogan.edu.tr
DOI: 10.1016/S1003-6326(20)65214-1

