Trans. Nonferrous Met. Soc. China 22(2012) s350-s356
Plastic deformation on hydroforming of aluminum alloy tube with rectangular sections
WANG Xiao-song1, YUAN Shi-jian1, SONG Peng2, XIE Wen-cai3
1. School of Materials Science and Engineering, Harbin Institute of Technology, Harbin 150001, China;
2. Aerospace Research Institute of Materials & Processing Technology, Beijing 100074, China;
3. FAW Car Co., Ltd., Changchun 130011, China
Received 28 August 2012; accepted 25 October 2012
Abstract: The plastic deformation process on hydroforming of aluminum alloy tube with rectangular sections was carried out by means of experiment and numerical simulation using solid elements. The stress and strain states of typical points were analyzed. The three-dimensional graphic representation of normal stress was done. The stress locus in the yielding-cylinder was obtained. It is shown that the plastic yielding firstly occurred in the outer layer of the corner. The inner layer of the corner at each end about 1/4 region is the last region which came into yielding. The strain state of the corner is shortened in the thickness direction and elongated in the hoop direction. The plastic deformation firstly occurred in the transition point and the equivalent strain of transition point was the largest all the time. The axial stress of the transition point is tensile stress all the time as the internal pressure increases.
Key words: aluminum alloy; tube hydroforming; rectangular section; plastic deformation; solid elements; normal stress figure; stress locus
1 Introduction
Tube hydroforming technology was wildly used to manufacture hollow tubular part with different sections to meet the demand of the light-weight structure of automobile, aerospace industry etc [1-5]. The tubular part with rectangular section is the most popular kind of part because the bending modulus of rectangular section is bigger than that of the circular section.
Theoretic analysis was carried out and the conclusion was drawn that the plastic deformation occurred firstly in the transition point and the thickness reduction here was the biggest [6,7]. The influence of the tribology in hydroforming of tubular part with square section was investigated by means of simulation. It is shown that with the increase in the tribology coefficient, bursting easy occurred and bursting pressure was lowered [8].
Shell elements and solid elements were used in simulation of hydroforming of the corner. The results indicate that the stress and strain obtained from the simulation using shell element are increased unreasonablely in the final stage. The shear deformation could not be simulated and the deformation in one element was restricted. The shell element is not a proper choice for hydroforming of the corner [9]. The simulation using solid elements could represent the three-dimensional stress state of the final stage.
Aluminum alloy 6063(T4) was used in hydroforming experiment of part with square section. The corner radius of formed part was measured after unloading. The relationship between internal pressure and corner radius was obtained. The simulation was carried out using the DEFORM 2D. The results of the thickness distribution and corner filling pressure are similar to the experiment results [10,11].
A special experiment device was designed and the real-time corner radius was measured by displacement sensor during the corner expansion process [12]. The theoretical equation between internal pressure and corner radius was deducted.
In this work, the numerical simulation and experiments was carried out on hydroforming of tubular part with rectangular sections. The three-dimensional graphic representation of the normal stress and stress locus in the yielding-cylinder was obtained. The occurring and development of plastic deformation on hydroforming of the rectangular section was analyzed.
2 Research plan
2.1 Experiment plan
The shape and dimensions of the rectangular section are shown in Fig. 1. The width and height of the section are 63 mm and 48.4 mm separately, and the corner radius is 2 mm. The expansion ratio of section from the circular tube to rectangular section is 10.8%. To investigate the influence of lubricants on plastic deformation, different lubricants, such as oil, MoS2 and PE film, were used in experiment.
The material is assumed to obey the power- hardening law:
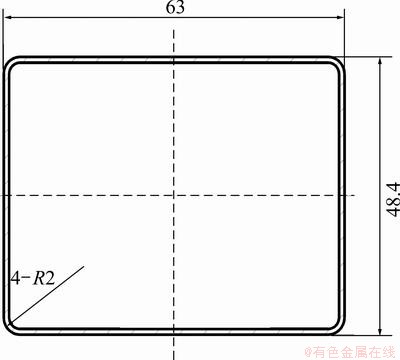
Fig. 1 Shape and dimensions of rectangular section (unit: mm)
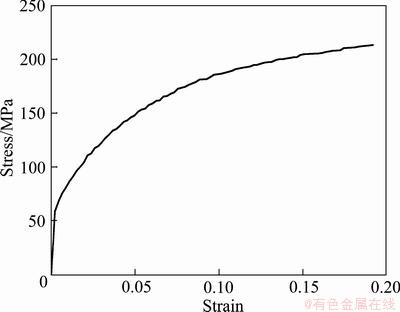
Fig. 2 True stress―strain curve of 5A02 aluminum alloy tube
The material used in the experiment was 5A02 aluminum tube. The original outer diameter and thickness were 63 mm and 1 mm separately. The specimen was gotten along the axial direction. And the true stress―strain relation was obtained from the tension test and is shown in Fig. 2.
 (1)
(1)
where σi is the flow stress; εi is the equivalent strain; n is the work-hardening component; K is the hardening coefficient. n=0.17, K=343 MPa, the yielding stress σ0.2=80 MPa.
2.2 Simulation model
Because the tube ends were constrained, the material flow in the axial direction could be neglected. As the shape of die cavity and internal pressure along the axial direction are same, the stress state and deformation of the tube are nearly coincident, so the assumption was made that the section in the middle of the tube is under the plane-strain state. Thus the deformation of the tube could be analyzed as a plane-strain subject.
The static-implicit FE code DEFORM 2D was adopted and the solid element was used in the simulation. One half of a plane strain model was set up according to the symmetrical section and is shown in Fig. 3. The tube was meshed as 4-node quadrangle element. There were 5 layers along the thickness direction. The die was meshed as rigid element. The column friction model was adopted, and the frictions were set as 0.05, 0.10 and 0.15. The internal pressure was added on the inner face of the tube. And the increasing speed of the internal pressure was kept a constant. The final internal pressure was set as 70 MPa.
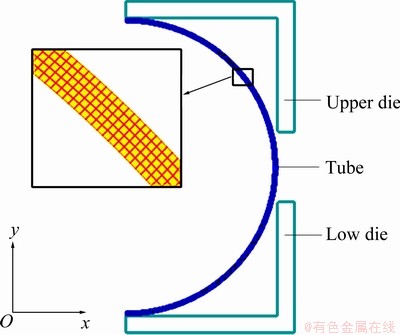
Fig. 3 Numerical simulation model
3 Experiment results and bursting analysis
The experiment results with different lubricants are shown in Fig. 4. When there was not the lubricant and the lubricant was oil or MoS2, bursting occurred at the transition zone between the straight tube and the corner, as shown in Fig. 4(a). The radii of the corner were 7.50 mm, 6.50 mm and 4.65 mm, separately, for without lubricant, with oil and MoS2. With the PE film as lubricant, bursting did not occur and the final radius of the tube was 2.20 mm and shape of the section is shown in Fig. 4(b).
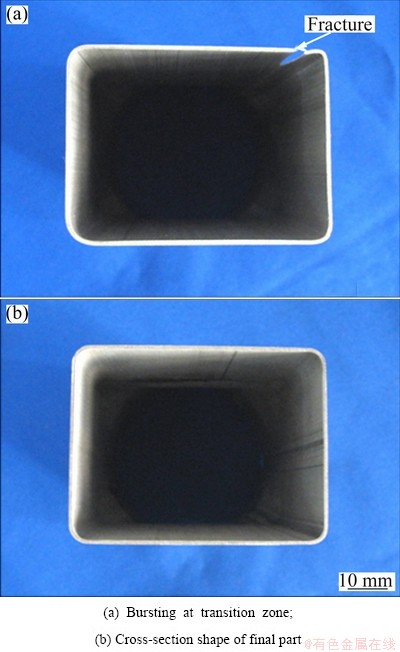
Fig. 4 Experimental results
The distribution of the equivalent stress with the friction coefficient of 0.05 was gotten from numerical simulation and is shown in Fig. 5(a). The equivalent stress values for the outer layer of the corner and the transition are the biggest. The equivalent stress value of the inner face of the tube is shown in Fig. 5(b). The x-coordinate is the distance from the measuring point to the middle point of the straight side. The y-coordinate is the value of the equivalent stress. The equivalent stress for the middle point of the straight side is only 101 MPa while the equivalent stress for the transition point is 215 MPa. The equivalent stress of the transition point is the biggest in all the points. The transition zone is the most dangerous place during the process.
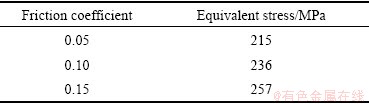
The equivalent stress values of the transition point under different friction coefficients are shown in Table 1. With the increase in friction coefficient, the equivalent stress increased too. The tendency of bursting is growing with the increase of friction coefficient.
4 Process of plastic deformation
The occurrence and development of the plastic deformation are shown in Fig. 6. The plastic deformation region was represented by the shadow zone. The plastic deformation region was enlarged with the increase in the internal pressure. But the expansion modes were different for the straight side and the corner region.
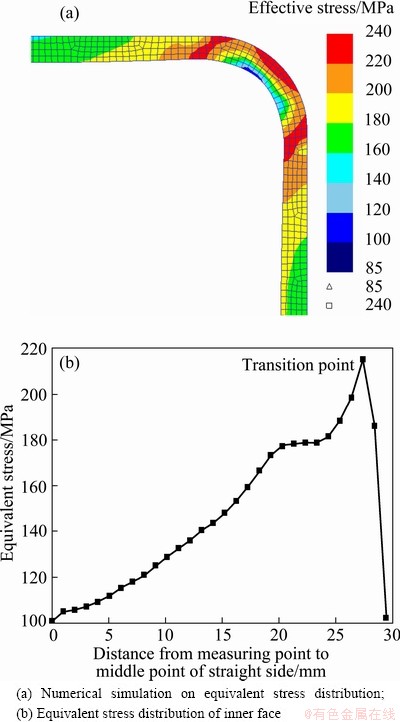
Fig. 5 Equivalent stress distribution after hydroforming
Table 1 Equivalent stress of transition point for different friction coefficients
During the die-closing process, the tube was crashed into the die cavity in the vertical direction. The plastic deformation occurred at the center zone of the straight side firstly and at the outer side of the corner subsequently during the die-closing process (Fig. 6(a)). After the die was closed, the inner layer of each end of the corner about 1/4 region had came into plastic deformation. The equivalent stress of the middle region of the corner was bigger than that of the straight side.
In the initiate stage of hydroforming, the equivalent stress decreased when the value of internal pressure was small (Fig. 6(b)). When the pressure reached 2.5 MPa (0.03σs), the inner layer of the straight side and outer layer of the corner were still kept in plastic deformation state. When the pressure was 7.0 MPa (0.09σs), the plastic deformation region expanded significantly with the increase in internal pressure, and almost all the region of the cross-section was kept in plastic deformation state except for the outer layer of the middle corner region and the inner layer of each end of the corner (Fig. 6(c)). The equivalent stress of the rectangular section was higher than the yield stress when the pressure was up to 11.0 MPa (0.14σs), which indicates that the whole rectangular section was kept in the plastic deformation state (Fig. 6(d)).
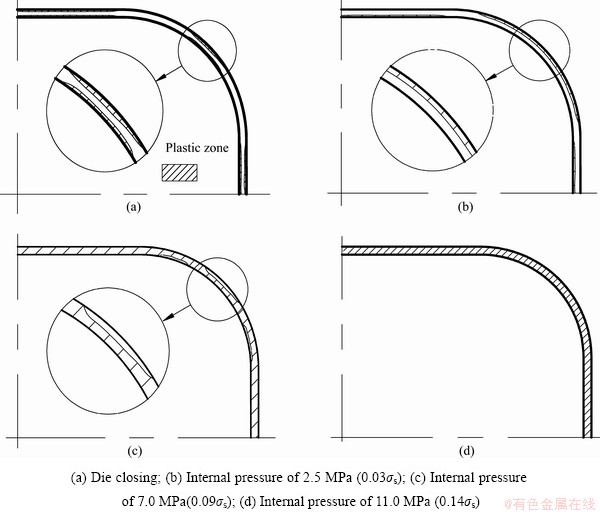
Fig. 6 Occurrence and development of plastic region
5 Three-dimensional graphic representation of normal stress
The stress states of the rectangular section in different regions are different due to the pressure and the friction between the die and tube. To fully understand the stress state in different regions of the rectangular section, the midpoint of the straight side (Mi), the transition point (Ti) and the midpoint of the corner (Ci) were taken, as shown in Fig. 7.
In order to gain more intuitive understanding of the deformation state in the rectangular section, the normal stress of above three points and the corresponding deviator stress are given in three-dimensional visualization, as shown in Figs. 8-10. The intercept of each normal direction represented the value of principal stress, and the positive and negative normal stress values were distinguished by light and dark color respectively [13,14].
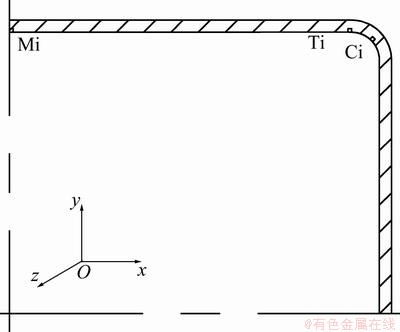
Fig. 7 Position of typical points
Since strain increment was proportional to the corresponding stress deviator components, the instantaneous dimensional changes were determined by the stress deviator. If the prerequisite of σ1>σ2>σ3 was satisfied, there will be the corresponding result as dε1>0 and dε3<0. The positive or negative of the dε2 was determined by  , which was commonly presented by Lode parameter (μσ) as follows:
 (2)
(2)
where σ1, σ2 and σ3 are corresponding stress deviator components. If μσ is bigger than 0, there will be compressive strain, and if μσ is smaller than 0, there will be tensile strain. Under the condition of μσ=0, there will be plane strain [15].
As seen from Figs. 8-10, values of the three typical points are all equal to 0, and according to Eq. (2) there will be μσ=0. It is indicated that they were all in the plane strain state. The strain states of all the three points were shortened along the thickness direction and elongated along circumferential direction. The tendency of thinning of transition point is the biggest among the three points.
The strain types of three points all belonged to plane strain. But the stress states were different. The hoop stress of the three points was tensile stress, and the thickness stress was compressive stress. The axial stress was compressive stress for midpoint of the straight side and the corner. While the axial stress of the transition point was tensile stress.
6 Stress locus in yielding-cylinder
Not only the three dimensional stress state and the developing process could directly reflected by Mises cylinder, but also the qualitative relationship between the stress components could be given. The stress locus of typical points is shown in Fig. 11. The middle point of the straight side was in plastic deformation state with three-dimensional tensile stress after die-closing process. With increasing the pressure, the thickness stress of the point changed from tensile stress to compressive stress. The stress locus of the point came back into the inside of yielding-cylinder. When the internal pressure exceeded 5 MPa, the middle point was in plastic deformation again with 2D tensile state and 1D compressive stress state. When the pressure increased to 70 MPa, the axial stress changed from tensile stress to compressive stress. The stress state of the middle point experienced a process from 3D tensile stress to 2D tensile and 1D compressive stress states, and finally changed to one tensile and two compressive stress states.
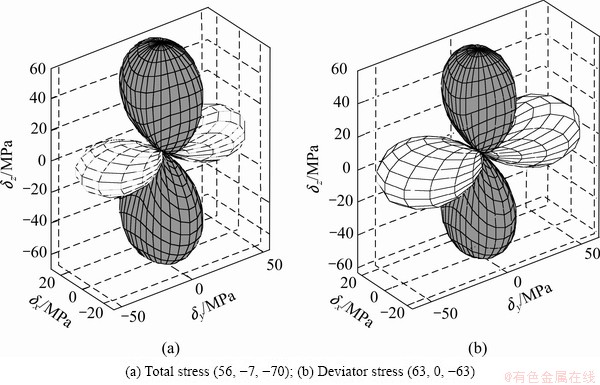
Fig. 8 Normal stress 3D figures of point Mi (unit: MPa)
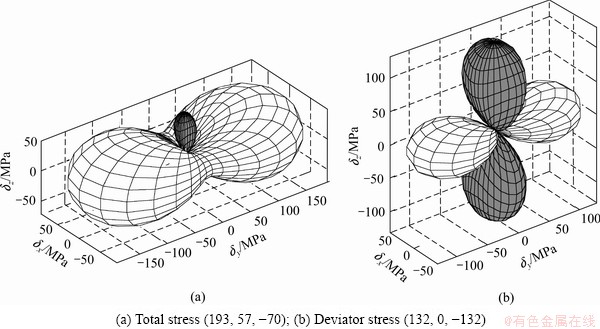
Fig. 9 Normal stress 3D figures of point Ti (unit: MPa)
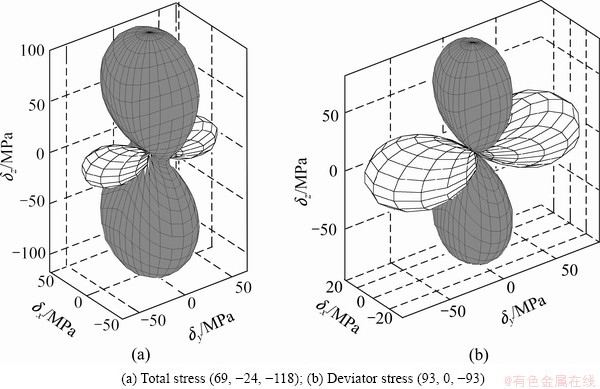
Fig. 10 Normal stress 3D figures of point Ci (unit: MPa)

Fig. 11 Stress locus of typical points
The transition point was also in plastic deformation with 2D tensile and 1D compressive stress states after die-closing process. The circumferential tensile stress gradually increased with increasing the pressure. The circumferential stress reached the maximum value of 193 MPa when the internal pressure is 70 MPa. The stress state of transition point was 2D tensile and 1D compressive stress state all the time. The value of the circumferential tensile stress and thickness stress tended to increase, while the axial tensile stress remained stable.
The middle point of the corner was also in plastic deformation with 3D compressive stress after die-closing process. With the increase of the pressure, the stress locus came back into the inside of yielding-cylinder. When the internal pressure exceeded 5 MPa, the point came into plastic deformation again with 2D tensile and 1D compressive stress state. When the internal pressure increased to 70 MPa, the axial stress changed from tensile stress to compressive stress. The stress state of the point experienced a process from 3D compressive stress to 2D tensile and 1D compressive stress state, and finally changed into 1D tensile and 2D compressive stress state.
From the stress locus analysis of the three typical points, it was known that internal pressure showed great effects on positive or negative of the axial stress during the deformation process. With the increase in the pressure, the axial stress values for the midpoint of straight side and the midpoint of the corner were gradually changed from tensile stress to compressive stress, while the axial stress of the transition point was always tensile stress whose stress locus was always in the fifth quadrant. When the internal pressure exceeded 70 MPa, the axial stress reached the maximum value of 57 MPa.
7 Conclusions
1) The equivalent stress from the midpoint of the straight side to the transition point increased gradually due to the effect of the friction. The equivalent stress for the transition point tended to increase with increasing the friction coefficient, which leads to the significant thickness thinning, even bursting.
2) Plastic yielding firstly occurred in the outer layer of the corner for the rectangular section, and the plastic region expanded with increasing the pressure. The plastic deformation in the inner layer of the corner at each end was observed at last.
3) It is indicated by three-dimensional graphic visualization of the normal stress that the strain state of the corner is shortened in the thickness direction and elongated in the hoop direction. The plastic deformation firstly occurred in the transition point and the equivalent strain is the biggest all the time.
4) It is indicated by the stress locus in the yielding-cylinder that the axial stress of the transition point is tensile stress all the time.
References
[1] AHMETOGLU M, SUTTER K, LI X J, ALTAN T. Tube hydroforming: Current research, applications and need for training [J]. Journal of Materials Processing Technology, 2000, 98: 224-231.
[2] DOHMANN F, HARTL C. Hydroforming-A method to manufacture lightweight parts [J]. Journal of Materials Processing Technology, 1996, 60: 669-676.
[3] DOHMANN F, HARTL C. Tube hydroforming: Research and practical application [J]. Journal of Materials Processing Technology, 1997, 71: 174-186.
[4] YUAN S J, HAN C, WANG X S. Hydroforming of automotive structural components with rectangular-sections [J]. International Journal of Machine Tools & Manufacture, 2006, 46: 1201-1206.
[5] YUAN Shi-jian, HE Zhu-bin, LIU Gang, WANG Xiao-song, HAN Cong. New developments in theory and processes of internal high pressure forming [J]. The Chinese Journal of Nonferrous Metals, 2011, 21(10): 2523-2533. (in Chinese)
[6] LIU G, YUAN S J, TENG B G. Analysis of thinning at the transition corner in tube hydroforming [J]. Journal of Materials Processing Technology, 2006, 177: 688-691.
[7] LIU Gang, YUAN Shi-jian, TENG Bu-gang. Stress analysis on corner of rectangular section in tube hydroforming [J]. Chinese Journal of Mechanical Engineering, 2006, 42(6): 150-155. (in Chinese)
[8] CHEN K K. The effects of friction on bursting of tubes in corner filling [C]//SAE Technical Paper Series. 2003, 2003-01-0688.
[9] CHEN K K. Comparison of shell and solid models for corner fill in tube hydroforming [C]//Proceedings of NUMIFPRM 2004. Ohio, USA, 2004: 1083-1088.
[10] HUANG Y M, CHEN W C. Analysis of tube hydroforming in a square cross-sectional die [J]. International Journal of Plasticity, 2005, 21: 1815-1833.
[11] HWANG Y M, SHR S G, ALTAN T. Analysis on tube hydroforming in a square cross-sectional die [J]. International Journal of Engineering Simulation, 2000, 1: 9-16.
[12] SONG Peng, WANG Xiao-song, HAN Cong, XU Yong-chao, YUAN Shi-jian. Filling behavior of transition corner in hydroforming of aluminum alloy rectangular section tube [J]. Journal of Mechanical Engineering, 2010, 46(12): 59-64. (in Chinese)
[13] WANG Zhong-ren, HE Zhu-bin. 3D figure of normal stress at one point [J]. Journal of Plasticity Engineering, 2002, 10(1): 4-8. (in Chinese)
[14] HE Z B, WANG Z R, TENG B G. A graphic representation of traction for a 3D elastic/plastic stress state [J]. International Journal of Mechanical Engineering Education, 2004, 32(2): 153-159.
[15] WANG Zhong-ren. Physical essence of lode parameter and its effect on plastic flow [J]. Acta Mechanica Solida Sinica, 2006, 27(3): 277-282. (in Chinese).
铝合金矩形截面内高压成形塑性变形规律
王小松1,苑世剑1,宋 鹏2, 谢文才3
1. 哈尔滨工业大学 材料科学与工程学院,哈尔滨 150001;
2. 航天特种材料及工艺技术研究所,北京 100074;
3. 一汽轿车股份有限公司,长春 130011
摘 要:采用实验和固体元数值模拟研究了铝合金矩形截面内高压成形过程塑性变形的发生与发展规律,给出了主应力三维图形可视化表征及在屈服柱面上的应力轨迹,分析了典型点应力及应变状态。结果表明:在矩形截面内高压成形过程中,圆角区外层首先发生屈服,圆角区内层两端部分各约1/4区域最后进入塑性变形。圆角区应变状态为沿着厚向缩短和环向伸长的趋势变化,过渡点最先发生塑性变形并且等效应变始终最大。在变形过程中随着内压的增大,过渡点的轴向应力始终为拉应力。
关键词:铝合金;内高压成形;矩形截面;塑性变形;固体元;正应力图形;应力轨迹
(Edited by YANG Hua)
Foundation item: Project (50975061) supported by the National Natural Science Foundation of China; Project (HIT.NSRIF.201134) supported by the Fundamental Research Funds for the Central Universities, China; Project (2011ZX04001-011) supported by the High-end CNC Machine Tools and Basic Manufacturing Equipment Technology Major Project
Corresponding author: WANG Xiao-song; Tel/Fax: +86-451-86415754; E-mail: hitxswang@hit.edu.cn
DOI: 10.1016/S1003-6326(12)61730-0

