J. Cent. South Univ. Technol. (2010) 17: 381-387
DOI: 10.1007/s11771-010-0056-9 
Field tests on mechanical characteristics and strength parameters of red-sandstone
JIANG Jian-qing(蒋建清)1, 2, YANG Guo-lin(杨果林)1
1. School of Civil and Architectural Engineering, Central South University, Changsha 410075, China;
2. School of Civil Engineering, Hunan City University, Yiyang 413000, China
? Central South University Press and Springer-Verlag Berlin Heidelberg 2010
Abstract: Large-scale field shear tests on ten specimens of the red-sandstone embankment at a highway in Hunan, China, were performed to examine mechanical characteristics and parameters of red-sandstone. The curves of thrust-displacement, failure mode, and shear strength parameters for red-sandstone with different water contents,different compactions, and different grain size distributions were obtained from the tests. A practical procedure of in-situ test for red-sandstone embankment was proposed to normalize the test equipment and test steps. Based on three-dimensional thrust-sliding limit equilibrium method, the formulas for calculating strength parameters of red-sandstone considering three-dimensional sliding surface were inferred. The results show that red-sandstone has typical complete curves of stress-strain, strain softening, which are caused by the special structure of red-sandstone; water content and compaction are important factors for strength and failure mode of red-sandstone; The average value of cohesion and internal friction angle of the specimens calculated by three-dimensional technique are 21.56 kPa and 29.29?, respectively, and those by traditional two-dimensional method are 25.52 kPa and 33.76?, respectively.
Key words: red-sandstone; large-scale field test; mechanical characteristic; strength parameter
1 Introduction
Soil-rock mixtures (SRM), which were very complicated inhomogeneous materials, were widely encountered in geotechnical engineering projects [1-3]. Weathered red-sandstone that can be used as filling of embankments was usually classified as soil-rock mixtures.
In recent years, some researchers have hammered away at the mechanical and structural characteristics of soil-rock mixtures. VALLEJO [4] discussed the occurrence of large particles in rock fill dams, glacial tills and residual soil deposits. VALLEJO [5] examined consolidation and stability characteristics of simulated soil-rock mixtures. VALLEJO and MAWBY [6] analyzed the stability of slopes made of granular material-clay mixtures by laboratory direct-shear strength tests, and found that their shear strength would depend upon the relative concentrations of the large particles and the clay. XU et al [7] found that mechanical properties of soil-rock mixtures may be influenced by the critical particle sizes through in-situ tests. ALTMAN et al [8] used synchrotron-source X-ray computerized microtomography (CMT) to evaluate the adsorptive properties of aggregate soil samples. LANARO and TOLPPANEN [9] developed a new and accurate characterization method for dimensions, shape and roughness of aggregate particles based on the 3D-laser scanning technique. XU et al [10] introduced the technique of digital image processing based on the finite element method (DIP-FEM) to study soil-rock mixtures, and analyzed statistically the microstructural characteristics of the SRM. SPRINGMAN et al [11] carried out a combination of field and laboratory tests to investigate the triggering effect of rainfall on shallow slips in alpine moraine slopes. YUE et al [12] presented a digital image processing based finite element method for the two-dimensional mechanical analysis of geomaterials by actually taking into account their inhomogeneities and microstructures.
The above studies played a far-reaching role in the engineering applications of soil-rock mixtures. However, the soil-rock mixture posed difficulties of in-situ sample acquisition and in-laboratory geomaterial tests, and the study of the SRM’s mechanical properties was still at an early stage. What’s more, up to date, very few investigations on the mechanical characteristics and strength parameters of weathered red-sandstone have been reported in literatures. ZHAO et al [13] investigated the properties of red-sandstone, such as structures and compositions and disintegration characteristics through a series of laboratory tests. CHEN et al [14] studied the rheological properties of red stone granular soil through executing a series of rheological experiments on a large triaxial rheological apparatus. ZHANG et al [15] performed complete stress-strain tests under different confining pressures with a multi-function apparatus RMT in order to explore the characteristics of fatigue deformation of red-sandstone under triaxial compression with cyclic loading. YU et al [16] carried out direct shear tests on red sand silty clay with various geosynthetics to investigate its strength and deformation performances. It was obvious that the studies on red-sandstone were lagged behind on its engineering applications.
In this work, ten large-scale in-situ tests on red-sandstone embankment of a highway were carried out in the interest of its mechanical characteristics and strength parameters. Method for determining shear strength of red-sandstone was developed based on the three-dimensional thrust-sliding limit equilibrium. The relative factors influencing shear strength of red- sandstone were analyzed.
2 Field testing programme
2.1 Test materials
The red-sandstone used in the tests appeared as calcium-mud state, easy-weathered and easy- disintegrated. The maximum dry density of the soil was 1.98 g/cm3. The optimum water content was 18.13%. The average liquid limit and plastic limit were 34.5% and 22.5%, respectively. The representative particle distribution curves of the ten specimens are shown in Fig.1, and the other main physical properties of the specimens are summarized in Table 1.
2.2 Specimen preparation and test device installation
2.2.1 Specimen excavation
Ten test sites were chosen on the top surface of the highway embankment. Afterwards, the compaction of the specimens was measured through filling sand method, and the grain size distribution and water content of the specimens’ representative parts were analyzed. Then, three grooves with a depth of 80 cm were excavated at
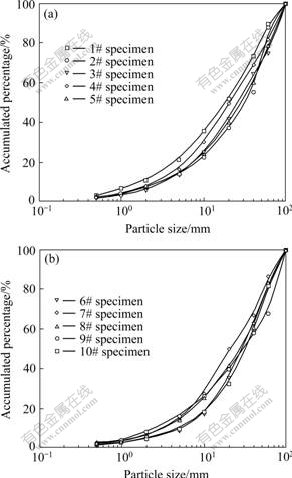
Fig.1 Grain-size distribution curves of specimens: (a)Specimens 1#-5#; (b) Specimens 6#-10#
2.2.2 Test device installation
After the specimen was excavated at the test site, a piece of steel plate with dimensions of 0.8 m×1.2 m× 0.045 m (height×width×thickness) was fixed at the frontispiece of the specimen. Then, the jack was carried onto the stow-wood located at the bottom of the frontispiece groove. The horizontal axis of jack was the test site (Fig.2(a)). The width of the two side grooves was 70 cm, and that of the front groove was 50 cm. All the ten specimens’ dimensions were defined to be 80 cm, 120 cm and 150 cm, in height, width and length, respectively. The two side surfaces of the specimen were plastered with wet clay so as to smooth them. adjusted to be perpendicular to the front steel plate. The installation of the other steel plate with dimensions of 1.4 m×1.5 m×0.045 m (height×width×thickness) clinging to the jack rearward was followed. Two steel tubes as the displacement reference of the specimen were hammered into in the bottom of the frontispiece groove. A dial indicator was fixed at one third height of each steel tube. At last, two pieces of 12 mm-thick toughened glass were installed to the side faces and fixed with rigid braces (Fig.2(b)).
Table 1 Basic physical properties of specimens


Fig.2 Sketches of field test: (a) Specimen excavation; (b) Test device installation
2.3 Load and unload procedure
After the test devices were installed, horizontal thrust was gradually imposed to the specimen by the jack. The criterion of load velocity was to control the horizontal displacement of the specimen within 0.15 to 0.20 mm/s. The manometer of the jack was read when the horizontal displacement increased at each 3 mm. With the gradual increase of the displacement, the peak thrust (Pmax) will occur when the manometer’s reading does not increase but decreases. The load process was ceased when approaching the specimen’s residual strength. Whereafter the manometer’s reading will drop to a steady value, i.e. the minimum thrust (Pmin). The load and unload process was repeated again and again as far as obtaining a clear boundary between the sliding body and the stable part. Afterwards, the test equipment was dismantled, and the upside sliding body was removed. Eventually, the three-dimensional coordinate information of the sliding plane was recorded.
3 Results and discussion
3.1 Strength and deformation characteristics of specimens
The representative thrust-displacement curves of the specimens are shown in Fig.3. The strength characteristics of the red-sandstone granular soil by comparing those curves are analyzed as follows.

Fig.3 Typical thrust-displacement curves of specimens: (a) Specimen 5#; (b) Specimen 6#; (c) Specimen 7#; (d) Specimen 8#
(1) The development trend of the full thrust-displacement curve is shown as four significant stages. The first is linear elastic deformation stage, and the relationship between thrust and displacement is approximately linear in this stage. Whereas, there is a short nonlinear deformation phase at the initial load stage because of the initial compaction. The second is elastic-plastic deformation stage. Cracks occur on the specimen’s top surface, but its development is slow in this stage. The third is peak strength stage in which the spread of the cracks is speeded up and the increasing velocity of the thrust is obviously less than that of the displacement. The end one is strain softening stage in which the thrust gradually decreases to its residue strength with the increase of displacement.
(2) There are some differences in the thrust-displacement curves of different specimens. The slope of the elastic-plastic deformation stage varies lightly, but the peak strength changes evidently, which is mainly caused by the variation of grain size distribution, water content and compaction of the specimen. For instance, the maximum thrust value of specimen 5# is 110 kN, but that of specimen 6# is 166 kN.
The crack development is observed during the whole test by monitoring the top observed surface and the side toughened glass (Fig.4). It is found that some local cracks appear at the first, and with the cracks expanding a complete slide surface is followed. In order to deeply investigate the deformation and failure mechanism of red-sandstone, the three-dimensional slide surface is described. The irregular slide surface often appears because red-sandstone is a inhomogeneous soil-rock mixture (Fig.4(b)).
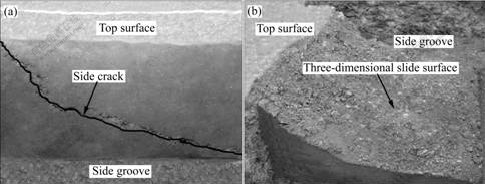
Fig.4 Typical failure mode: (a) Slide crack; (b) Three-dimensional slide surface
3.2 Three-dimensional analysis of test results
3.2.1 Three-dimensional discrete for sliding-body
Three-dimensional limit equilibrium method has been widely applied to analyzing the slope stability at present [17-18]. The coordinate system with origin located at the lower right corner of the specimen is established. The positive direction of x axis is parallel to the action orientation of the horizontal thrust, that of y axis is opposite to gravity direction, and z axis accords with right-hand rule (Fig.5).

Fig.5 Coordinate system and geometrical size of specimen
From the three-dimensional slide surface measurement, it is understood that the slide-surface is irregular, whereas some almost circular arcs will be obtained by slicing the slide surface with some planes parallel to plane xy (Fig.6). Therefore, the slide-body is also discreted by a series of planes that are parallel to or perpendicular to plane xy (Fig.7(a)), and the bottom surface of each column is simplified as a cylindrical face which is defined as follows. The slide-body is dividedinto m columns whose intersecting line with the specimen’s top surface is assumed to be parallel to specimen’s front plane (Fig.7(b)); the center of the jth column is the intersecting point of line lde and line lojf, which is the perpendicular bisector of line-segment lcd (Fig.7(c)).
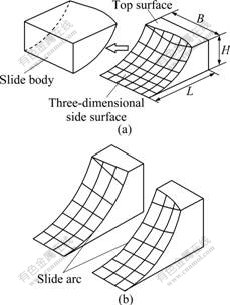
Fig.6 Sketches of typical three-dimensional slide surface: (a) Slide body removing; (b) Slide arc in slide surface by cutaway view

Fig.7 Three-dimensional discrete method: (a) Slide body three-dimensional discrete; (b) Dimensions of the jth column piece; (c) Slide center of the jth column piece
3.2.2 Calculation formula for strength parameters (c and 
The following assumptions are made in the present analysis.
(1) The specimen’s stress state will be in limit equilibrium when the horizontal thrust approaches the maximum (Pmax), and the failure criterion is satisfied with Mohr-Coulomb rule.
(2) The horizontal thrust (Pj) distributed to each column is proportional to its gravity.
(3) The tangential force Tij acted on the bottom surface of each column is parallel to plane xy (Fig.8).

Fig.8 Force system sketch of the jth column piece
The difference between the maximum of horizontal thrust (Pmax) and its stable value (Pmin) reflects the interface frictional performance on slide surface [19], therefore, cohesion of the specimen could be calculated using the following formula:
 (1)
(1)
where c is the cohesion of the specimen, m is the number of columns discrete from the slide body, n is the number of rows discrete from the jth column piece, and Aij is the bottom area of the ith row of the jth column piece.

 (2)
(2)
where the meanings of Bj, Rj, Lij and θi are shown in Figs.7 and 8.
Safety factor Fs is defined as follows:
Fs=τf/τr (3)
where τf and τr are the shear strength and the shear stress on the slide surface, respectively. As for the whole slide body,


(4)
where gij and lij are the gravity and arc length of the ith row of the jth column piece, respectively, G is the gravity of the whole slide body, and  is the internal friction angle of the specimen.
The safety factor Fs will be equal to 1.0 when the specimen is in limit equilibrium state. Substituting Fs=1.0 into Eq.(4) yields
(5)
3.3 Calculation results of strength parameters (c and 
The strength parameters of the specimens calculated using Eqs.(1) and (5) are listed in Table 2, and those calculated by traditional two-dimensional method (Ref.[19]) are also shown. Comparison between the two kinds of results shows that the parameters by three-dimensional method are less than those by traditional method. Since the three-dimensional method takes into account the three-dimensional information of the slide surface, the calculation results are more reliable. Therefore, the presented method is more suitable for determining the strength parameters of red sandstone in field test.
Table 2 Calculation results of shear strength parameters obtained from push-shear tests

It is also found that water content and compaction of the embankment have obvious effects on strength parameters of the red-sandstone. Cohesion and internal friction angle increase along with decrease of water content of the specimen (Fig.9(a)), and rise along with enhance of its compaction (Fig.9(b)).

Fig.9 Influencing factors of strength parameters: (a) Water content; (b) Compaction
4 Conclusions
(1) Large-scale field shear test is an efficient method to investigate mechanical characteristics and shear strength parameters of red-sandstone.
(2) The mechanical properties of red-sandstone appear as full thrust-displacement curve, stress yield and plastic deformation.
(3) Cohesion and internal friction angle increase along with the decrease of water content of the specimens, and rise along with the enhancement of compaction of the specimens.
(4) The strength parameters of red-sandstone at the same site will vary to some extent. Therefore, it is feasible to select the least favorable combination about c andφ from large-scale field test results when analyzing the stability of the red-sandstone soil embankment.
(5) The discreteness of the strength parameters by three-dimensional analysis method presented in this work is obvious less than that by traditional method, which shows that the presented method is more reliable.
References
[1] DONG Ze-fu, LIU Duo-wen. Study on engineering character of “Red Rock” for embankment [J]. Journal of Hunan University: Natural Sciences, 2003, 30(3): 90-93. (in Chinese)
[2] XU Wen-jie, HU Rui-lin, TAN Ru-jiao, ZENG Ru-yi, YU Huo-qing. Study on field test of rock-soil aggregate on right bank of Longpan in tiger-leaping gorge area [J]. Chinese Journal of Rock Mechanics and Engineering, 2006, 25(6): 1270-1277. (in Chinese)
[3] LI Xiao, LIAO Qiu-lin, HE Jian-ming, CHEN Jian. Study on in-situ tests of mechanical characteristics on soil-rock aggregate [J]. Chinese Journal of Rock Mechanics and Engineering, 2007, 26(12): 2377-2384. (in Chinese)
[4] VALLEJO L E. An explanation for mudflows [J]. Geotechnique, 1979, 29(4): 351-354.
[5] VALLEJO L E. Extension of the particulate model of stability analysis for mudflows [J]. Soils and Foundations, 1989, 29(3): 1-13.
[6] VALLEJO L E, MAWBY R. Porosity influence on the shear strength of granular material-clay mixtures [J]. Engineering Geology, 2000, 58(2): 125-136.
[7] XU W J, HU R L, TAN R J. Some geomechanical properties of soil-rock mixtures in the Hutiao Gorge area, China [J]. Geotechnique, 2007, 57(3): 255-264.
[8] ALTMAN S J, RIVERS M L, RENO M D, CYGAN R T, MCLAIN A A. Characterization of adsorption sites on aggregate soil samples using synchrotron X-ray computerized microtomography [J]. Environmental Science and Technology, 2005, 39(8): 2679-2685.
[9] LANARO F, TOLPPANEN P. 3D characterization of coarse aggregates [J]. Engineering Geology, 2002, 65(1): 17-30.
[10] XU W J, YUE ZH Q, HU R L. Study on the mesostructure and mesomechanical characteristics of the soil-rock mixture using digital image processing based finite element method [J]. International Journal of Rock Mechanics and Mining Sciences, 2008, 45(5): 749-762.
[11] SPRINGMAN S M, JOMMI C, TEYSSEIRE P. Instabilities on moraine slopes induced by loss of suction: A case history [J]. Geotechnique, 2003, 53(1): 3-10.
[12] YUE ZH Q, CHEN S, THAM L G. Finite element modeling of geomaterials using digital image processing [J]. Computers and Geotechnics, 2003, 30(5): 375-397.
[13] ZHAO M H, ZOU X J, ZOU P X W. Disintegration characteristics of red sandstone and its filling methods for highway roadbed and embankment [J]. Journal of Material in Civil Engineering, ASCE, 2007, 19(5): 404-410.
[14] CHEN X B, ZHANG J S, LIU B C, TANG M X. Effects of stress conditions on rheological properties of granular soil in large triaxial rheology laboratory tests [J]. Journal of Central South University of Technology, 2008, 15(s1): 397-401.
[15] ZHANG Qing-xu, GE Xiu-run, HUANG Ming, SUN Hong. Testing study on fatigue deformation law of red-sandstone under triaxial compression with cyclic loading [J]. Chinese Journal of Rock Mechanics and Engineering, 2006, 25(3): 473-478. (in Chinese)
[16] YU Ze-hong, WEI Hong-wei, ZOU Yin-sheng. Characteristics of shear strength and deformation of reinforced red sand silty clay with geosynthetics [J]. Chinese Journal of Rock Mechanics and Engineering, 2005, 24(15): 2770-2779. (in Chinese)
[17] CHEN Zu-yu, MI Hong-liang, WANG Xiao-gang. A three-dimensional limit equilibrium method for slope stability analysis [J]. Chinese Jounal of Geotechnical Engineering, 2001, 23(5): 525-529. (in Chinese)
[18] ZHANG Fa-ming, CHEN Zu-yu, MI Hong-liang. 3-D limit equilibrium theory and its application in block stability analysis [J]. Hydrogeology and Engineering Geology, 2002, 29(4): 33-35. (in Chinese)
[19] CHANG Shi-biao. Engineering geologic handbook [M]. 3rd ed. Beijing: China Architecture and Building Press, 1992. (in Chinese)
Foundation item: Project(200612) supported by Hunan Province Transportation Department of China
Received date: 2009-04-08; Accepted date: 2009-06-19
Corresponding author: JIANG Jian-qing, Doctoral candidate; Tel: +86-13517377492; E-mail: lh201314@163.com
(Edited by YANG You-ping)

