Trans. Nonferrous Met. Soc. China 24(2014) 2581-2587
Fabrication and photodegradation properties of TiO2 nanotubes on porous Ti by anodization
Guo-jian CAO1, Bo CUI2, Wen-qi WANG2, Guang-ze TANG2, Yi-cheng FENG1, Li-ping WANG1
1. School of Materials Science and Engineering, Harbin University of Science and Technology, Harbin 150040, China;
2. School of Materials Science and Engineering, Harbin Institute of Technology, Harbin 150001, China
Received 2 August 2013; accepted 27 February 2014
Abstract: Both Ti foil and porous Ti were anodized in 0.5%HF and in ethylene glycol electrolyte containing 0.5%NH4F (mass fraction) separately. The results show that TiO2 nanotubes can be formed on Ti foil by both processes, whereas TiO2 nanotubes can be formed on porous Ti only in the second process. The overhigh current density led to the failure of the formation nanotubes on porous Ti in 0.5%HF electrolyte. TiO2 nanotubes were characterized by SEM and XRD. TiO2 nanotubes on porous Ti were thinner than those on Ti foil. Anatase was formed when TiO2 nanotubes were annealed at 400 ��C and fully turned into rutile at 700 ��C. To obtain good photodegradation, the optimal heat treatment temperature of TiO2 nanotubes was 450 ��C. The porosity of the substrates influenced photodegradation properties. TiO2 nanotubes on porous Ti with 60% porosity had the best photodegradation.
Key words: TiO2 nanotubes; anodization; photodegradation; porous Ti
1 Introduction
TiO2 has become the focus of researches because of its highly potential applications as self-cleaning surfaces and indoor purification materials, and the devices of deodorization and sterilization. In particular, the utilization in photocatalysis to purify air and water appears to be very attractive [1-3]. There are three crystalline phases in titanium oxides, including anatase, rutile and brookite. The anatase phase has a higher photocatalytic property than the others due to its high refraction index and low extinction coefficient. Unfortunately, the anatase phase tends to transform to the rutile owing to its thermodynamical instability at high temperature [4,5]. It was reported that a mixture of anatase and rutile phases exhibits the highest photocatalytic activity [6]. However, the shortcomings of TiO2 have become obstacles to large area applications, including difficulty of stirring during reaction, separation after reaction, low efficiency in light region and low surface area [7,8]. Previous researches indicated that TiO2 could improve its absorption spectrum by doping with some particular elements [9,10]. Increasing material surface area is also an effective means of improving photocatalytic efficiency. Nanometer materials are explored, such as nano particles and nano thin films [11-13]. In order to further improve surface area, TiO2 nanotubes are fabricated on porous Ti substrate by anodization [14]. In this work, a detailed study is performed to evaluate methods of forming TiO2 nanotubes on the porous Ti and Ti foil in different electrolytes. Moreover, surface morphology, crystal structure and photocatalytic properties of TiO2 nanotubes fabricated on different substrates by anodization are investigated.
2 Experimental
2.1 Fabrication of porous Ti
Porous Ti was prepared by powder metallurgy using titanium powder with a diameter of 100 ��m. The spacer material was ammonium hydrogen carbon (NH4HCO3) particles with 200 ��m in diameter. After being blended thoroughly, the mixed particles were pressed at 200 MPa for 5 min. Afterwards, the compacted samples were two-step dried to eliminate NH4HCO3, firstly at 60 ��C for 6 h and then at 120 ��C for another 6 h. At last, the samples were sintered at 1250 ��C in vacuum for 2 h. The volume fractions of NH4HCO3 were designed as 30%, 60% and 80%. The as-sintered porous Ti was cut into slices by wire-electrode cutting (20 mm �� 20 mm �� 0.2 mm).
2.2 Preparation of TiO2 nanotubes on porous Ti and Ti foil
Ti foil (20 mm �� 20 mm, 99.6% purity) and porous Ti were degreased by sonicating in acetone and anhydrous ethanol for 10 min, respectively, followed by chemical polishing in a mixture of HF and nitric acid (volume ratio of HF to HNO3=1:3) for 5 min, after which they subsequently rinsed with deionized water (DI) and then dried in a nitrogen stream. The anodization was performed in a standard two-electrode bath, with Ti as the working electrode and graphite as the counter electrode. Two anodization processes were adopted to perform on Ti foil and porous Ti. One process was carried out in an electrolyte of acetic acid+0.5%HF mixed in 1:7 volume ratio. Samples were anodized at the voltage of 20 V for 40 min. The other process was conducted in an ethylene glycol electrolyte containing 0.5% NH4F at ethylene glycol/water ratio of 4:1 for 2 h. Both processes were performed at 30 ��C. During the whole process, the voltage should be adjusted to keep the figure constant and the electrolyte was stirred by a magnetic stirrer. Based on the following morphological observation, the process in the NH4F electrolyte was the only access to form TiO2 nanotubes on the porous Ti. Therefore, the comparison of the morphology, crystal structure and photocatalytic properties will focus on TiO2 nanotubes on different substrates fabricated by the second anodization process.
2.3 Morphological, structural and photocatalytic characterization
The morphologies of porous Ti and the anodized TiO2 nanotubes in different electrolytes were characterized by a field emission scanning electron microscope (Siron, FEI). The crystal structures of TiO2 nanotubes on different substrates were analyzed by X-ray diffraction (XRD). The mass fraction of the anatase and rutile phases of TiO2 nanotubes can be estimated with the equation: XA=(1+1.26IR/IA)-1 where XA is the mass fraction of the anatase phase, and IA and IR stand for the strongest peak intensities of (101) anatase and (110) rutile, respectively [15]. The specific surface areas of TiO2 nanotubes formed on different substrates were determined by BET (BELsorp Mini II, Japan). The photocatalytic efficiency was studied by the degradation of Rhodamine B (RB) under ultraviolet irradiation (253.7 nm) for 5 h. The optical absorption values of RB solution were tested by spectrophotometer, and photodegradation percentage of TiO2 nanotubes was estimated by the initial and final concentration calculated by the optical absorption values.
3 Results and discussion
3.1 Morphology of porous Ti
The morphology of as-sintered porous Ti is shown in Fig. 1. It can be seen that the material is very loose, in which pore size corresponds to the size of NH4HCO3 particles. Ti powder keeps spherical shape with smooth surface. Sintering neck is obviously seen.

Fig. 1 SEM image of as-sintered porous Ti
3.2 Anodization of Ti foil and porous Ti
3.2.1 Anodization of Ti foil
The morphology of anodized surface of Ti foil in the 0.5%HF is shown in Fig. 2. As it is revealed, highly-ordered TiO2 nanotubes are formed on Ti foil. From Fig. 2(a), it can be seen that TiO2 nanotubes is 100 nm in diameter and 14 nm in wall thickness. Besides, the length of TiO2 nanotubes which is 350 nm can be observed in Fig. 2(b).
3.2.2 Anodization of porous Ti
The surface morphology of anodized porous Ti is shown in Fig. 3. From Fig. 3, there is no TiO2 nanotubes instead of obviously severe corrosion pits and cracks on Ti powder surface. In addition, sintering neck becomes significantly thinner than that as-sintered. A discontinuous oxide film is formed on the surface of Ti powder as shown in Fig. 3(b).
Highly-ordered TiO2 nanotubes can be obviously seen on the surface of anodized Ti foil in 0.5%NH4F electrolyte, as shown in Fig. 4. The diameter and the wall thickness of the TiO2 nanotubes estimated from Fig. 4(a) are about 78 nm and 19 nm, respectively. The length of the TiO2 nanotubes is around 2.5 ��m (Fig. 4(b)). Compared with TiO2 nanotubes formed on Ti foil in 0.5%HF electrolyte, TiO2 nanotubes are smaller in diameter and thicker in wall thickness, but longer in length. The reason for the differences is that HF electrolyte is more corrosive than NH4F electrolyte.

Fig. 2 SEM images of TiO2 nanotubes formed on Ti foil in 0.5%HF

Fig. 3 SEM images of anodized porous Ti in 0.5%HF under 20 V and 30 ��C for 40 min

Fig. 4 SEM images of TiO2 nanotubes formed on Ti foil in ethylene glycol electrolyte
After being anodized in 0.5%NH4F electrolyte, spherical Ti powders turn into polygonal with cracks on the surface and sintering neck becomes thinner (Fig. 5(a)). The surface morphology of one Ti particle is magnified and shown in Fig. 5(b). It is notable that highly-ordered TiO2 nanotubes are formed on the surface of anodized Ti powders. Cracks can be viewed on the surface of anodized porous Ti. The diameter and the wall thickness of the TiO2 nanotubes on porous Ti are 95 nm and 17 nm, respectively. The length of the TiO2 nanotubes is longer than 800 nm. The enlargement of sintering neck is shown in Fig. 5(c). Not only the smooth part of titanium particles but the sintering neck is covered with TiO2 nanotubes. Owing to the uneven geometrical surface of porous Ti and corresponding nonuniform charge distribution, TiO2 nanotubes stay no longer in parallel. Nevertheless, the local growth condition of nanotubes showing a partial order is identical. The overall growth direction is perpendicular to the spherical surface.
Table 1 shows the BET surface areas of Ti foil and porous Ti with different porosities before and after anodization. It can be noticed that the BET surface area of some samples could not be obtained. The BET surface areas of Ti foil before and after anodization are invalid. The reason is that the BET surface area values of these samples are too small to be tested. Only the BET surface areas of porous sample with 80% porosity before anodization can be measured.

Fig. 5 SEM images of anodized porous Ti in ethylene glycol electrolyte
Table 1 BET surface area of Ti foil and porous Ti with different porosities before and after anodization

The nitrogen adsorption/desorption isothermal curves of porous Ti with different porosities after anodization are shown in Fig. 6. The curves are typical type IV isotherm representing mesoporous structure with large BET specific surface area. Compared with the BET surface area of porous Ti with porosity of 80%, the value increased a lot when TiO2 nanotubes formed on the porous Ti with porosity of 80%. Meanwhile, after anodization processes, the BET surface area of the porous Ti increases with increasing porosity. Since the BET surface area of the anodized Ti foil could not tested, it is reasonable to deduce that the BET surface area can increase with introducing porosity.
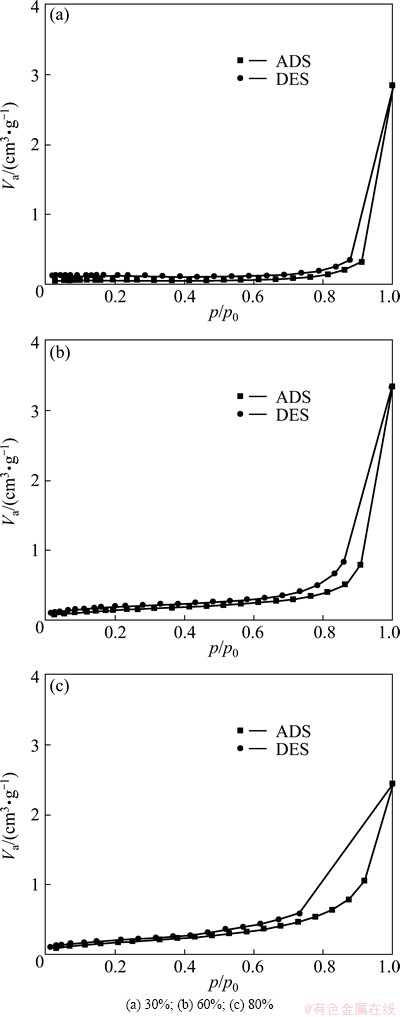
Fig. 6 Nitrogen adsorption (ADS)/desorption (DES) isothermal curves of porous Ti with different porosities after anodization
3.2.3 Current density vs time for different anodization processes
Figure 7 shows the typical potentiostatic current density-time plot for a titanium electrode in 0.5%NH4F and 0.5%HF at 20 V on Ti foil and porous Ti. The curves are similar in their trends. Compared with another anodization process, the current density of the process of porous Ti in HF has the highest point at the beginning and stable stage. Apart from this, the current density of Ti foil in HF is higher than that of porous Ti in NH4F, and the value of Ti foil in NH4F is the lowest. Since current density represents the speed of dissolution, it can be concluded that the higher the current density is, the greater the dissolution speed will be. Thereby, the higher the current density is, the thinner and shorter the TiO2 nanotubes will become. These results correspond with the SEM images above. The overhigh current density leads to the higher chemical dissolution rate, which represents that the chemical dissolution proceeds faster than electrochemical etch and breaks the dynamic balance of anodization process, which consequently make nanotubular structure break down. This is the reason why TiO2 nanotubes cannot be formed on porous Ti in HF.
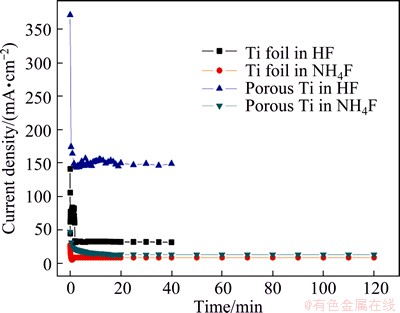
Fig. 7 Typical potentiostatic (20 V) current density-time response for different anodization processes
3.3 Crystal structure of TiO2 nanotubes on different substrates
The XRD patterns of TiO2 nanotubes annealed at different temperatures are exposed in Fig. 8 (T for foil and PT for porous Ti). TiO2 nanotubes are amorphous after annealing at 300 ��C as Ti peaks merely are observed. With annealing temperature further increasing to 400 ��C, the anatase phase (A) appears. The anatase phase transforms to the rutile phase (R) at 450 ��C. By the time of the annealing temperature rising to 700 ��C, the anatase has disappeared and the rutile becomes the major phase. From the XRD analysis of nanotubes on Ti foil and porous Ti annealed at 450 ��C, the phase composition of TiO2 nanotubes on porous Ti is similar to that of TiO2 nanotubes on Ti foil. Therefore, the annealing treatment has little influence on the crystal structure and the phase composition of porous Ti.

Fig. 8 XRD patterns of TiO2 nanotubes on Ti foil and porous Ti annealed for 3 h at different temperatures
3.4 Photocatalytic properties of TiO2 nanotubes on different substrates
The degradation of TiO2 nanotubes on Ti foil annealed at different temperatures is shown in Fig. 9(a). The photodegradation increases with the time extension. The sample annealed at 450 ��C performs the best photocatalytic efficiency, and the photodegradation is 92.12% after 5 h irradiation. This results is similar to the research result of WU [16] and PANG et al [17]. The degradation percentages of samples annealed at 400, 500 and 550 ��C are 77.93%, 90.69% and 54.42%, respectively. Based on the above results, the mixture of anastse and rutile performs the best photocatalytic activity. These results are consistent with the ones by LIANG and LI [18]. The estimated mass fractions of anatase and rutile estimated are 53% and 47%, respectively. The degradation declines with increasing annealing temperature because of the loss of the anatase seen from XRD patterns.
The porosities of porous Ti samples annealed at 450 ��C are 30%, 60% and 80%. The photodegradation properties of different porous Ti samples are shown in Fig. 9(b). The degradation percentages are 77.10%, 96.69% and 91.97% after 5 h ultraviolet irradiation, respectively. The degradation rate of 80% porosity is equivalent to the optimal photodegradation of the sample on Ti foil. The sample of 60% porosity has the best photodegradation. This is due to the fact that the connectivity of the sample with 60% or 80% porosity is better than that of sample with 30% porosity. Closed holes are difficult to improve the effective surface area on 30% porosity. In result, the BET specific surface area of anodized porous Ti with porosity of 30% is lower than the other anodized porous Ti. Meantime, the RB solution is hard to immerse in the pores. Consequently, these factors make the photodegradation of anodized porous Ti with 30% porosity lower than that of TiO2 nanotubes on Ti foil. Although 80% porosity has the highest BET specific surface area, higher porosity results in loose surface structure so that the RB solution in partial TiO2 nanotubes accepts less ultraviolet irradiation. Besides, the degradation process was conducted in RB solution without stirring, the loose structure made the diffusion of RB to the surface of TiO2 nanotubes and the diffusion of out of the pores difficult. Thus, the photodegradation of 80% porosity is less than that of 60% porosity. The wall thickness of nanotubes also plays an important role in the photocatalytic activity for the reason that the thinner wall is beneficial to move excited electron and free carriers and TiO2 nanotubes on porous Ti with thinner wall thickness can enhance the photocatalytic activity [19].
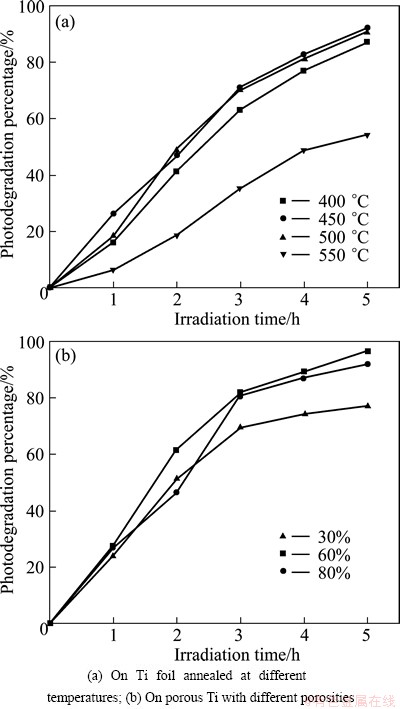
Fig. 9 Photodegradation of TiO2 nanotubes under 5 h ultraviolet irradiation
4 Conclusions
1) TiO2 nanotubes can be formed on Ti foil by anodization in 0.5%HF electrolyte, while no TiO2 nanotubes are formed on porous Ti. It is the overhigh current density that plays a key role in TiO2 nanotubes formation by the anodization method. The overhigh current density can dissolve the ahead formed nanotubes.
2) TiO2 nanotubes can be formed on Ti foil as well as on porous Ti by anodization in 0.5%NH4F electrolyte. TiO2 nanotubes formed on porous Ti are thinner and shorter than those formed on Ti foil.
3) The mass fraction of anatase and rutile of optimal photodegradation are 53% and 47% at the annealing temperature of 450 ��C. The rutile becomes larger in quantity as the annealing temperature increases, thus it will limit the photocatalytic activity of TiO2 nanotubes.
4) TiO2 nanotubes on porous Ti can improve surface area to a greater extent, and TiO2 nanotubes formed on porous Ti with 60% porosity performs the best photodegradation.
References
[1] FUIJISHIMA A, RAO T N, TRYK D A. Titanium dioxide photocatalysis [J]. Journal of Photochemistry and Photobiology C: Photochemistry Reviews, 2000, 1: 1-21.
[2] MOR G K, VARGHESE OOMMAN K, PAULOSE M, SHANKAR K, GRIMES C A. A review on highly ordered, vertically oriented TiO2 nanotube arrays: Fabrication, material properties, and solar energy applications [J]. Solar Energy Materials and Solar Cells, 2006, 90: 2011-2075.
[3] TAO Hai-jun, TAO Jie, WANG Tao, WANG Ling, QIN Liang, XU Lu-lu. Fabrication of self-organized TiO2 nanotubes by anodic oxidation and their photocatalysis [J]. Transactions of Nonferrous Metals Society of China, 2005, 15: 462-466
[4] ZHAO Bao-xing, ZHOU Ji-cheng, CHEN Yu, PENG Yin-qiao. Effect of annealing temperature on the structure and optical properties of sputtered TiO2 films[J]. Journal of Alloys and Compounds, 2011, 509: 4060-4064.
[5] MATHEWS N R, MORALES E R,  M A, TOLEDO ANTONIO J A. TiO2 thin films�CInfluence of annealing temperature on structural, optical and photocatalytic properties [J]. Solar Energy, 2009, 83: 1499-1508.
[6] BAKARDJIEVA S,  DIANEZ M J, SAYAGUES M J. Photoactivity of anatase�Crutile TiO2 nanocrystalline mixtures obtained by heat treatment of homogeneously precipitated anatase [J]. Applied Catalysis B: Environmental, 2005, 58: 193-202.
[7] LEE B G, CHOI J W, LEE S E, JEONG Y S, OH H J, CHI C S. Formation behavior of anodic TiO2 nanotubes in fluoride containing electrolytes [J]. Transactions of Nonferrous Metals Society of China, 2009, 19: 842-845.
[8] LAI Yue-kun, SUN Lan, CHEN Yi-cong, ZHUANG Hui-fang, LIN Chang-jian, CHIN J W. Effects of the structure of TiO2 nanotube array on Ti substrate on its photocatalytic activity [J]. Journal of the Electrochemical Society, 2006, 153: D123-D127.
[9] LIU Fang, LAI Shu-ting, HUANG Pei-lin, LIU Ying-ju, XU Yue-hua, FANG Yue-ping, ZHOU Wu-yi. Fabrication and photocatalytic activity of TiO2 derived nanotubes with Ag ions doping [J]. Journal of Nanoscience and Nanotechnology, 2012, 12: 8391-8395.
[10] DONG Lin, CAO Guo-xi, MA Ying, JIA Xiao-lin, YE Guo-tian, GUAN Shao-kang. Enhanced photocatalytic degration properties of nitrogen-doped titania nanotube arrays [J]. Transactions of Nonferrous Metals Society of China, 2009, 19: 1583-1587.
[11] ZENG Meng-xiong, LI You-ji, MA Ming-yuan, CHEN Wei, LI Lei-yong. Photocatalytic activity and kinetics for acid yellow degradation over surface composites of TiO2-coated activated carbon under different photocatalytic conditions [J]. Transactions of Nonferrous Metals Society of China, 2013, 23: 1019-1027.
[12] TAO Jie, DENG Jie, DONG Xiang, ZHU Hong, TAO Hai-jun. Enhanced photocatalytic properties of hierarchical nanostructured TiO2 spheres synthesized with titanium powders [J]. Transactions of Nonferrous Metals Society of China, 2012, 22: 2049-2056.
[13] CHEN X B, MAO S S. Titanium dioxide nanomaterials: Synthesis, properties, modifications, and applications [J]. Chemical Reviews, 2007, 107: 2891-2959.
[14] FAN Xing-ping, FENG Bo, WANG Jie, WANG Jian-xin, LU Xiong. Processing and properties of porous titanium with high porosity coated by bioactive titnia nanotubes [J]. Materials Letters, 2011, 65: 2899-2901.
[15] ZACHARIASEN W H. Theory of X-ray diffraction in crystals [M]. New York: Dover Phoenix, 2004: 103-135.
[16] WU Lian-ping. Preparation TiO2 nanotube arrays by anodization [D]. Yanbian: Yanbian University, 2009: 26-28 (in Chinese)
[17] PANG Y L, ABDULLAH A Z, BHATIA S. Effect of annealing temperature on the characteristics, sonocatalytic activity and reusability of nanotubes TiO2 in the degradation of Rhodamine B [J]. Applied Catalysis B: Environmental, 2010, 100: 393-402.
[18] LIANG Hai-chao, LI Xiang-zhong. Effects of structure of anodic TiO2 nanotube arrays on photocatalytic activity for the degradation of 2,3-dichlorophenol in aqueous solution [J]. Journal of Hazardous Materials, 2009, 162: 1415-1422.
[19] SREEKANTAN S, HAZAN R, LOCKMAN Z. Photoactivity of anatase�Crutile TiO2 nanotubes formed by anodization method [J]. Thin Solid Films, 2009, 518: 16-21.
����ѱ���TiO2���ܵ����������Ʊ����������
�ܹ���1���� ��2��������2���ƹ���2�������1������Ƽ1
1. ������������ѧ ���Ͽ�ѧ�빤��ѧԺ�������� 150040��
2. ��������ҵ��ѧ ���Ͽ�ѧ�빤��ѧԺ�������� 150001
ժ Ҫ���Զ���ѱ����Ʊ�TiO2���ܵ������������ս����о��������ֵ������Һ�в��������������ֱ�Զ���Ѻ��Ѳ����б��洦����һ�ֵ������Һ�Ǻ���0.5%HF�ı����ᣬ��һ�ֵ������Һ�Ǻ���0.5%NH4F(��������)���Ҷ�����Һ(��ˮ�����4:1)��������������ַ������Ѳ��϶���������TiO2���ܣ�������ѱ���ֻ����NH4F�������Һ���������ܣ�HF��Һ�й��ߵĵ����ܶ��������ڶ���ѻ������������ɵ���Ҫԭ����ɨ�����������X���������ǶԲ�ͬ�����ϵ�TiO2���ܽ��б���������Ѳ������ϵ����ܹܱڣ�������ϵ����ܹܱڸ����������Ʊ���TiO2�ȴ����о����������ѿ�����400 ��Cʱ�γɣ�����700 ��C��ȫת��Ϊ���ʯ�ࡣ��450 ��C�ȴ�����Ʒ�Ĺ��������á��������Ҳ�ܵ�����ѿ�϶�ʵ�Ӱ�죬�ڿ�϶��Ϊ60%ʱ���������á�
�ؼ��ʣ�TiO2���ܣ��������������⽵�⣻�����
(Edited by Hua YANG)
Foundation item: Project (1254G024) supported by the Young Core Instructor Foundation from Heilongjiang Educational Committee, China; Project (2012RFQXS113) supported by Scientific and Technological Innovation Talents of Harbin, China
Corresponding author: Guo-jian CAO; Tel: +86-451-86392518; Fax: +86-451-86392555; E-mail: guojiancao@126.com
DOI: 10.1016/S1003-6326(14)63386-0

