������������Ͻ�ʧ�������ͭ������
��Դ�ڿ����й���ɫ����ѧ��(Ӣ�İ�)2019���12��
�������ߣ�J. ORTIZ-CORONA F. J. RODRIGUEZ-GOMEZ
����ҳ�룺2646 - 2657
�ؼ��ʣ���; ����������ʧ�绯ѧ�迹�ף����Ͻ𣻸�ʴ����
Key words��silver; conservation and restoration; tarnishing; electrochemical impedance spectroscopy; silver alloys; corrosion mechanism
ժ Ҫ�����ڱ�¶�����ﻷ��(H2S)�У��������Ͻ��������к͵�ѧ���������ᷢ��һЩ�仯�������Ļ��Ų�������Ʒ��ʴ�ͷ��������һ�����⡣���õ绯ѧ�迹��(EIS)��ɨ���������(SEM)��������0.925��0.800��0.720���Ͻ���0.07%(�������)�����Һ�н�û��ͬʱ���ʧ�������ͭ�����á��������߱�����ͭ����������ʹ��ʴ�����ܶ������ӻ����Ͻ�Ķۻ����ڿ�·����(OCP)���õ����迹�׳��ֲ������ġ�ѹ��ĵ�һ�ݿ������������ת�Ƶ������źϽ���ͭ������������͡��෴��˫���������ͭ�������������SEM-EDS��������������S������Cu��Ӧ�����Ͻ��еĸ�ͭ�౻ѡ�����ܽ⣬���¾ֲ���ʴ���Ӷ��ӻ��ۻ�Ĥ���γɡ���ͭ�����ϵ͵ĺϽ��й۲쵽���Եľֲ���ʴ�����������Ͻ�ʧ��Ļ���ȡ���ںϽ�������Լ�ͭ����Ľϴ�����������ͭ�ܽ��γɸ�ʴ����Ĺ��̱���Ϊ�����ʾ������衣
Abstract: Silver and silver alloys usually tarnish, which causes some changes in their aesthetic appearance and electrical properties, due to their exposure to sulphide environments (H2S), and this is a problem in the field of corrosion and conservation of cultural heritage metallic artefacts. In this study, the role of copper content in the tarnishing process of 0.925, 0.800 and 0.720 silver alloys in a 0.07 vol.% ammonium sulphide solution for different immersion periods was analyzed by electrochemical impedance spectroscopy (EIS) and scanning electron microscopy (SEM). The polarisation curves showed that the copper content and sulphide increased the corrosion current density and delayed the passivation of silver alloys. The impedance spectra collected at the open circuit potential (OCP) showed a single capacitive, incomplete and depressed loop, indicating that the charge transfer resistance decreased as the copper content increased in the alloys. In contrast, the double-layer capacitance increased as the copper content increased. The SEM-EDS analysis confirmed that the copper-rich phase in the silver alloys was selectively dissolved due to the preference of S to react with Cu, resulting in a localised attack, thus delaying the formation of a passive film. A marked localised attack was observed in alloys with lower copper content. The mechanism for the tarnishing of silver alloys in sulphide media was dependent on the nature of the alloy and the greater affinity of copper for sulphur. The dissolution of Ag and Cu to form corrosion products was proposed as the rate determining step.
Trans. Nonferrous Met. Soc. China 29(2019) 2646-2657
J. ORTIZ-CORONA, F. J. RODRIGUEZ-GOMEZ
Departamento de IngenierIa Metalurgica, Facultad de QuImica, Universidad Nacional AutOnoma de Mexico, Ciudad de Mexico, C.P. 04510, Mexico
Received 7 February 2019; accepted 21 June 2019
Abstract: Silver and silver alloys usually tarnish, which causes some changes in their aesthetic appearance and electrical properties, due to their exposure to sulphide environments (H2S), and this is a problem in the field of corrosion and conservation of cultural heritage metallic artefacts. In this study, the role of copper content in the tarnishing process of 0.925, 0.800 and 0.720 silver alloys in a 0.07 vol.% ammonium sulphide solution for different immersion periods was analyzed by electrochemical impedance spectroscopy (EIS) and scanning electron microscopy (SEM). The polarisation curves showed that the copper content and sulphide increased the corrosion current density and delayed the passivation of silver alloys. The impedance spectra collected at the open circuit potential (OCP) showed a single capacitive, incomplete and depressed loop, indicating that the charge transfer resistance decreased as the copper content increased in the alloys. In contrast, the double-layer capacitance increased as the copper content increased. The SEM-EDS analysis confirmed that the copper-rich phase in the silver alloys was selectively dissolved due to the preference of S to react with Cu, resulting in a localised attack, thus delaying the formation of a passive film. A marked localised attack was observed in alloys with lower copper content. The mechanism for the tarnishing of silver alloys in sulphide media was dependent on the nature of the alloy and the greater affinity of copper for sulphur. The dissolution of Ag and Cu to form corrosion products was proposed as the rate determining step.
Key words: silver; conservation and restoration; tarnishing; electrochemical impedance spectroscopy; silver alloys; corrosion mechanism
1 Introduction
Silver is usually found in its native form or as an alloy with other metals (e.g., Cu, Au, and Pd). It has been widely used in industry and in the field of cultural heritage [1-3]. Silver artefacts have a cultural value and are sometimes stored in depositories or exhibited in museums or historical sites [4]. They develop a black layer on the surface, commonly known as tarnishing, in environments containing sulphides, such as H2S [5]. The tarnish layer can result in the loss of the original appearance (e.g., texture, aesthetic, colour, and shape) of artefacts as well as information about its history. Therefore, there is a need to develop adequate methods to protect, avoid or control the tarnishing of silver artefacts by electrochemically understanding how silver tarnishes.
Over the last decade, there has been major interest in the corrosion process of silver in different environments [5-7], and its analysis by different electrochemical techniques has been published [8-10]; the research on pure silver can be considered as a representative study of silver alloy artefacts [2,11-13]. Studies on corrosion by sulphides have mainly focused on sterling silver (Ag 92.5%) [14-16] and to a lesser extent on other types of silver alloys [17], and some case studies have been on the corrosion films formed (e.g., whiskers, clumps, and dendrites) on artefacts exhibited in museums [18,19].
However, there are several studies related to corrosion mechanisms for silver [6,9,20] and copper [21-24] in the presence of sulphides, suggesting that the corrosion process is due to a competitive relationship between sulphide diffusion in the solution and the interfacial reactions of adsorption and oxidation of HS- on the metallic surface. Therefore, the corrosion of silver alloys undergoes three stages of reactions: first, the oxidation of copper; second, the adsorption of sulphur that accelerates the dissolution of copper (localised attack); and finally, formation of a passive film (e.g., Ag2S, Cu2S and Ag3CuS2) [15,20,21]. The localised corrosion is influenced by the thickness, porosity structure, and migration of ions (Ag and Cu) of the passive film [15,25]. The passive film and the corrosion rate increase with the copper content in the alloy, temperature, pH, and sulphide ion concentration [26].
Thus, it is possible to explain the mechanism of corrosion for Ag-Cu alloys by the following steps. The first step is the anodic reaction of copper (Eq. (1)) and silver (Eq. (2)) and the cathodic reaction of oxygen reduction in deaerated (Eq. (3)) or aerated (Eq. (4)) media, according to Refs. [20,22,23]:
Cu��Cu++e (1)
Ag��Ag++e (2)
2H2O+2e  2OH-+H2 (3)
O2+2H2O+4e 4OH- (4)
Hydrogen sulphide ion is derived from the dissociation in water of (NH4)2S (Eqs. (5) and (6)) according to Refs. [22,27,28]:
 ��
�� (5)
(5)
 +H2O��OH-+
 (6)
(6)
In the second step, HS- (Eq. (6)) reacts with metallic copper (Eq. (1)) and silver (Eq. (2)) with a two-electron transfer to form the adsorbed precursors (Eqs. (7) and (8)), such as Cu(HS-)ads and Ag(HS-)ads, respectively. Thus, the dissolution on the surface of the silver and copper metallic substrate occurs by a two-electron transfer to form Cu2S (Eq. (9)) [22,23] and Ag2S (Eq. 10) [6, 20] as follows:
Cu+Ag+2HS-��Cu(HS-)(ads)+Ag(HS-)(ads) (7)
Cu(HS-)(ads)+Ag(HS-)(ads)��Cu(HS)(ads)+Ag(HS)(ads)+2e (8)
2Cu+HS-+OH-Cu2S(ads)+H2O+2e (9)
2Ag+HS-+OH-Ag2S(ads)+H2O+2e (10)
Therefore, the overall reactions in deaerated (Eq. (11)) or aerated (Eq. (12)) media are
 +2Ag-Cu+2H2OAg2S(ads)+Cu2S(ads)+2OH-+H2+4e (11)
+2Ag-Cu+2H2O+O2Ag2S(ads)+Cu2S(ads)+4OH- (12)
Electrochemical impedance spectroscopy (EIS) is a non-destructive technique that has been used to understand the interfacial behaviour in electrochemical systems [29,30], as well as to study the corrosion mechanisms to determine their kinetics and the real surface areas in situ [31,32]. Therefore, this is a suitable technique to understand the corrosion process in silver artefacts. The purpose of the present work is to investigate the role of copper in the tarnishing of silver alloys in ammonium sulphide solution for different immersion periods by EIS and scanning electron microscopy (SEM-EDS) at room temperature using three common silver alloys in the cultural heritage artefacts.
2 Experimental
2.1 Electrochemical test
The experiments were carried out using a conventional three-electrode electrochemical cell with nitrogen bubbling before and during the test. The working electrodes were plates of silver alloys, 0.925 (92.5 wt.% Ag, 7.5 wt.% Cu) (Ag9), 0.800 (80 wt.% Ag, 20 wt.% Cu) (Ag8), and 0.720 (72 wt.% Ag, 28 wt.% Cu) (Ag7) provided by PlaterIa del RecreoTM (Mexico City). The counter electrode and the reference electrode were platinum and Hg/Hg2SO4 (saturated mercurous sulphate electrode, SME) with a saturated solution of K2SO4. In all cases, the plates used as the working electrode had a 1.327 cm2 exposure area. The plates were mechanically polished with 600 and 1500 grit (SiC, Truper) sandpaper and mirror polished with 1 ��m alumina (Al2O3, Buehler).
2.2 Solution
A 0.07 vol.% solution of ammonium sulphide was prepared using an A.C.S. solution with 20 vol.% ammonium sulphide (QuImica Meyer) and distilled water (2.6 M ����cm; Theissier). The pH value of the solution employed was 9, and the concentration of S2 in this solution corresponded to 3.287��10-9 g/L, much higher than that reported for a hydrogen sulphide- contaminated environment (H2S, 0.3��10-9 g/L) [5] to develop the tarnishing process in a short time. (NH4)2S was chosen because it is usually used as an accelerator in the corrosion process on silver and copper [17,33,34], it easily dissociates in water (see Eqs. (5, 6)), and HS- is the predominant species at pH values above 7 [20]. Therefore, the sulphide present in the bulk was mainly HS- (aq).
2.3 Electrochemical measurement
Electrochemical measurements were carried out with a multi potentiostat VMP3-Bio-Logic with EC-Lab V10.34 software. The open circuit potential (OCP) was measured for 1 h. The EIS tests were performed at the OCP after 60 min of stabilisation time with an amplitude of ��10 mV and a frequency range from 100 kHz to 10 mHz for different immersion periods of 60, 90 and 120 min. The polarisation curve tests were recorded between -0.6 and 1 V with a scan rate of 10 mV/s.
2.4 Morphological characterisation
The morphology and chemical composition of the corrosion product films formed on the Ag9, Ag8 and Ag7 plates were analyzed by SEM-EDS Hitachi 3030 equipped with a Bruker SDD X-ray detector. The energy used was approximately 1.5 kV.
3 Results and discussion
The effect of copper on the tarnishing of Ag9, Ag8 and Ag7 commonly used in cultural heritage artefacts was studied in a (NH4)2S solution during different immersion periods by OCP, polarisation curves and EIS experiments, as well as morphological characterisation by SEM-EDS.
3.1 SEM-EDS characterisation
The SEM results (Figs. 1(a), (b) and (c)) before exposure to (NH4)2S confirm the presence of copper islands in Ag9, Ag8 and Ag7, which is a common feature of silver-copper alloys because silver has a low miscibility with copper at room temperature. Figures 2(a), 3(a) and 4(a) exposed for 120 min show the evidence of localised corrosion processes, particularly in alloys with low copper content (Figs. 2(a) and 3(a)), as well as a heterogeneous and porous surface. The tarnish of silver alloys starts as a localised attack of copper (Eq. (9)) at the metal-electrolyte interface, and silver remains cathodic. This process increases on silver alloys with lower copper contents (Figs. 2(a) and 3(a)). As seen in Figs. 2(c), 2(d), 3(c), 3(d), 4(c) and 4(d), the growth of the tarnishing film was ruled by the presence of sulphide as well as the copper content in the alloy. At the beginning, only Cu2S (Eq. (9)) is formed, and Ag2S (Eq. (10)) appears later because copper is more susceptible to oxidation than silver according to their redox potentials.
Surface analysis of the silver alloys detected Cu, Ag, and S as components in the tarnish film, and the contents of silver and copper correspond to the expected composition for each alloy studied. The EDS results with an exposure time of 120 min (Figs. 2(b-d), 3(b-d) and 4(b-d)) show the elemental distribution on the surface, in which there is a deposition preference of S for Cu on Ag9 (Fig. 2(d)) and Ag8 (Fig. 3(d)) in comparison to that on Ag7 (Fig. 4(d)), which is clearly shown as defined island of copper. Therefore, the copper enrichment [15,35] on the metallic surface is due to the strong affinity between S and Cu (Eq. (9)) [21,23], while silver remains stable. The distribution of S on the surface of the three alloys was more homogeneous on Ag7 (Fig. 4(d)) mainly due to the homogeneous distribution of copper and silver, which could be associated with uniform corrosion. These results showed a mixed corrosion mechanism in silver alloys, uniform corrosion for Ag7 and localised corrosion for Ag9 and Ag8.
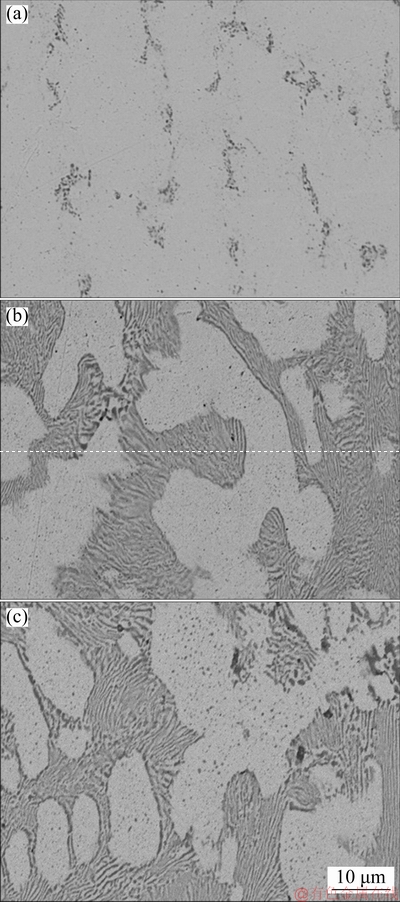
Fig. 1 SEM images of as-received Ag9 (a), Ag8 (b) and Ag7 (c) alloys
3.2 Electrochemical investigation
3.2.1 Change in open circuit potential
The changes in the OCP (or ��corr) for Ag9, Ag8 and Ag7 related to 0.07 vol.% (NH4)2S are shown in Fig. 5. After the immersion of the silver samples in the test solution, the OCP for the alloys (Ag8 and Ag7) with a higher copper content was more negative than that of those with a low copper content (Ag9), indicating a higher active corrosion surface. This change could be due to the decrease in the cathodic reaction (Eq. (3)) as well as the increase in the dissolution of Cu (Eq. (9)) in the alloys due to the action of sulphide [20,21,23], while silver remains cathodic. After 1500 s, the OCPs of Ag8 and Ag7 stabilized faster than that of Ag9. The OCP values for Ag9, Ag8 and Ag7 were -1.307, -1.308 and -1.306 V, respectively, which are between the potential values of Ag2S (-1.29 V (vs SME)) [36] and Cu2S (-1.51 V (vs SME)) [37]. The open circuit potential values are more negative than -1.29 V. This difference may be explained by the influence of Cu and S on increasing the kinetics of the anodic reactions (Eqs. (1) and (2)). The evolution of these values towards a steady state could be attributed to the formation of protective films on the metallic surfaces. The results indicate that the steady-state potential for silver alloys is reached after 2700 s, which has sufficient time to form a heterogeneous corrosion film.
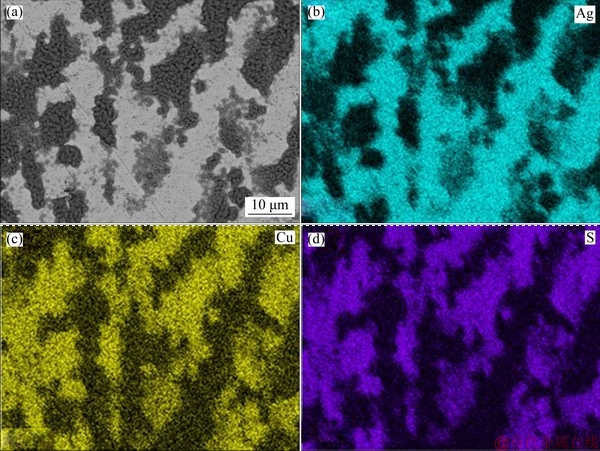
Fig. 2 SEM image (a) and EDS maps (b, c, d) of Ag9 alloy exposed to (NH4)2S solution for 120 min
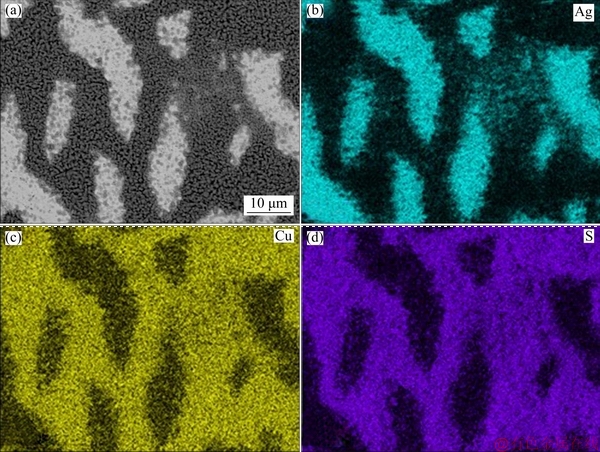
Fig. 3 SEM image (a) and EDS maps (b, c, d) of Ag8 alloy exposed to (NH4)2S solution for 120 min
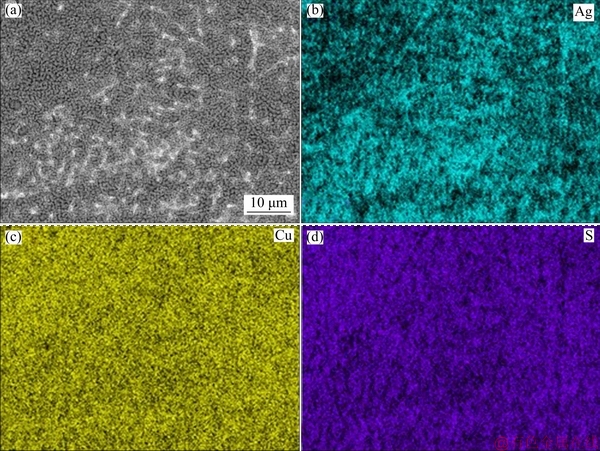
Fig. 4 SEM image (a) and EDS maps (b, c, d) of Ag7 alloy exposed to (NH4)2S solution for 120 min
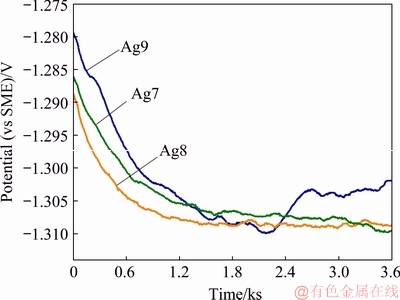
Fig. 5 Open circuit potential changes during corrosion test of Ag9, Ag8 and Ag7 alloys in 0.07 vol.% (NH4)2S
3.2.2 Polarisation curve
The polarisation curves for Ag9, Ag8 and Ag7 alloys in 0.07 vol.% (NH4)2S are shown in Fig. 6. The ��corr values obtained from these curves are in accordance with the results of ��corr discussed in Section 3.2.1. The curves showed a decrease in the active anodic current and a reduction in the current density in the passive region from -1 to -0.27 V (vs SME). The content of copper in the alloy changes the potentiodynamic polarisation characteristics in a similar manner for Ag8 and Ag7, which means that the anodic reaction of copper (Eq. (9)) influences the current density. The most interesting characteristic of this behaviour was the active�Cpassive transition from -1.0 to -0.55 V (vs SME).
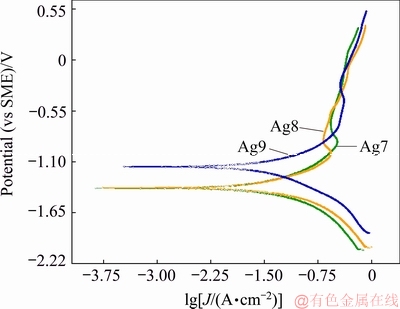
Fig. 6 Polarisation curves for Ag9, Ag8 and Ag7 alloys in 0.07 vol.% (NH4)2S at scan rate of 1 mV/s
The polarisation curves showed a current decrease and deflection in the transpassive region from -0.27 to 0.5 V (vs SME), which is attributed to the oxygen evolution or water oxidation [20,38]. Furthermore, in alloys with a lower copper content (Ag9), the potential shifts to the positive direction due to the decrease in the rate of the anodic reactions (Eqs. (1) and (2)). Another characteristic of the polarisation curves is that they were not symmetrical, and their cathodic branch was much steeper than the anodic branch, which implies that the anodic process (Eqs. (9) and (10)) plays a more important role in the corrosion process.
Table 1 shows the electrochemical parameters determined by extrapolation of the Tafel line from the curves. The corrosion current density (Jcorr) values (Table 1) suggest a direct relationship between the content of copper and the Jcorr on silver alloys. Thus, the increase in Jcorr could be due to the acceleration of the anodic reactions (Eqs. (1) and (2)) by the copper content in the alloys and the greater affinity of Cu for sulphur.
Table 1 Corrosion current density and Tafel slopes for Ag9, Ag8 and Ag7 alloys in 0.07 vol.% (NH4)2S
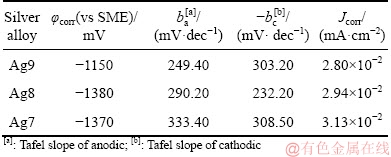
However, it was demonstrated that sulphur on a metallic surface has two effects: (1) the adsorbed sulphur remains on the surface in the active domain of the metals and increases the anodic dissolution, and (2) it hinders or delays the formation of the passive film [20,21,23]. These results suggest the role of the copper content in the tarnishing process and that the presence of sulphide delays the passivation and increases the anodic dissolution of copper in silver alloys.
3.2.3 Electrochemical impedance spectroscopy
3.2.3.1 Graphical analysis
The impedance measurements for Ag9, Ag8 and Ag7 alloys were performed for different immersion periods in 0.07 vol.% (NH4)2S, and the effect of the immersion time is shown in the Nyquist plots (Fig. 7). The impedance was carried out at the OCP (see Section 3.2.1) after 60 min of stabilisation. All impedance spectra are characterized by a capacitive loop, and these loops are depressed with their centre below the real axis. This dispersal behaviour can be attributed to the surface heterogeneity, surface adsorption processes, electrode geometry, or continuous distribution of time constants due to charge-transfer reactions [30-32]. Additionally, the appearance of depressed loops can be attributed to the interaction of two merged or identical semicircles (two time-constants, t) [32,39], or multiple processes with similar relaxation time constants or distributed non-ideal kinetics [30,32].
A possible explanation for the depressed semicircles relative to the electric circuit equivalent could be due to the adsorption processes of Cu2S(ads) (Eq. (9)) and Ag2S(ads) (Eq. (10)) or the formation of a heterogeneous corrosion film and double film capacitance (Cdl) in parallel with the charge transfer resistance (Rct) [30,31], corresponding to two merged or identical semicircles. The diameter of the capacitive loops corresponds to the polarisation resistance (Rp), which is inversely proportional to the corrosion current density (Jcorr) (see Section 3.2.3.3.). Thus, the Rp is greater for Ag9 and proportionally increases with the immersion time up to 60 min, while in samples of Ag8 and Ag7, the Rp decreased in comparison with that of the Ag9 sample, according to a qualitative analysis of the Nyquist plots. Therefore, the corrosion current density (Jcorr) increased with a higher copper content.
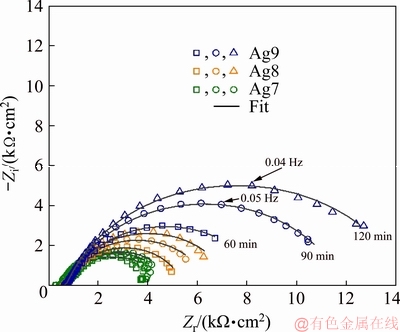
Fig. 7 Impedance diagram of corroding Ag9, Ag8 and Ag7 alloys in 0.07 vol.% (NH4)2S
The role of sulphur during the corrosion process on different metals has been investigated by PROTOPOPOFF and MARCUS [20,23], and MARCUS [21], and according to them, sulphur can accelerate dissolution and hinder the formation of a passive film on a metal surface because adsorbed sulphur weakens metal-metal bonds as a result of lowering the activation energy for dissolution. Thus, corrosion can be strongly localised. In addition, sulphur blocks the sites of adsorption of hydroxyl ions (OH-) (Eqs. (9) and (10)) for the formation of the passive state (see Fig. 6) [20,21]. When this film grows on top of the adsorbed sulphur film, its structure and properties are modified, such as the current density, which can be several times higher at the metal-oxide interface [21].
For the Ag8 and Ag7 alloys rich in copper, the formation of sulphide preferentially occurs on copper-rich phases and explains the higher corrosion of such alloys (see Figs. 3(a)-(d) and 4(a)-(d)). Moreover, the dissolution of single-phase alloys has been classified into two categories: simultaneous dissolution and selective dissolution [21]. In this study, it is assumed that the copper-rich phase in Ag9, Ag8 and Ag7 alloys is dissolved selectively by sulphide, leaving behind a porous metal phase enriched in the silver-rich phase, resulting in localised attack or dealloying (see Figs. 2(a-d), 3(a-d) and 4(a-d).
The Bode plots for Ag9, Ag8 and Ag7 alloys in 0.07 vol.% (NH4)2S are presented in Fig. 8, showing the changes of the impedance modulus (lg |Z|) versus frequency (lg f) (Fig. 8(a)) and the phase angle (��) versus frequency (lg f) (Fig. 8(b)) as a function of the immersion time. At low frequencies, the Bode modulus in alloys with lower copper content is higher, which is confirmed by the copper content with increasing the corrosion rate, and then, the formation of Cu2S increases. This sulphide is more conductive than Ag2S, according to the Refs. [40,41], so the conduction through a film resulted in a decrease in rich-silver alloys.
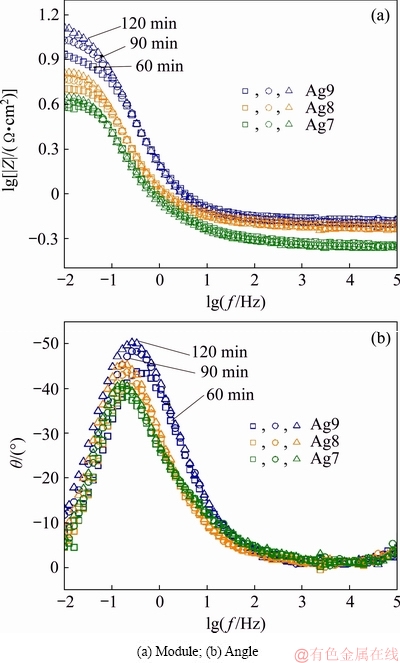
Fig. 8 Bode diagrams of corroding Ag9, Ag8 and Ag7 alloys in 0.07 vol.% (NH4)2S
The phase angle plots (Fig. 8(b)) show that the maximum phase angles for Ag9, Ag8 and Ag7 alloys occurred at approximately -50��, -45�� and -40��, respectively. These phase angles may be due to the adsorbed sulphur on the silver alloys delaying the formation of a passive film, which is less protective when the copper content increases in the alloy. For a highly capacitive typical behaviour in passive materials, the phase angle approaching -90�� suggests the formation of a very stable and protective surface film [38]. A single peak at low frequencies could suggest that there are two corrosion processes overlapping (see Eqs. (9) and (10)); for this reason, only one time-constant is clearly distinguished in the phase angle plots.
To confirm the presence of two time-constants, the logarithm of the imaginary part of the impedance was plotted against the logarithm of the frequency (Fig. 9). In these plots, it can be observed that the curves almost overlap for different immersion periods [10] and show an apparent linear behaviour in the frequency interval from 0.40 to 0.90 Hz. Also the maximum was observed for each alloy, indicating that the data should be interpreted in terms of only one process related to activation (charge transfer) control.
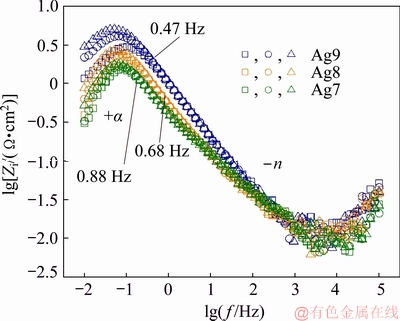
Fig. 9 Imaginary part of impedance vs logarithm of frequency
The imaginary part of the impedance as a function of the frequency is a representation independent of the electrolyte resistance and permits its influence on the high-frequency region of the diagrams to be ignored, reveals the existence of constant phase element (CPE) behaviour and provides a more reliable value [31,42]. Figure 9 shows the slope of the line at high frequency that corresponds to the CPE exponent (-n) [31,42]. The dispersal behaviour of time constant (t) is usually modelled by a CPE. These plots indicate that the two time contants t are coupled, representing two corrosive processes as described before, and it could be through double-layer capacitive or CPE. Then, the tarnishing process of Ag9, Ag8 and Ag7 alloys in 0.07 vol.% (NH4)2S solution can be explained using two t, which correspond to the processes at the corrosion product film/solution interface (t1) and at the metal/film interface (charge transfer resistance, t2).
3.2.3.2 Fitting analysis
The electrochemical behaviour obtained from the impedance measurements cannot be represented by a single capacitive loop, but by two time-constants, requiring computer fitting of experimental data, as shown in Fig. 10 [24,36], since it was assumed that there is a contribution from the corrosion product film (Cu2S(ads) and Ag2S(ads)) and charge transfer resistance (Eqs. (9) and (10)). In Fig. 10, Rsol is the solution resistance; RF, QF and nF represent the contribution of the impedance involved in the corrosion product film (Cu2S(ads) and Ag2S(ads)) accumulated on the surface due to the redox process, charge accumulation, and the depression of loops due to the formation of different metallic sulphides, respectively; Rct and Cdl corresponded to charge transfer resistance and the double layer capacitance associated with the corrosion process [30-32].
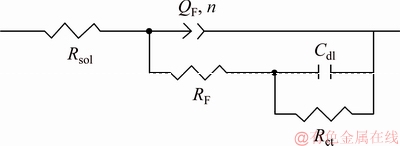
Fig. 10 Equivalent electrical circuit used to fit impedance data
Due to the depressed semicircles (see Fig. 7) of the Nyquist plot, the time constant of the corrosion film in the circuit model (Fig. 10) was substituted by one CPE as a substitute for the ideal capacitor [31,32,42]. The impedance of the constant phase elements is expressed as [42]
 (13)
(13)
where Q is the magnitude of the CPE (F��cm-2��sn-1), �� is the angular frequency and n is an empirical exponent (0��n��1). The value of this empirical exponent is inversely correlated to the homogeneity of the film. When n=0, the CPE is equivalent to a resistor; when n=1, the CPE is equivalent to a capacitor, and when n=-1, the CPE is equivalent to an inductor. Finally, if n=0.5, the CPE is equivalent to the Warburg impedance [31,32]. However, Q does not have units of capacitance, and then to obtain the dimensionally correct value for Q, an effective capacitance (Ceff) can then be found by the following equation [43,44]:
Ceff=Q(��m)n-1 (14)
where ��m is the frequency at which the imaginary part of impedance (Zi) has a maximum.
The fitted electrochemical impedance parameters of silver alloys are summarized in Table 2. The fitting quality is evaluated by the complex non-linear least squares analysis and is represented by the relation (Chi-squared)/number of points. The ��2 must be between 10-4 and 10-5 indicating good agreement between the measured and simulated values. The RF and Ceff are related to the formation of corrosion product films (Cu2S(ads) and Ag2S(ads)) and their interaction with redox processes (Eqs. (3), (9) and (10)). The corrosion resistance of alloys is also related to this film and its surface properties (inhomogeneities, electronic, etc.). Cu2S(ads) (Eq. (9)) and Ag2S(ads) (Eq. (10)) are intrinsic semiconductors (i-type) with band gaps of 1.8 eV (p-type, hole conduction) [40] and 0.9 eV (n-type, electron conduction) [41], respectively, and can form p-n junctions. Such a junction is known as a p-n junction diode where the current flows in one direction. Therefore, this film can behave as a semiconductor [32].
The porous structure of the film has been explained as a Cu-rich (or enrichment of copper) phase on a subsurface that is transformed (Eqs. (1), (9) and (11)) into voids. When silver starts to corrode (Eqs. (2), (10) and (11)), the voids increase so that the adhesion of the corrosion film to the metal weakens [15]. This process is associated with localised corrosion [45]. For this reason, the RF value could be higher in alloys with lower copper content (Ag9), indicating that the corrosion film on the metallic surface is less porous and is mostly composed of acanthite (Ag2S). Ag2S is occasionally accompanied by jalpaite (Ag3CuS2) [15,17]. Jalpaite is considered a precursor that plays an important role in the formation of Ag2S. The Ag3CuS2 is formed at grain boundaries, and in regions where the copper sulphide compounds are in a high concentration and favour its formation [15,40].
Table 2 Fitting values of equivalent circuit elements for Ag9, Ag8 and Ag7 alloy in 0.07 vol.% (NH4)2S
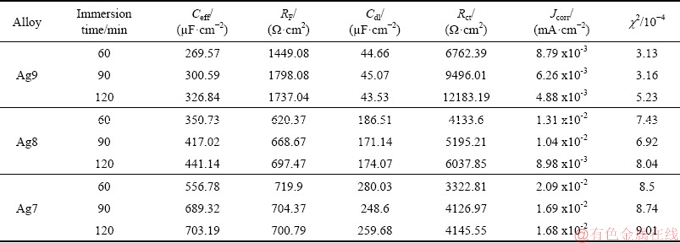
The values for the Ceff in silver alloys (Ag9, Ag8 and Ag7) decreased as the copper content decreased in the alloys (Table 2), which could be attributed to slower film formation kinetics at a lower copper content and the formation of adsorbed species (Cu2S(ads) and Ag2S(ads)) and surface roughness (Figs. 2(a), 3(a) and 4(a)). The roughness could be due to an increase in Cu2S(ads) (Eq. (9)) and decrease in Ag2S(ads) (Eq. (10)) accumulated on the surface of silver alloys [15]. The average nF value of 0.67 is rougher than 0.76 (Ag9) and 0.77 (Ag8). Over time, the mechanism of the silver alloys could change from charge transfer to diffusion control due to the tendency of nF to decrease.
Rct and Cdl are associated with the redox processes of water (Eq. (3)), the formation of adsorbed precursor (Eq. (8)), and the dissolution of copper (Eq. (9)) and Ag (Eq. (10)). These processes take place on the surface of the silver plates (Ag9, Ag8 and Ag7) in parallel with the corrosion product film formation previously mentioned.
The values of Rct are related to corrosion for different immersion periods of silver alloys due to the electron transfer (4e) across the interface during the redox processes previously mentioned. In Table 2, it is possible to see that the Rct increases noticeably with time for alloys with lower copper content (Ag9) as a result of the Jcorr decrease (see Table 2). This can likely be attributed to a decrease in the reactivity and reversibility of the redox reactions (Eqs. (3), (9) and (10)) [41]. Additionally, the lower Rct on Ag7 could be due to adsorbed sulphur, which increases the dissolution of the Cu-rich phase and delays the formation of the passive film [20,21]. Due to the p-n junction previously mentioned, the corrosion product film could take part in the charge transfer process, where the electrons freed from Ag2S(ads) (Eq. (9)) can move through the film and can be transferred into the solution, and the holes of Cu2S(ads) (Eq. (10)) can migrate across the film and the electrons can transfer from the solution. [24,32,38] In such p-n junctions in alloys with the higher copper content (Ag8 and Ag7), the holes of Cu2S(ads) may contribute to increasing the current flow for conduction.
The values of Cdl are influenced by the charge accumulation of the redox processes previously mentioned. The decrease in Cdl for Ag9, Ag8 and Ag7 alloys can be attributed to a decrease in the reactivity and reversibility of the redox processes. Due to covering the electrode surface by the corrosion product film (Figs. 2(a), 3(a) and 4(a)), the film reduces the contact area between the solution and the silver alloy. The average values of Cdl for the Ag9, Ag8 and Ag7 alloys are estimated to be approximately 44.42, 177.24 and 262.77 ��F/cm2, respectively. Cdl values of 50-100 ��F/cm2 for metal surfaces have been reported, although much higher values could be found for metals with porous conducting surface films [46]. Thus, it could be inferred that the Ag8 and Ag7 alloys richer in copper may have a more porous and conducting surface film than Ag9. It is known from the Ref. [24] that copper frequently forms a bilayer corrosion product in sulphide solutions, constituted by an internal Cu2S barrier layer and an external CuS layer; this external layer is porous and an n-type semiconductor. As a result, the film (Cu2S-CS) forms a p-n junction.
In summary, the results of EIS demonstrate that it is an appropriate technique to study the tarnishing process in silver alloys. EIS is a non-invasive technique that enables understanding of the role and importance of copper and sulphur in corrosion mechanisms and identified that the corrosion process was controlled by activation (charge transfer) control in silver alloys in the presence of sulphide.
3.2.3.3 Estimation of corrosion current density
The corrosion current density (Jcorr) is related to the linear polarisation resistance (Rp) by the Stern-Geary linear approximation to the Butler-Volmer equation (Eq. (15)). It is generally accepted that EIS provides data more directly related to the corrosion process. Thus, Rct is equivalent to the linear polarisation resistance (Rp) in activation-controlled processes and is correlated with the corrosion current density [46].
 (15)
(15)
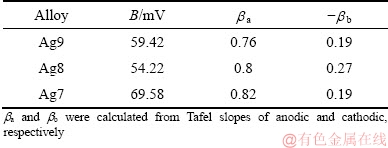
where B is the Stern-Geary coefficient, and its value is determined using experimental Tafel slopes and calculated with Eq. (15). The values of B estimated are shown in Table 3, and they are influenced by the copper content in the alloy, particularly for Ag7. To calculate Jcorr values, Eq. (15) was used, and Rct values were obtained from fitting the EIS data (Table 2).
The influence of the copper content in silver alloys is reflected by the trend of the Jcorr values, as shown in Table 2. The Jcorr is higher in alloys with a higher copper content (Ag8 and Ag7). As mentioned before, such an increase results from the acceleration of the anodic reaction (Eq. (9)) as well as the adsorbed sulphur increasing the anodic dissolution of copper.
The mechanism of tarnishing silver alloys significantly depends on the nature of the alloy and the greater affinity of copper for sulphur. Therefore, it could be proposed that the rate determining step (RDS) is the dissolution of silver and copper to form Cu2S (Eq. (9)) and Ag2S (Eq. (10)).
The symmetry factor (��) is associated with the RDS for a simple reaction (one electron). It relates to quantum mechanics and molecular structure and describes the fraction of charge transferred to the reactant at the position of the activated complex [47,48]. In single step reactions, the transfer coefficient (��) and symmetry factor coincide. Usually, �� is assumed to be 0.5 for kinetics calculation and must have a value between 0 and 1. It was calculated from the experimental Tafel slopes (see Table 1) and was determined using the following equation [31]:
 (16)
(16)
 (17)
(17)
where n is the number of electrons transferred in RDS, R is the gas constant, T is the thermodynamic temperature, F is the Faraday constant, and ba and bc are the Tafel slopes of anodic and cathodic, respectively. Table 3 shows the values of the symmetry factor calculated, which were between 0 and 1. For Ag9, the corresponding �� values for the anodic reaction are closer to 0.5 than the alloys richer in copper, and the reactant state is a much lower energy than the product [49]. The �� values for the cathodic reaction for the three alloys are so low that there could not be enough activation energy to continue [49].
Table 3 Stern-Geary coefficient (B) and symmetry factor (��) calculated from measured Tafel slopes
4 Conclusions
(1) The EIS analysis reveals two time-constants associated with the sulphide thin film (t1, processed at the film/solution interface) and the corrosion process (t2, processed at the metal/film interface). The Rct decreases substantially in alloys with higher copper contents, while the CF increases. This is due to an accumulation of corrosion products at the metallic surface.
(2) The mechanism that governs the tarnishing process is activation (charge transfer) control and is dependent on the nature of the alloy and the greater affinity of copper for sulphur. The rate determining step is the dissolution of Ag and Cu to form corrosion products.
(3) The SEM results show that localised corrosion is more evident with a lower copper content. The EDS studies reveal the enrichment of copper due to adsorbed sulphide on the surface of the silver alloys.
(4) The potentiodynamic polarisation results reveal that the copper content in Ag9, Ag8 and Ag7 alloys generally accelerates the Jcorr by increasing the anodic dissolution of copper. Regarding the tarnishing process, copper increases the passive current density, and sulphide delays the passivation and increases the anodic dissolution of copper in silver alloys.
(5) Although these results are a good reference for studying silver alloys, more work on artefacts exhibited in museums or buried should be addressed. The preservation methods should consider not only the influence of copper content and other elements on tarnishing silver alloys but also the environment where the artefacts are or were exposed.
Acknowledgements
The authors would like to thank CONACyT for their support: scholarship to JOC 45653 and the Basic Science Projects 239938; Dr. Jose Luis Ruvalcaba from the Institute of Physics, UNAM for SEM-EDS support, as well as LANCIC CONACyT LN 232619, 260779 and 271614. An SEM study was conducted at the LANCIC-IFUNAM supported by J. Canetas; Dra. Roxana Larios (Universidad de Guadalajara) and Dra. Miriam Beristain (CNyN-UNAM) for the revisions and comments made to the manuscript. FJRG would like to thank the Chemistry School at UNAM for the financial support given for this work through the Program for Research and Graduate Studies Sponsorship (PAIP).
References
[1] COSTA V. The deterioration of silver alloys and some aspects of their conservation [J]. Reviews in Conservation, 2001, 2: 18-34.
[2] VASSILIOU P, GOUDAD V. Ancient silver artefacts: Corrosion processes and preservation strategies [M]. Cambridge, UK: Woodhead Publishing Limited, 2013.
[3] MINZARI D, JELLESEN M S, MOLLER P, AMBAT R. Morphological study of silver corrosion in highly aggressive sulfur environments [J]. Engineering Failure Analysis, 2011, 18(8): 2126-2136.
[4] CASALETTO M P, INGO G M, RICCUCCI C, FARALDI F. Production of reference alloys for the conservation of archaeological silver-based artifacts [J]. Applied Physics A, 2010, 100: 937-944.
[5] GRAEDEL T E. Corrosion mechanisms for silver exposed to the atmosphere [J]. Journal of the Electrochemical Society, 1992, 139: 1963-1070.
[6] LEE J I, HOWARD S M, KELLER J J, CROSS W, HAN K N. Electrochemical interaction between silver and sulfur in sodium sulfide solutions [J]. Metallurgical and Materials Transactions B, 2001, 32: 895-901.
[7] HA H, PAYER J. The effect of silver chloride formation on the kinetics of silver dissolution in chloride solution [J]. Electrochimica Acta, 2011, 56(7): 2781-2791.
[8] KLEBER C H, WIESINGER R, SCHNOLLER J, HILFRICH U, HUTTER H, SCHREINER M. Initial oxidation of silver surfaces by S2- and S4+ species [J]. Corrosion Science 2008, 50: 1112-1121.
[9] CHEN Z Y, LIANG D, MA G, FRANKEL G S, ALLEN H C, KELLY R G. Influence of UV irradiation and ozone on atmospheric corrosion of bare silver [J]. Corrosion Engineering Science and Technology, 2010, 45(2): 169-180.
[10] BEN AMOR Y, SUTTER E M M, TAKENOUTI H, ORAZEM M E, TRIBOLLET B. Interpretation of electrochemical impedance for corrosion of a coated silver film in terms of a pore-in-pore model [J]. Journal Electrochemical Society, 2014, 161(24): C573-C579.
[11] MARCHAND G, GUILMINOT E, LEMOINE S, ROSSETTI L, VIEAU M, STEPHANT N. Degradation of archaeological horn silver artefacts in burials [J]. Heritage Science, 2014, 2: 5.
[12] MARQUARDT A E, BREITUNG E M, WEISSER T D, GATES G, PHANEUF R J. Protecting silver cultural heritage objects with atomic layer deposited corrosion barriers [J]. Heritage Science, 2015, 3: 37.
[13] NOVAKOVIC J, VASSILIOU P, GEORGIZA E. Electrochemical cleaning of artificially tarnished silver [J]. International Journal Electrochemical Science, 2013, 8: 7223-7232.
[14] SIMON D, BARDOLLE J, BUJOR M. Study of the reactivity of silver, copper, silver-copper, and silver-palladium alloys used in telephone relay contacts [J]. IEEE Transactions on Components, Hybrids, and Manufacturing Technology, 1980, 3(1): 13-16.
[15] SCHALM O, CRABBE A, STORME P, WIESINGER R, GAMBIRASI A, GRIETEN E, TACK P, BAUTERS S, KLEBER C, FAVARO M, SCHRYVERS D, VINCZE L, TERRYN H, PATELLI A. The corrosion process of sterling silver exposed to a Na2S solution: Monitoring and characterizing the complex surface evolution using a multi-analytical approach [J]. Applied Physics A��Materials Science and Processing, 2016, 122: 903.
[16] CAPELO S, HOMEM P M, CAVALHEIRO J, FONSECA I T E. Linear sweep voltammetry: A cheap and powerful technique for the identification of the silver tarnish layer constituents [J]. Journal Solid State Electrochemistry, 2013, 17: 223-234.
[17] CARO T, CASCHERA D, INGO G M, CALANDRAET P. Micro-Raman innovative methodology to identify Ag�CCu mixed sulphides as tarnishing corrosion products [J]. Journal of Raman Spectroscopy, 2016, 4 (7): 852-859.
[18] SEASE C, SELWYN L S, ZUBIATE S, BOWERS D F, ATKINS D R. Problems with coated silver: Whisker formation and possible filiform corrosion [J]. Studies in Conservation, 1997, 42 (1): 1-10.
[19] WANHILL R J H. Case histories of ancient silver embrittlement [J]. Journal of Failure Analysis and Prevention. 2011, 11 (3): 178-185.
[20] PROTOPOPOFF E, MARCUS P. Potential�CpH diagram for sulfur and hydroxyl adsorbed on silver in water containing sulfides [J]. Electrochimica Acta, 2012, 63: 22-27.
[21] MARCUS P. Corrosion mechanisms in theory and practice [M], 2rd ed. USA: Marcel Dekker, 2002.
[22] RAHMOUNI K, KEDDAM M, SRHIRI A, TAKENOUTI H. Corrosion of copper in 3% NaCl solution polluted by sulphide ions [J]. Corrosion Science, 2005, 47(12): 3249-3266.
[23] PROTOPOPOFF E, MARCUS P. Potential�CpH diagrams for sulfur and hydroxyl adsorbed on copper surfaces in water containing sulfides, sulfites or thiosulfates [J]. Corrosion Science, 2003, 45(6): 1191-1201.
[24] KONG D, XU A, DONG C, MAO F, XIAO K, LI X, MACDONALD D D. Electrochemical investigation and ab initio computation of passive film properties on copper in anaerobic sulphide solutions [J]. Corrosion Science, 2017, 116: 34-43.
[25] GRUSHEVSKAYA S, KUDRYASHOV D, VVEDENSKII A. Anodic formation of AgI oxide on Ag-Au alloys [J]. Croatica Chemica Acta, 2008, 81(3): 467-475.
[26] NOSKOV A V, GRISHINA E P, PIMENOVA A M. Anodic oxidation of Ag-Cu alloys in sulfuric acid solutions [J]. Protection of Metals, 2008, 44(4): 348-351.
[27] BANERJEE K, GHOSH S, PLIS E, KRISHNA S. Sulfide as surface passivation for InAs/GaSb superlattices using X-Ray photoelectron spectroscopy [J]. Journal Electronic Materials, 2010, 39(10): 2210-2214.
[28] LEON-VELAZQUEZ M S, IRIZARRY R, CASTRO-ROSARIO M E. Nucleation and growth of silver sulfide nanoparticles [J]. Journal of Physical Chemistry C, 2010, 114(13): 5839-5849.
[29] GRASSINI S. Electrochemical impedance spectroscopy (EIS) for the in-situ analysis of metallic heritage artefacts [M]. Cambridge, UK: Woodhead Publishing Limited, 2013.
[30] LVOVICH V F. Impedance spectroscopy: Applications to electrochemical and dielectric phenomena [M]. London: Wiley and Sons, 2012.
[31] ORAZEM M E, TRIBOLLET B. Electrochemical Impedance Spectroscopy [M]. New Jersey: Wiley and Sons, 2008.
[32] LASIA A. Electrochemical impedance spectroscopy and its applications [M]. New York: Springer; London: Heidelberg Dordrecht, 2014.
[33] FAVRE-QUATTROPANI L, GROENING P, RAMSEYER D, SCHLAPBACH L. The protection of metallic archaeological objects using plasma polymer coatings [J]. Surface Coatings Technology, 2000, 125(1-3): 377-382.
[34] DEGRIGNY C, TANGUY E, LE GALL R, ZAFIROPULOS V, MARAKIS G. Laser cleaning of tarnished silver and copper threads in museum textiles [J]. Journal Cultural Heritage, 2003, 4(1): 152-156.
[35] BECK L, BOSONNET S, REVEILLON S, ELIOT D, PILON F. Silver surface enrichment of silver�Ccopper alloys: A limitation for the analysis of ancient silver coins by surface techniques [J]. Nuclear Instruments and Methods in Physics Research Section. 2004, 226(1-2): 153-162.
[36] BERNARD M C, DAUVERGNE E, EVESQUE M. Reduction of silver tarnishing and protection against subsequent corrosion [J]. Corrosion Science, 2005, 47(3): 663-679.
[37] NAKAYAMA S. Highly selective determination of copper corrosion products by voltammetric reduction [J]. Sei Technical Review, 2016, 82: 96-101.
[38] OGUZIEA E E, LI J, LIU B Y, CHEN B D, LI Y, YANG B K, WANG A F. The effect of Cu addition on the electrochemical corrosion and passivation behavior of stainless steels [J]. Electrochimica Acta, 2010, 55(17): 5028-5035.
[39] WALTER G W. Application of impedance measurements to study performance of painted metals in aggressive solutions [J]. Journal Electroanalytical Chemistry and Interfacial Electrochemistry, 1981, 118: 259-273.
[40] SHARMA S P, THOMAS III J H. Dielectric breakdown of Ag2S in the Au-Ag2S-Ag system [J]. Journal of Applied Physics, 1976, 47(5): 1808-1811.
[41] SOROKIN G P, PARADENKO A P. Electrical property of Cu2S [J]. Soviet Physics Journal, 1966, 9: 59.
[42] CORDOBA P, MESQUITA T J, NOGUEIRA R P. Influence of geometry-induced current and potential distributions on the characterization of constant-phase element behavior [J]. Electrochimica Acta, 2013, 87: 676-685.
[43] HSU H, MANSFELD F. Technical note: Concerning the conversion of the constant phase element parameter Y0 into a capacitance [J]. Corrosion Science, 2001, 57(9): 747-748.
[44] HARRINGTON S P, DEVINE T M. Relation between the semiconducting properties of a passive film and reduction reaction rates [J]. Journal of the Electrochemical Society, 2009, 156(4): C154-C159.
[45] FRANKEL GS, SRIDHAR N. Understanding localized corrosion [J]. Materials Today, 2008, 11(10): 38-44.
[46] COTTIS R A, TURGOOSE S, NEUMAN R R. Corrosion testing made easy: Impedance and noise analysis [M]. Houston, United States: NACE Naternational, 1999.
[47] BOCKRIS J O' M, NAGY Z. Symmetry factor and transfer coefficient. A source of confusion in electrode kinetics [J]. Journal of Chemical Education, 1973, 50 (12): 839-843.
[48] YIN Qi, WANG Zhen-yao, PAN Chen. Initial corrosion behavior of pure zinc in simulated tropical marine atmosphere [J]. Transactions of Nonferrous Metals Society of China, 2018, 28: 2582-2591.
[49] TRASATTI S. Handbook of fuel cells: Reaction mechanism and rate determining steps [M]. USA: John Wiley & Sons, Ltd., 2010.
J. ORTIZ-CORONA, F. J. RODRIGUEZ-GOMEZ
Departamento de IngenierIa Metalurgica, Facultad de QuImica, Universidad Nacional AutOnoma de Mexico, Ciudad de Mexico, C.P. 04510, Mexico
ժ Ҫ�����ڱ�¶�����ﻷ��(H2S)�У��������Ͻ��������к͵�ѧ���������ᷢ��һЩ�仯�������Ļ��Ų�������Ʒ��ʴ�ͷ��������һ�����⡣���õ绯ѧ�迹��(EIS)��ɨ���������(SEM)��������0.925��0.800��0.720���Ͻ���0.07%(�������)�����Һ�н�û��ͬʱ���ʧ�������ͭ�����á��������߱�����ͭ����������ʹ��ʴ�����ܶ������ӻ����Ͻ�Ķۻ����ڿ�·����(OCP)���õ����迹�׳��ֲ������ġ�ѹ��ĵ�һ�ݿ������������ת�Ƶ������źϽ���ͭ������������͡��෴��˫���������ͭ�������������SEM-EDS��������������S������Cu��Ӧ�����Ͻ��еĸ�ͭ�౻ѡ�����ܽ⣬���¾ֲ���ʴ���Ӷ��ӻ��ۻ�Ĥ���γɡ���ͭ�����ϵ͵ĺϽ��й۲쵽���Եľֲ���ʴ�����������Ͻ�ʧ��Ļ���ȡ���ںϽ�������Լ�ͭ����Ľϴ�����������ͭ�ܽ��γɸ�ʴ����Ĺ��̱���Ϊ�����ʾ������衣
�ؼ��ʣ���; ����������ʧ�绯ѧ�迹�ף����Ͻ𣻸�ʴ����
(Edited by Xiang-qun LI)
Corresponding author: F. J. RODRIGUEZ-GOMEZ; E-mail: fxavier@unam.mx
DOI: 10.1016/S1003-6326(19)65171-X

