
J. Cent. South Univ. (2018) 25: 1879-1887
DOI: https://doi.org/10.1007/s11771-018-3877-6

Frictional characteristics of sheet metals with superimposed ultrasonic vibrations
Cao Miao-yan(曹秒艳)1, LI Jian-chao(李建超)2, LIU Yan-yang(刘艳阳)2,YUAN Ya-ning(苑亚宁)3, ZHAO Chang-cai(赵长财)3, DONG Guo-jiang(董国疆)4
1. National Engineering Research Center for Equipment and Technology of Cold Strip Rolling,Yanshan University, Qinhuangdao 066004, China;
2. Chinese Academy of Agricultural Mechanization Sciences, Beijing 100083, China;
3. Key Laboratory of Advanced Forging & Stamping Technology and Science of Ministry of Education of China, Yanshan University, Qinhuangdao 066004, China;
4. College of Vehicles and Energy, Yanshan University, Qinhuangdao 066004, China
 Central South University Press and Springer-Verlag GmbH Germany, part of Springer Nature 2018
Abstract: The forming performance of sheet metals in the deep-drawing process with ultrasonic vibrations can be improved by the surface effect between the sheet metal and the die. A sheet metal friction test with ultrasonic vibrations is performed to explore the cause of the surface effect. The frictional characteristics are investigated, and the corresponding friction expressions are established based on the contact mechanics and the elastic–plastic contact model for rough surfaces. Friction is caused by the elastic–plastic deformation of contacting asperities under normal loads. The actual contacting region between two surfaces increases with normal loads, whereas the normal distance decreases. The normal distance between the contacting surfaces is changed, asperities generate a tangential deformation with ultrasonic vibrations, and the friction coefficient is eventually altered. Ultrasonic vibrations are applied on a 40Cr steel punch at the frequency of 20 kHz and the amplitude of 4.2 μm. In the friction tests, the punch is perpendicular to the surface of the magnesium alloy AZ31B sheet metals and is sliding with a relative velocity of 1 mm/s. The test results show that the friction coefficient is decreased by approximately 40% and the theoretical values are in accordance with the test values; Ultrasonic vibrations can clearly reduce wear and improve the surface quality of parts.
Key words: friction; ultrasonic vibrations; sheet metals; contact model
Cite this article as: Cao Miao-yan, LI Jian-chao, LIU Yan-yang, YUAN Ya-ning, ZHAO Chang-cai, DONG Guo-jiang. Frictional characteristics of sheet metals with superimposed ultrasonic vibrations [J]. Journal of Central South University, 2018, 25(8): 1879–1887. DOI: https://doi.org/10.1007/s11771-018-3877-6.
1 Introduction
Ultrasonic-imposed metal forming processes are gradually introduced with the development of metal plastic processing technologies and ultrasonics. Previous studies have identified several benefits of such processes in generating force, reducing deformation resistance, and improving formability and surface quality. Ultrasonic vibrations affect the formation process through stress superposition [1], volume effect [2], and surface effect [3, 4]. Volume effect reduces yield stress and vibration influence on dislocation movement. Surface effect reduces the effective friction coefficient through periodic reductions in the contact area or periodic changes in the direction of the friction force vector. Several studies have been conducted to clarify such effects and obtain further details regarding the friction mechanism of ultrasonic vibration-assisted forming processes [5–11]. Ultrasonic vibrations have been applied on sliding surfaces in various ways (Figure 1). KUMAR [6] conducted several tests by applying vibrations that were longitudinal and transverse to the sliding direction as shown in patterns 1 and 2 of Figure 1. Longitudinal vibration is more effective than transverse vibration in reducing friction, and velocity ratio significantly influences friction reduction. LITTMANN et al [7] applied vibrations parallel to the relative sliding direction using a 60 kHz piezoelectric actuator that slid along a guide track as shown in pattern 1 in Figure 1. DONG et al [8, 9] successfully generated vibrations by conjugating patterns 1 and 3 through Poisson effect. They also investigated friction reduction using various normal loads, contact metals, and global stiffness values.
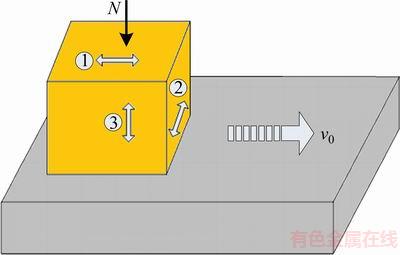
Figure 1 Ways of applying ultrasonic vibrations
Ultrasonic vibrations have been applied in the deep-drawing process of sheet metals to reduce forming load and improve forming limit [12–15]. JIMMA et al [13] applied ultrasonic vibrations in the deep-drawing process of sheets and determined that axial vibration was highly beneficial for the formation of sheet metals by comparing and analyzing different modes of vibrations. WEN et al [15] conducted ultrasonic vibration-drawing experiments on magnesium alloy sheets at room temperature and then analyzed the influence of high-frequency vibrations on the deformation behavior of AZ31B magnesium alloy sheets. SIDDIQ et al [16] and ASHIDA et al [17] found that using ultrasonic energy could prevent wrinkling and cracking during the press-forming process by reducing the friction force between the sheet metal and the die.
A schematic illustration of the deep-drawing technology for sheets is presented in Figure 2. The forming equipment consists of a die, a blank holder, and a punch. JIMMA et al [13] found that axial vibration had a greater role than radial vibration in increasing the limit drawing ratio. They then classified axial ultrasonic vibrations into blank holder (type 1) and die (type 2) as shown in Figure 2. Both types of vibrations were perpendicular to the sliding direction of the sheets. Many studies [14–17] have suggested that the friction force in the flange area can considerably influence the forming property of sheet metals and can be reduced by imposing ultrasonic vibrations.

Figure 2 Schematic of deep-drawing technology
To explore the frictional characteristics of the deep-drawing process for sheet metals with ultrasonic vibrations, a new test device that determines the friction coefficient of sheet metals with ultrasonic vibrations is designed in this study. A relational expression between friction and ultrasonic vibrations is then established by considering the elastic–plastic deformation of the asperities.
2 Experimental setup
A friction test for sheets with ultrasonic vibrations is conceived and designed to simulate the load bearing state of a sheet flange during the drawing process with ultrasonic vibrations. Figure 3 shows the test setup and its schematic diagram. The main parts of the test system include: 1) the ultrasonic generator, which is connected to the sandwich piezoelectric ceramic ultrasonic transducer; 2) the horn, which transmits vibrations longitudinally at 20 kHz from the transducer into the step-shaped punch; 3) the ultrasonic vibration system, which is installed in the framework in which the normal loads are applied; 4) the guide rods and the fixed block, which can effectively improve perpendicularity between the punch and the sheets; 5) the sliding block; 6) the linear guide; and 7) the push rod.
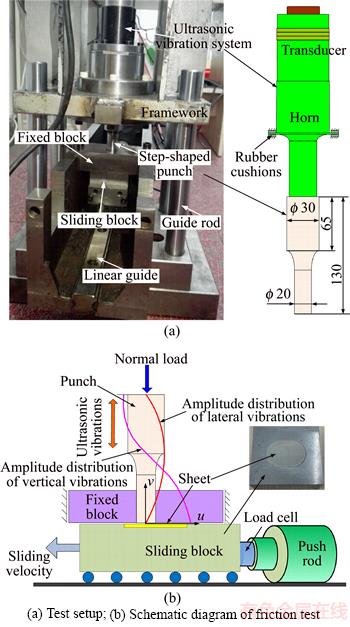
Figure 3 Friction test of sheets (unit: mm):
A series of friction tests with different fixed normal loads and sliding velocities is conducted. The corresponding friction force is measured to study the influence of ultrasonic vibrations on friction reduction. Normal loads are provided by the weights on the top surface of the framework, which function as contact loads between the punch and the sheet.
Figure 3(a) shows the dimensions of the punch. The punch made of 40Cr steel is perpendicular to the sheet embedded into the groove (Figure 3(b)) of the sliding block. Therefore, the ultrasonic vibrations and the sliding movements are perpendicular to each other. The punch is pressed against the surface of the sheet metals, and the sheet metals are then attached to the sliding block that moves at different velocities with a linear actuator (IAI RCM-101-MW). The sliding block is supported by high-precision linear guides, and the friction force is measured using a 200 N load cell attached to the sliding block and the linear actuator. The output from the load cell amplifier is digitized and recorded in a PC.
The normal load is approximately 1510 N, which provides a mean nominal contact pressure of up to 4.81 MPa on the flat end of the punch. Two rubber cushions are installed on both sides of the horn flange to avoid friction heat generated by high-frequency vibrations (Figure 3(a)). The sheet metals are composed of aluminum (5052) and magnesium (AZ31B) alloys. The surface of the sheet metals and the end of the punch are added with or without lubricant before each test. All the experiments are performed in air at 22 °C and 30% relative humidity. Five measurements are performed for each set of conditions, and the reported data points represent the mean and the total range of friction force values.
3 Elastic–plastic contact model
Contact between rough surfaces is among the most challenging problems in local and international tribology research. Solving this problem has scientific and engineering significance, and the numerical solution for this problem serves as the basis of friction analysis, wear, and lubrication problems. Asperities of different shapes are present in all surfaces as shown in Figure 4. The geometric features of surfaces decisively influence friction under dry friction and mixed lubrication conditions.
When two solid nominal flat surfaces are in contact, such contact actually occurs at asperities. Therefore, the actual contact area is considerably smaller than the nominal contact surface.
The cube model is used to represent combined asperities (Figure 4). Ar is assumed as the top surface area of the cube and is equivalent to the real area of the two contacting surfaces, whereas d denotes the height of the cube and is equivalent to the distance between the two surfaces.

Figure 4 Asperities at interface between two contacting surfaces and cube model:
Deformation occurs at the contacting region. Such deformation can either be elastic, plastic, or elastic–plastic depending on nominal pressure, surface roughness, and material properties. In 1966, GREENWOOD et al [18] introduced a basic elastic contact model, which assumed that contact between two rough surfaces could be replaced by one rough surface in contact with a smooth surface. In this model, the rough surface is isotropic and the asperity peaks have spherical shapes with a uniform radius Rs. The height of these peaks above a reference plane has a normal (Gaussian) probability density function. Bulk deformation is not considered in this model, but volume displacement is considered when ultrasonic vibrations are applied.
Contacting asperities are considered elastic deformation in the model of Greenwood and Williamson, which is only suitable for smooth or hard surfaces with extremely low loads [19]. When normal loads increase, contacting asperities are considered plastic deformation. Realistic contact is an elastic–plastic deformation [20]. In particular, the high asperity peak is a plastic deformation, whereas the low asperity peak is an elastic deformation. Therefore, the critical interference of an asperity at the inception of plastic deformation ωc is computed as follows [21]:
 (1)
(1)
where Rs is the average radius of the asperity peaks; H is the hardness of the softer material; K is a hardness coefficient that is related to Poisson ratio υ of the softer material, and K=0.454+0.41υ; E* is the combined elastic modulus of the two materials and is expressed as follows:
 (2)
(2)
where E1, E2 and ν1, ν2 denote the elastic modulus and Poisson ratios of the two contacting materials, respectively.
Assuming that the probability density function of the asperity height f is an exponential function instead of a Gaussian distribution, we obtain the following [21]:

where z is the mean asperity height; and c and λ are the constant coefficients with values of 17 and 3, respectively.
The dimensionless elastic load  and the plastic load
  are expressed as follows [20]:

 (3)
(3)
 (4)
(4)
where β is the roughness parameter β=ηRqRs, η is the areal density of asperities, Rq is the standard deviation of surface roughness, and  is the integral of the Gaussian distribution that is computed as follows:

As the summation of the elastic and plastic loads, the total dimensionless contact load  is expressed as follows:
 (5)
(5)
The dimensionless contact load F*=F/AnE* for an elastic–plastic contact of rough surfaces is defined by CHANG et al [20]. The elastic, plastic, and total contact loads are expressed as 
 and
and respectively, where An is the nominal contact area. The value of d corresponding to Fn can be calculated using Eqs. (3) to (5).
The total actual contact area, Ar, which is the summation of the elastic and plastic areas, can be computed as follows:
 (6)
(6)
where the real elastic area of contact Ae and the real plastic area of contact Ap are expressed as follows:
 (7)
(7)
 (8)
(8)
The dynamic friction Ft is expressed as follows:
 (9)
(9)
where δ is the deformation. As shown in Figure 4, the deformation can be calculated as follows [22]:
 (10)
(10)
where Ft0 denotes the static friction that is measured from the friction tests; vrel denotes the relative velocity; and Kt denotes the tangential contact stiffness that can be expressed as follows [23]:
 (11)
(11)
where u, v and w denote the in-plane horizontal direction, the in-plane vertical direction, and the out-of-plane perpendicular to the sliding direction, respectively. As shown in Figure 3, ultrasonic vibrations are projected along the v direction, and the distance between two surfaces d is changed. The new value of d with ultrasonic vibrations is computed as follows:
 (12)
(12)
The influence of projection w on friction is assumed to be small, and projection u changes microscopic deformation δ. Therefore, new deformation δ′ with ultrasonic vibrations can be expressed as follows:
 (13)
(13)
The value of the new actual contact area  can be updated using Eqs. (6) to (8). Therefore, the value of the new tangential contact stiffness
  can be expressed as follows:
 (14)
(14)
The stick–slip effect between the two surfaces generated by ultrasonic vibrations was verified by SIEGERT et al [24]. Stick and slip phases alternately occur at an ultrasonic period through the sliding process. These phases are assumed to occur only once in the half period (denoted by T). Therefore, the dynamic friction with ultrasonic vibrations can be expressed as follows:
 (15)
(15)
where 
 d′, δ′, u and v are time-dependent.
Figure 3 shows the amplitude distribution of lateral vibrations. The lateral and longitudinal time- dependent displacements of the top surface of the punch are represented as follows:
 (16)
(16)
 (17)
(17)
where A and B are the amplitudes of vibrations in the lateral and longitudinal directions, respectively; and f is the frequency of ultrasonic vibrations. Given that the top surface of the punch is the lateral vibration node, A has a minimal value.
The actual vibration amplitudes A and B are obtained using OptoMET laser vibrometer. The values of A and B are 0.03 μm and 4.2 μm, respectively.
4 Results and discussion
4.1 Contact parameters
Two tests are performed to investigate the frictional characteristics. Test 1 observes the sliding movement between the 40Cr steel punch and the AZ31B magnesium alloy sheet, whereas test 2 observes the sliding movement between the 40Cr steel punch and the 5052 aluminum sheet. Table 1 provides the values of the contact model parameters. The values of Rq, Rs and η are estimated using the comparison standards for surface roughness. The contact parameters of the simulation are similar in both tests. Figures 5 and 6 show the curves of d and Ar under different contact loads of the two tests, respectively.
Figure 5 shows that the contact loads decrease rapidly with increasing cube heights. The elastic–plastic model predicts more normal loads between 40Cr steel and AZ31B than between 40Cr steel and 5052. The separation for tests 1 and 2 is approximately 16 μm under normal loads of 339 N and 299 N, respectively. A smaller separation at the same normal load condition indicates a larger real contact area. When the first contacting asperities generate plastic deformation, the plastic regions continue to expand without additional resisting force. Therefore, more asperity contacts are formed and a larger real contact area is generated as contact load increases (Figure 6).
Table 1 Parameters used in cube model simulations
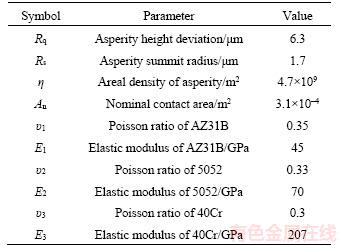
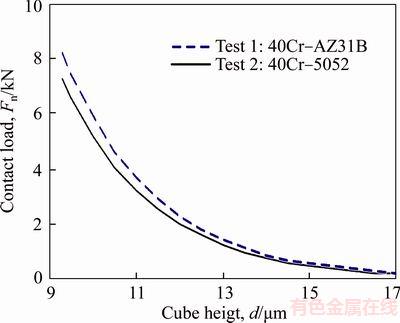
Figure 5 Contact load Fn vs cube height d
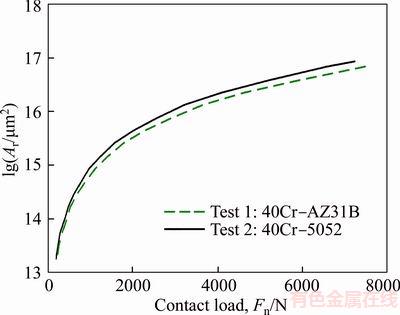
Figure 6 Actual contact area Ar vs contact load Fn
4.2 Friction force of test without ultrasonic vibrations
Figure 7(a) shows the curves of the friction forces of 40Cr–AZ31B versus sliding displacement S with different normal forces. When a certain normal force is applied, the friction forces increase rapidly from the minimum to their maximum values and then gradually decrease to a constant because the friction coefficient of the static contact at the beginning of sliding is higher than that of the dynamic contact.
The friction force at a specified normal force can be obtained using the average value of the friction force curves from the samples. Figures 7(b) and (c) show the Ft–Fn curves of 40Cr–AZ31B and 40Cr–5052 combinations at different relative sliding velocities. Either 40Cr–AZ31B or 40Cr– 5052 exhibits favorable linearity between friction forces and contact loads, that is, the dynamic friction coefficients are constant. However, the 40Cr–5052 combination demonstrates poor linearity when the contact load is 1207 N, which may be caused by an experimental error. Figure 7 shows that friction forces decrease with increasing relative sliding velocities. In contrast to the two tests results, the friction force of 40Cr–AZ31B is more than that of 40Cr–5052 under the same contact loads.
4.3 Effect of friction reduction with ultrasonic vibrations
Figure 8 shows the changing tendency of the dynamic friction coefficient of 40Cr–AZ31B with sliding displacement by superimposing ultrasonic vibrations. The friction coefficient of the Coulomb law μ=Ft/Fn is calculated according to friction Ft and contact load Fn. The friction coefficient μ fluctuates according to the sliding displacement, and the average μ is reduced from 0.274 to 0.168 when ultrasonic vibrations are applied.
Figure 9 shows the μ–Fn curves of 40Cr–AZ31B at different sliding velocities. With the superimposed ultrasonic vibrations, the values of μ are nearly the same at three different sliding velocities. Moreover, friction decreases with increasing sliding velocity. Therefore, drawing velocity only slightly affects vibration.
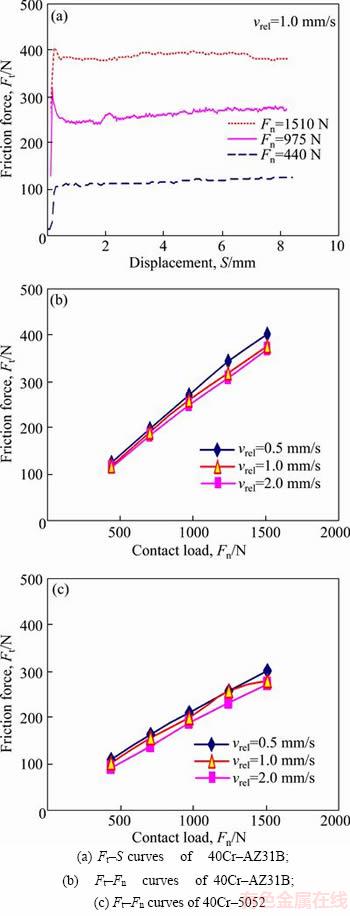
Figure 7 Friction force curves of friction test:
Figure 10 compares the dynamic friction coefficients of the test and model simulation results of 40Cr–AZ31B with vrel=1 mm/s. The test values agree well with the theoretical model simulations and validate the results of the theoretical analyses in the friction test with ultrasonic vibrations. The reduction in the dynamic friction coefficients is computed as z=(μn–μw)/μn, where μn is the dynamic friction coefficient without ultrasonic vibrations,and μw is the dynamic friction coefficient with ultrasonic vibrations. The z values of 40Cr–AZ31B with vrel=1 mm/s are between 39.1% and 42.2%. The surface topography of the AZ31B sheets in the tests is observed via Axio Scope A1 (Figure 11). Fretting wear occurs on the sheet surface with ultrasonic vibrations, whereas scratches become serious without ultrasonic vibrations. Therefore,ultrasonic vibrations can reduce wear and improve the surface quality of parts.

Figure 8 Dynamic friction coefficients of test under dry lubricating conditions
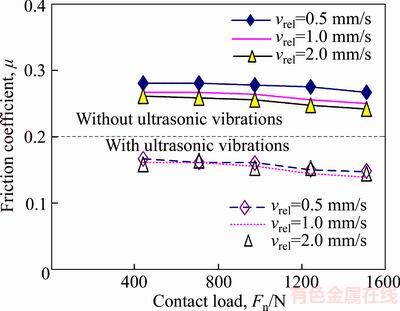
Figure 9 Test value curves of μ–Fn of 40Cr–AZ31B
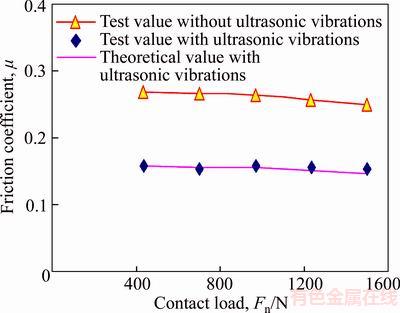
Figure 10 Test and theoretical μ values of 40Cr–AZ31B
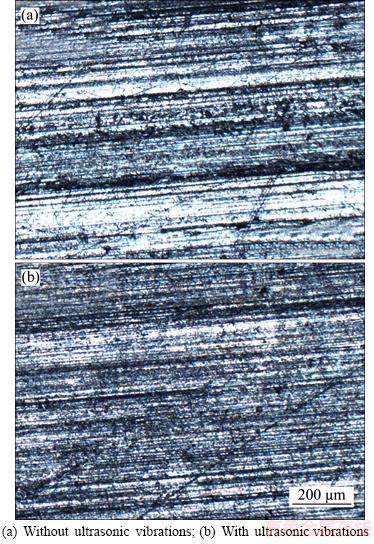
Figure 11 Comparison of AZ31B sheet surface topography:
5 Conclusions
1) The comparison of the theoretical and experimental values shows that the frictional characteristic of sheet metals with ultrasonic vibrations can be exactly simulated using the elastic–plastic contact model for rough surfaces, which is established based on contact mechanics.
2) As contact load on a rough surface increases, surface asperities from the initial elastic deformation are developed into plastic deformation, whereas all asperities are developed into elastic–plastic deformation. The actual contacting region between two surfaces increases simultaneously with decreasing normal distance.
3) The normal distance between contacting surfaces is changed and asperities generate tangential deformation with ultrasonic vibrations. Therefore, friction force is clearly reduced.
References
[1] EAVES A E, SMITH A W, WATERHOUSE W J, SANSOME D H. Review of the application of ultrasonic vibrations to deforming metals [J]. Ultrasonics, 1975, 13(4): 162–170.
[2] KIRCHNER H O K, KROMP W K, PRINZ F B, TRIMMEL P. Plastic deformation under simultaneous cyclic and unidirectional loading at low and ultrasonic frequencies [J]. Materials Science and Engineering, 1985, 68(2): 197–206.
[3] LEE K H, LEE S K, KIM B M. Advanced simulation of die wear caused by wire vibrations during wire-drawing process [J]. Transactions of Nonferrous Metals Society of China, 2012, 22(7): 1723–1731.
[4] NGAILE G, BUNGET C. Influence of ultrasonic vibration on microforming [J]. Transactions of NAMRI/SME, 2008, 36: 137–144.
[5] STORCK H, LITTMANN W, WALLASCHEK J, MRACEK M. The effect of friction reduction in presence of ultrasonic vibrations and its relevance to travelling wave ultrasonic motors [J]. Ultrasonics, 2002, 40: 379–383.
[6] KUMAR V C, HUTCHINGS I M. Reduction of the sliding friction of metals by the application of longitudinal or transverse ultrasonic vibration [J]. Tribology International, 2004, 37(10): 833–840.
[7] LITTMANN W, STORCK H, WALLASCHEK J. Sliding friction in the presence of ultrasonic oscillations: Superposition of longitudinal oscillations [J]. Archive of Applied Mechanics, 2001, 71(8): 549–554.
[8] DONG S, DAPINO M J. Piezoelectrically-induced ultrasonic lubrication by way of Poisson effect [J]. Proc Spie, 2012, 8343: 83430L.
[9] DONG S, DAPINO M J. Elastic–plastic cube model for ultrasonic friction reduction via Poisson’s effect [J]. Ultrasonics, 2014, 54: 343–350.
[10] POPOV V L, STARCEVIC J, FILIPPOV A E. Influence of ultrasonic in-plane oscillations on static and sliding friction and intrinsic length scale of dry friction processes [J]. Tribology Letters, 2010, 39(1): 25–30.
[11] HE Yu-hui, ZHOU Qun, ZHOU Jian-jie, LANG Xian-jun. Comprehensive modeling approach of axial ultrasonic vibration grinding force [J]. Journal of Central South University, 2016, 23(3): 562–569.
[12] Huang Y M, Wu Y S, Huang J Y. The influence of ultrasonic vibration-assisted micro-deep drawing process [J]. International Journal of Advanced Manufacturing Technology, 2014, 71(5–8): 1455–1461.
[13] Jimma T, Kasuga Y, Iwaki N, Miyazawa O, Mori E, Ito K, Hatano H. An application of ultrasonic vibration to the deep drawing process [J]. Journal of Materials Processing Technology, 1998, 80–81: 406–412.
[14] CAO Miao-yan, LI Jian-chao, YUAN Ya-ning, ZHAO Chang-cai. Flexible die drawing of magnesium alloy sheet by superimposing ultrasonic vibration [J]. Transactions of Nonferrous Metals Society of China, 2017, 27(1): 163–171.
[15] WEN Tong, GAO Rui, CHEN Xia. Influence of high frequency vibration on deep drawing process of AZ31 sheet at room temperature [J]. Journal of Shanghai Jiao Tong University: Science, 2012, 17(4): 456–460. (in Chinese)
[16] SIDDIQ A, SAYED T E. Ultrasonic-assisted manufacturing processes: Variational model and numerical simulations [J]. Ultrasonics, 2012, 52(4): 521–529.
[17] ASHIDA Y, AOYAMA H. Press forming using ultrasonic vibration [J]. Journal of Materials Processing Technology, 2007, 187–188(3): 118–122.
[18] GREENWOOD J A, WILLIAMSON J B P. Contact of nominally flat surfaces [J]. Proceedings of the Royal Society A: Mathematical Physical and Engineering Sciences, 1966, 295(1442): 300–319.
[19] Cohen D, Klingerman Y, Etsion I. A model for contact and static friction of nominally flat rough surfaces under full stick contact condition [J]. Journal of Tribology, 2008, 130(3): 117–139.
[20] CHANG W R, ETSION I, BOGY D B. An elastic-plastic model for the contact of rough surfaces [J]. Journal of Tribology, 1987, 109(2): 257–263.
[21] POLYCARPOU A A, ETSION I. Analytical approximations in modeling contacting rough surfaces [J]. Journal of Tribology, 1999, 121(2): 234–239.
[22] Dahl P. A Solid friction model [R]. Los Angeles: Aerospace Corp El Segundo Ca, 1968.
[23] Craig R C. Mechanics of materials [M]. New York: John Wiley & Sons, 2000.
[24] SIEGERT K, ULMER J. Influencing the friction in metal forming processes by superimposing ultrasonic waves [J]. CIRP Annals-Manufacturing Technology, 2001, 50(1): 195–200.
(Edited by YANG Hua)
中文导读
超声激励下金属板材摩擦特性
摘要:在金属板材超声辅助拉深工艺中,超声激励在板材与模具间所产生的表面效应提高了板材成形性能。为了探讨表面效应的成因,设计超声振动激励下金属板材摩擦试验,对超声激励下金属板材摩擦特性进行了研究。同时,基于接触力学理论和粗糙表面弹–塑性接触模型,建立了超声振动激励下金属板材摩擦力表达式。板材摩擦力起源于接触微凸体承受法向力后产生的弹塑性变形,随着接触力的增加两个表面间的实际接触面积增加,同时二者间法向距离减小。超声振动改变了接触面间的法向距离和切向变形,故对摩擦系数产生影响。在垂直于板材表面施加振动频率为20 kHz、振幅为4.2 μm的超声激励,在相对速度为1 mm/s的条件下,采用40Cr压头对AZ31B镁合金板材进行摩擦试验。试验结果表明,超声振动使板材摩擦系数降低了大约40%,摩擦系数试验值与理论值基本一致;超声振动可以减小板材表面划痕,有利于提高其拉深成形件表面质量。
关键词:摩擦;超声振动;金属板材;接触模型
Foundation item: Projects(51775480, 51305385) supported by the National Natural Science Foundation of China; Project (E2018203143) supported by the Natural Science Foundation of Hebei Province, China
Received date: 2016-03-18; Accepted date: 2016-06-16
Corresponding author: ZHAO Chang-cai, PhD, Professor; Tel/Fax: +86-13633333873; E-mail: zhao1964@ysu.edu.cn; ORCID: 0000- 0001-7400-7203

