����SCA��BPANNģ�͵Ľ��� Ti-55511�Ͻ���ѹ��������Ϊ�Ա�
��Դ�ڿ����й���ɫ����ѧ��(Ӣ�İ�)2021���6��
�������ߣ�ʷ˫ϲ ������ ����Ӿ �ܿƳ�
����ҳ�룺1665 - 1679
�ؼ��ʣ�Ti-55511�Ͻ�����Ӧ����Arrhenius�������̣������˹������磻����Ԫ
Key words��Ti-55511 alloy; flow stress; Arrhenius constitutive equation; back-propagation artificial neural network; finite element
ժ Ҫ��ͨ����ѹ��ʵ���о�Ti-55511�Ͻ��ڱ����¶�973~1123 K��Ӧ������0.01~10 s-1�����µ�������Ϊ������Ӧ�䲹��Arrhenius (SCA)�ͷ����˹�������(BPANN)�����Ը��ȱ��ι��̱�����ϵ���н�ģ����ͨ��ͳ�Ʒ����ͽ�����֤��ģ�ͽ���������������ģ����չ��Ӧ����Ӧ������ֲ������Ԫ��������ѹ��ʵ����̡��������������Ӧ�����¶Ⱥ�Ӧ���������У���Ӧ�����ʵ����ӻ��¶ȵĽ��Ͷ����ӡ�����5�ζ���ʽ��ϵ�SCAģ�ͺ�12����Ԫ��BPANNģ�;��������Ͻ�������Ϊ����BPANN��Ͼ��ȸ���SCA��16�ν�����֤����Ҳ֤ʵBPANNģ�;��нϸߵ�Ԥ�⾫�ȡ�����ģ��Ӧ���ڷ������Ч���У���BPANNģ���ڷ��澫�����нϴ����ơ�
Abstract: The flow behavior of Ti-55511 alloy was studied by hot compression tests at temperatures of 973-1123 K and strain rates of 0.01-10 s-1. Strain-compensated Arrhenius (SCA) and back-propagation artificial neural network (BPANN) methods were selected to model the constitutive relationship, and the models were further evaluated by statistical analysis and cross-validation. The stress-strain data extended by two models were implanted into finite element to simulate hot compression test. The results indicate that the flow stress is sensitive to deformation temperature and strain rate, and increases with increasing strain rate and decreasing temperature. Both the SCA model fitted by quintic polynomial and the BPANN model with 12 neurons can describe the flow behaviors, but the fitting accuracy of BPANN is higher than that of SCA. Sixteen cross-validation tests also confirm that the BPANN model has high prediction accuracy. Both models are effective and feasible in simulation, but BPANN model is superior in accuracy.
Trans. Nonferrous Met. Soc. China 31(2021) 1665-1679
Shuang-xi SHI1, Xiu-sheng LIU2, Xiao-yong ZHANG1,3, Ke-chao ZHOU1
1. State Key Laboratory of Powder Metallurgy, Central South University, Changsha 410083, China;
2. Wuhan Research Institute of Materials Protection, Wuhan 430030, China;
3. Shenzhen Research Institute, Central South University, Shenzhen 518057, China
Received 1 July 2020; accepted 5 April 2021
Abstract: The flow behavior of Ti-55511 alloy was studied by hot compression tests at temperatures of 973-1123 K and strain rates of 0.01-10 s-1. Strain-compensated Arrhenius (SCA) and back-propagation artificial neural network (BPANN) methods were selected to model the constitutive relationship, and the models were further evaluated by statistical analysis and cross-validation. The stress-strain data extended by two models were implanted into finite element to simulate hot compression test. The results indicate that the flow stress is sensitive to deformation temperature and strain rate, and increases with increasing strain rate and decreasing temperature. Both the SCA model fitted by quintic polynomial and the BPANN model with 12 neurons can describe the flow behaviors, but the fitting accuracy of BPANN is higher than that of SCA. Sixteen cross-validation tests also confirm that the BPANN model has high prediction accuracy. Both models are effective and feasible in simulation, but BPANN model is superior in accuracy.
Key words: Ti-55511 alloy; flow stress; Arrhenius constitutive equation; back-propagation artificial neural network; finite element
1 Introduction
Near �� titanium alloys such as Ti-55511 (Ti-5Al-5Mo-5V-1Cr-1Fe) have been widely used to fabricate some key load-bearing components in aerospace field due to their high specific strength, excellent corrosion resistance and good fracture toughness [1-3]. Thermoplastic processing is an important technology for manufacturing high-performance titanium alloy components with low cost and short cycle [4]. These components are generally processed by hot forging, which can reduce the plastic deformation resistance and ensure the good service performance of final forgings. Hot working changes the microstructure of titanium alloys by controlling the processing parameters, thereby changing its mechanical properties [5]. However, the processing window of titanium alloy is narrow and the microstructure of titanium alloy is sensitive to processing parameters [6]. Furthermore, the hot deformation process involves many physical fields. It is difficult to adjust the flow behaviors of titanium alloy due to multi-field coupling. Therefore, it is imperative to deeply study the hot flow behaviors of titanium alloys.
The complex flow behavior of Ti-55511 alloy in the ��+�� region is the result of competition among work hardening (WH), dynamic recovery (DRV) and dynamic recrystallization (DRX) [7,8]. The macroscopic mechanical response of materials is closely related to these evolutions [9]. Therefore, the understanding of flow behaviors under hot deformation condition is of great significance to study microstructure evolution. In addition, the finite element (FE) simulation as an important tool for researching and optimizing forging process is widely used to predict the deformation flow mode [10]. However, the constitutive model which can accurately characterize the deformation behaviors of Ti-55511 alloy and be used for FE simulation is still limited. Therefore, it is necessary to establish a constitutive model of Ti-55511 alloy to make full use of the advanced modeling technique.
In recent years, many researchers try to build constitutive models based on experimental data to accurately describe the hot deformation behaviors of titanium alloys. The constitutive models can be divided into three categories: phenomenological, physical and artificial intelligence models [11]. The common phenomenological models include parallel probability model, Johnson-Cook (JC) model and Arrhenius model [12-14]. The metallurgical phenomena and deformation mechanisms of titanium alloy during the hot deformation process are complicated. Therefore, the establishment process of physical model is cumbersome, and the accuracy of the model is difficult to guarantee [15,16]. The Arrhenius model can effectively describe the hot deformation behaviors of titanium alloys. The Arrhenius model is usually expressed as a hyperbola function of temperature, strain rate and flow stress [17]. It is shown that the Arrhenius model should be modified to improve prediction accuracy by considering the influence of strain on deformation behaviors [18-21]. XIA et al [22] and PENG et al [23] constructed a modified Arrhenius model to predict the flow behaviors of Ti-6Al-4V-0.1Ru and as-cast Ti60 alloys. However, this modified model also has some disadvantages such as low prediction accuracy and poor generalization ability to new experimental data. In addition, it is quite cumbersome to modify the Arrhenius constitutive equation [24]. Artificial neural network (ANN) as an artificial intelligence method is very suitable for mapping complex and nonlinear relations [25]. According to the experimental data, back-propagation artificial neural network (BPANN) can effectively train the model to predict the flow stress of titanium alloys under other deformation conditions. GAN and ZHAO [26], CHEN et al [27] and QUAN et al [28] conducted BPANN models to accurately predict the flow behaviors of Ti-5Al-5Mo-5V-3Cr-1Zr, Ti-6Al-3Nb-2Zr-1Mo and Ti-6Al-4V alloys, respectively.
In this study, the strain compensated Arrhenius (SCA) model and the BPANN model were comparatively investigated to predict the deformation behaviors of Ti-55511 alloy at high temperature. Firstly, a series of true stress-strain data were obtained by isothermal compression tests in the temperature range of 973-1123 K and the strain rate range of 0.01-10 s-1, and the characteristics of hot deformation behaviors were analyzed according to strain-stress curves. Secondly, SCA model and BPANN model were established by using the experimental data, respectively. The correlation coefficient (R), average absolute relative error (AARE) and relative error (��) were used to further evaluate these two models. Finally, the stress-strain data extended by two models were implanted into the FE to verify the validity and reliability of models.
2 Experimental
The as-forged Ti-55511 alloy bar with a diameter of 300 mm in this investigation was received from Hunan Gold Sky Titanium Industry Technology Co. Ltd. (China). The chemical compositions (wt.%) were 5.20 Al, 4.92 Mo, 4.96 V, 1.05 Cr, 0.96 Fe and balance Ti. The �� transus temperature was about (1148��5) K. The compression samples of d10 mm �� 15 mm were machined from the forged bar and mechanically polished. Before the hot compression tests, the argon was used to protect the specimens from oxidation, and the thin graphite sheets and tantalum sheets were placed between the specimens and anvils to minimize the friction. The experimental route is shown in Fig. 1. Firstly, the specimens were heated to the selected test temperature at a rate of 10 K/s and held for 3 min in order to ensure a homogeneous temperature distribution. Then, the hot compression tests were conducted on a Gleeble-3500 thermal simulator at different temperatures (973, 1023, 1073 and 1123 K) and different strain rates (0.01, 0.1, 1 and 10 s-1). All specimens were compressed to a deformation degree of 50% and water quenched immediately. The true stress-strain curves were recorded automatically.
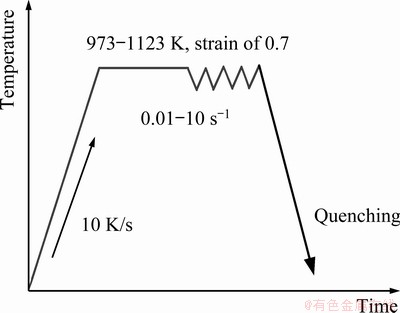
Fig. 1 Experimental route for hot compression
3 Results
3.1 True stress-strain curves
The true stress-strain curves of Ti-55511 alloy at different temperatures and strain rates (temperatures of 973, 1023, 1073 and 1123 K, and strain rates of 0.01, 0.1, 1 and 10 s-1) are shown in Fig. 2. The flow stress is sensitive to deformation temperature and strain rate, and increases with increasing strain rate and decreasing deformation temperature. At high strain rate, the dislocation accumulation rate is high and the flow softening time is limited, which results in the increase of critical shear stress. High deformation temperature can accelerate dislocation slipping and climbing, and then slow down the work hardening. At the same time, it can reduce the bonding force among atoms and the critical shear stress of the material. In addition, the stress-strain curves under different deformation conditions have similar characteristics. In the early stage of deformation, the rapid growth of dislocation density leads to work hardening, and the stress increases rapidly to the peak stress (sp) in a very small strain range. With further increasing the strain, the flow stress curves enter the continuous softening stage following the peak stress. Previous researches show that the softening mechanisms include deformation thermal effect, DRV, DRX and rheological instability, etc [29]. Subsequently, work hardening and dynamic softening reach a balance, and the curves enter the steady state.
3.2 Strain compensated Arrhenius model
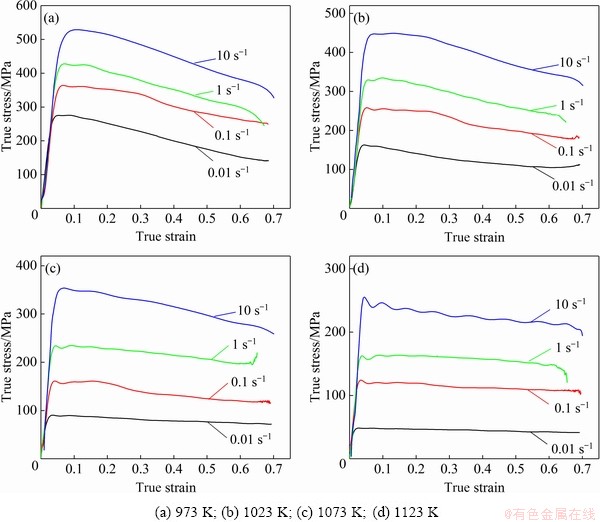
Fig. 2 True stress-strain curves of Ti-55511 under different deformation conditions
SELLARS and MCTEGART [30] proposed a Arrhenius constitutive equation for high-temperature thermal deformation of alloys, which can describe the relationship among flow stress, deformation temperature and strain rate under constant strain. Furthermore, the effects of temperature and strain rate on the deformation behaviors are described by Zener-Hollomon (Z) parameter. The Arrhenius model can be denoted as [31,32]
 (1)
(1)
where  is the strain rate (s-1), T is the absolute temperature (K), R is the universal gas constant (8.314 J��mol-1��K-1), Q is the activation energy (kJ/mol), �� is the flow stress (MPa), A, n, �� and n1 are material constants, and �� is the stress exponent which can be identified as ��=��/n1. Equation (1) is suitable for different stress levels, including low stress level (����<0.8), high stress level (����>1.2) and all stress level.
The flow stress of Ti-55511 alloy under different hot deformation conditions can be calculated by

 (2)
(2)
To calculate the values of material constants (n, ��, Q, A) in the model, natural logarithm is taken for both sides of Eq. (1). It can be derived that n1=  ln/ ln ��, ��= ln/ ��, and n= ln/ ln[sinh(����)]. In addition, the values of Q and ln A can be calculated from Eq. (3) and (4), respectively:
 (3)
(3)
 (4)
(4)
The relationships of ln -ln �� and ln -�� are plotted in Figs. 3(a) and 3(b) by substituting the experimental data at the strain of 0.4. The values of n1 and �� can be obtained from the slope of the lines plotted in Figs. 3(a) and 3(b) to be n1=5.6534 and ��=0.03009 MPa-1, respectively. The value of �� is identified to be 0.005322. The value of constant n can be calculated according to the mean slope of the lines in Fig. 3(c), and n=4.1412. The value of S can be obtained from the slope of the lines on ln[sinh(����)]-T-1 plots (Fig. 3(d)). The value of Q is calculated to be 345.7423 kJ/mol. Q is an important parameter to characterize the difficulty of hot deformation. According to Eq. (4), the value of ln A can be calculated as 37.4827 by intercept of the line plotted in Fig. 3(e).
However, the above model parameters estimated by regression method can only reflect the constitutive relationship under certain strain. The influence of strain on the flow stress is not considered in Arrhenius model. In fact, the flow stress usually varies with strain, especially when DRX occurs. Therefore, in order to establish the Arrhenius model with strain compensation, the model parameters in the strain range of 0.05-0.6 (interval 0.05) can be obtained by the same method. The values of the model parameters under various strain conditions are given in Table 1.
The strain-compensated Arrhenius (SCA) model is established to extend its application under different strain conditions. The functional relationship between model parameters and strain is described by n-order regression polynomial. In order to determine the fitting order, the goodness of fit measured by Adj. R-square is used to evaluate the fitting performance of 1-8 order polynomials. The effects of polynomial order on the model fitting performance are shown in Fig. 4. Obviously, the SCA model fitted by quintic polynomial has high goodness of fit and few constants. As shown in Fig. 5, the relationships between model parameters (n, ��, Q, ln A) and strain are fitted by quintic polynomials, and expressed by Eq. (5). In addition, the coefficients of the quintic polynomials are listed in Table 2.
 (5)
(5)
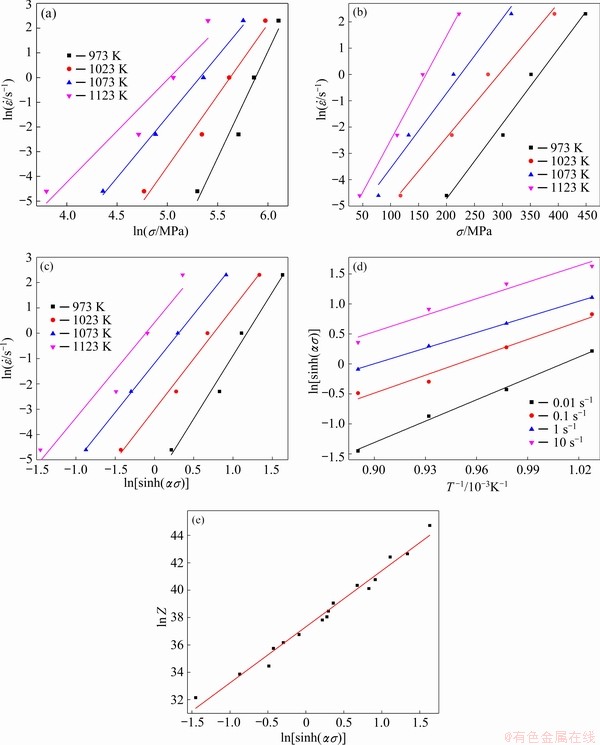
Fig. 3 Linear relationships of ln -ln �� (a), ln -�� (b), ln -ln[sinh(����)] (c), ln[sinh(����)]-T-1 (d) and ln Z-ln[sinh(����)] (e)
3.3 Back-propagation artificial neural network (BPANN) model
BPANN, a typical black box method, can accurately map the nonlinear relationship between input and output data without establishing a specific mathematical model. It is a multilateral feedforward neural network, which uses forward propagation algorithm to calculate the output of neural network. The minimum error between network output and target output is taken as the criterion. The back-propagation algorithm can dynamically adjust the weights and thresholds to make the error function decrease along the negative gradient. If the error meets the requirement, the calculation will be terminated. BPANN is often used to solve complex nonlinear problems in engineering. The well-trained BPANN model can effectively predict and evaluate the flow stress of alloys [33,34].
Table 1 Values of model parameters under various strain conditions

In this work, a BPANN model is established to predict the flow stress of Ti-55511 alloy. A single hidden layer network with sufficient neuron nodes can approximate any nonlinear relationship. In addition, increasing the number of hidden layers can improve the accuracy of network training, but it will reduce the speed of network operations and lead to over-fitting. Therefore, the network structure of single hidden layer is selected in this work. The input layer has three nodes, corresponding to deformation temperature, strain rate and strain. The output layer has only one node, the flow stress. The structure of BPANN is shown in Fig. 6.
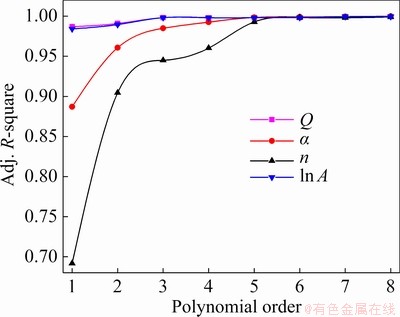
Fig. 4 Influence of polynomial order on model fitting performance
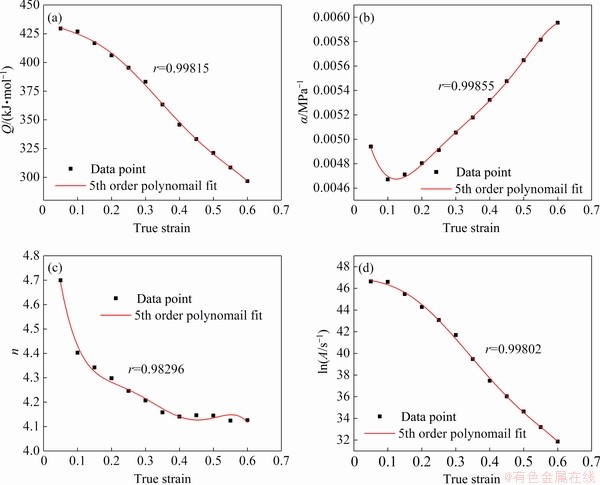
Fig. 5 Fitted curves of Q (a), �� (b), n (c) and ln A (d) vs true strain by quintic polymomials
Table 2 Coefficients of quintic polynomials
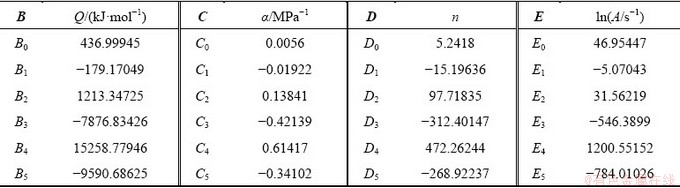
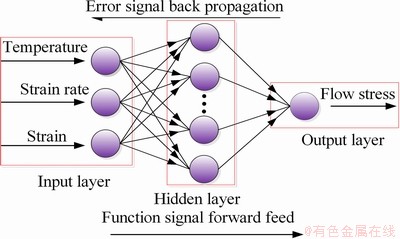
Fig. 6 Structure of BPANN model
The input-output pairs corresponding to the strain range of 0.05-0.6 (interval of 0.05) are extracted from 16 stress-strain curves and used as a training dataset (192 pairs). The input-output pairs corresponding to the strain range of 0.125-0.525 (interval of 0.1) are used as validation dataset (80 pairs). The input-output pairs corresponding to the strain range of 0.175-0.575 (interval of 0.1) are used as test dataset (80 pairs). The deformation temperatures vary from 973 to 1123 K, the strain rates vary from 0.01 to 10 s-1, the strain vary from 0.05 to 0.6, and the flow stresses vary from 42.4942 to 526.1982 MPa. These mean that the range of input and output data varies greatly, the scale of the data is inconsistent, and the measurement unit is not uniform. Therefore, it is necessary to standardize the original experimental data, so that all variables with the same scale are suitable for comprehensive comparison and evaluation to speed up the convergence of the training network. The input and output data are widely normalized to [-1, 1] using the following formula:
 (6)
(6)
where X is the original data; Xmin and Xmax are the minimum and maximum values of X, respectively; X' is the normalized data corresponding to X.
The number of hidden layer neurons is the key to determine the structure of the BPANN and is closely related to the accuracy of the model. The influence of hidden layer neurons on network performance is complex. On one hand, if the number of hidden layer neurons is too small, the trained neural network may not have the full learning ability to get the perfect mapping between input and output signals. On the other hand, too many neurons will slow down the training speed and even lead to over fitting. It is difficult to accurately determine the number of hidden layer nodes by mathematical optimization method. Therefore, some network structures with different neuron nodes are tested by trial and error method. The mean square error (MSE) is used to evaluate the performance of a specific network structure, which can be presented as
 (7)
(7)
where Ei and Pi are the experimental values and predicted values, respectively; m is the total number of training samples.
Figure 7 shows the influence of neuron numbers on MSE. The BPANN model with 12 neurons in hidden layer has the minimum MSE, which means that the model fitting performance of this network structure is the best. The initial weights are generated randomly in the training process. The ��tansig�� function and ��purelin�� function are the transfer functions in the hidden layer and the output layer, respectively. In the meantime, the ��trainlm�� function is used as training function. The target error is set to be 0.00001, and the number of iterations is 10000. After many attempts, the BPANN constitutive model of Ti-55511 alloy with 3��12��1 structure is developed.
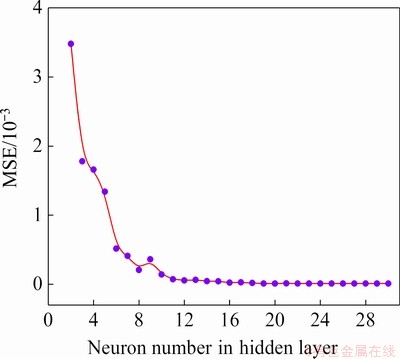
Fig. 7 Influence of neuron number in hidden layer on MSE
Three statistical indicators, namely correlation coefficient (r), relative error (��) and average absolute relative error (AARE), were quantified to evaluate the accuracy of the two models. These three statistical indicators are expressed by Eqs. (8)-(10), respectively:
 (8)
(8)
 (9)
(9)
 (10)
(10)
where ��ei and ��pi are the experimental and the fitted values, respectively;  and
and  are the average values of experimental and fitted stresses, respectively; m is the total number of samples.
The comparison between the experimental flow stresses and the fitted flow stresses is shown in Fig. 8. As can be seen from Fig. 8(a), almost all fitted stresses are well overlapped with experimental stresses, which directly shows that the BPANN model has good fitting and prediction accuracy. Figures 8(b-d) present another form of comparative plots to further understand the generalization capability of the BPANN model, which contains different dataset used in BPANN model. For a perfect prediction, the experimental values and the fitted values should be equal to each other, and all the data sets should lie on the best fitting line. As shown in Figs. 8(b-d), it can be seen that most of the data points are very close to the best fitting line. The R-values corresponding to training dataset, validation dataset and test dataset are 0.99972, 0.99974 and 0.99987, respectively. The fitted and predicted values of the BPANN model are highly correlated with the experimental values. The AARE-values corresponding to training dataset, validation dataset and test dataset are 0.8384%, 0.8639% and 0.8442%, respectively. The errors of fitting and predicting are small and stable. Therefore, the BPANN model is well trained and has strong generalization ability.
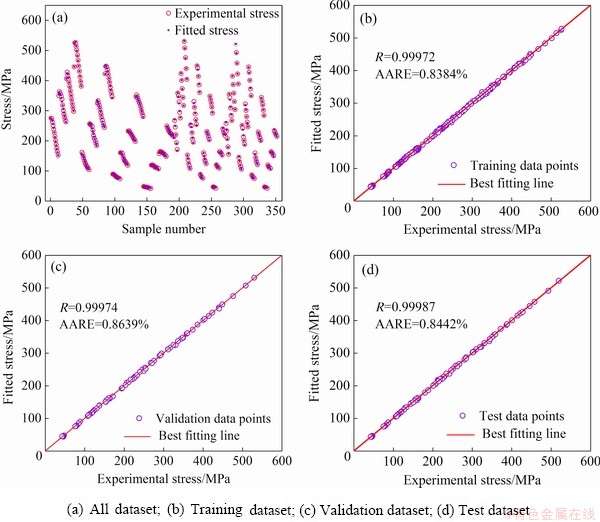
Fig. 8 Comparison between fitted stress from BPANN model and experimental stress
4 Discussion
4.1 Comparison of precision between SCA model and BPANN model
After the constitutive models of Ti-55511 alloy considering strain compensation and based on BPANN are established, respectively, the fitted stresses corresponding to the strain range of 0.05-0.6 are calculated according to two models. The fitting results of SCA model and BPNN model are compared in detail, as shown in Fig. 9. It can be displayed that the fitted results of SCA and BPANN model are in good agreement with the experimental results. Meanwhile, the well-trained BPANN model has a better precision than the SCA model in fitting the flow stress.
Figure 10 shows another form of comparison between the experimental results and the fitted results. For two models, most of the data points are located close to the best fitting line. The R-value and AARE-value of the SCA model are 0.98102 and 6.8158%, respectively. The R-value and AARE-value of the BPANN model are 0.99973 and 0.8455%, respectively. Therefore, the fitting results of the BPANN model have better correlation and accuracy than those of SCA model.
In addition, the performances of the two developed models are evaluated by relative errors. The results are described in the form of frequency histogram, as shown in Figs. 11(a, b). The results show a typical normal distribution. This indicates that the relative errors calculated by the SCA model vary between -17.9% and 31.4%, while those change from -4.3% to 5.3% by the BPANN model. Meanwhile, the relative errors calculated by the SCA model are within ��10% for 82.7% data pionts; while the relative errors calculated by the BPANN model is within ��2% for 89.8% data points. The results mean that the BPANN model is more accurate than the SCA model in fitting the flow stress of Ti-55511 alloy, which is in agreement with the previous results.
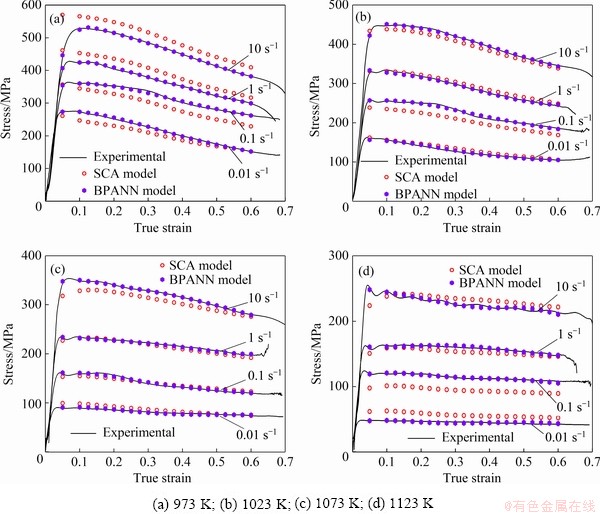
Fig. 9 Comparisons between experimental stress and fitted stress models by SCA and BPANN
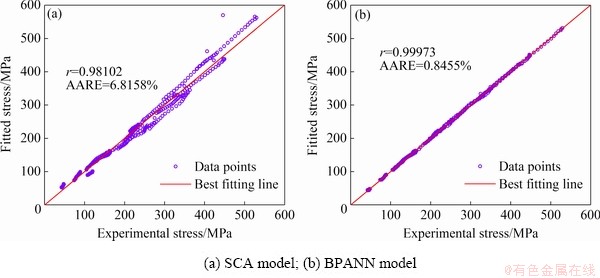
Fig. 10 Correlation between experimental and fitted flow stress values
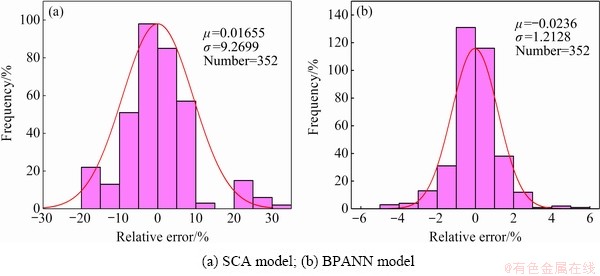
Fig. 11 Errors distribution of two models
4.2 Cross-validation of SCA and BPANN models
Although the fitting ability of the developed BPANN and SCA models have been verified in Section 4.1, the superiority and applicability of these two methods in describing hot deformation behaviors have not been fully demonstrated. Therefore, it is necessary to further evaluate the performance of the models. Generalization ability is generally regarded as one of the important attributes related to the applicability and reliability of modeling methods. It mainly reflects the prediction ability under non training conditions [35].
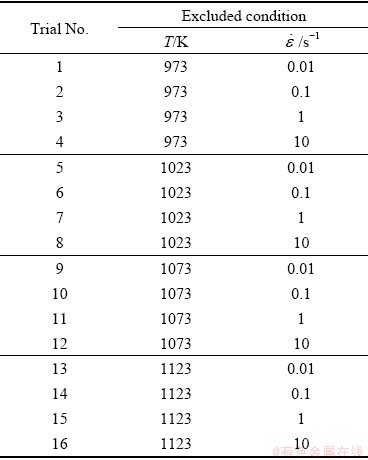
In order to evaluate the previously-developed model which can accurately predict the hot deformation behaviors, leave-one-out cross- validation processes are performed. The cross-validation method is described in detail [36-39]. The models are verified by extracting the stress- strain experimental curves one by one and 16 trial datasets are constructed, as listed in Table 3. The models are subsequently established by the excluded conditions for each extracted curve, and the excluded conditions are predicted and verified with the test results. Finally, cross-validations are performed 16 times. The comparisons between the predicted and experimental values in trials 1-4 are shown in Fig. 12(a). The AARE-values of the two models in 16 cross-validation trials are compared, as shown in Fig. 12(b). The cross-validation results confirm that the two models have low errors. The errors of the BPANN model are lower than those of SCA, which shows that the BPANN model is better than the SCA model in predicting the flow behaviors of Ti-55511 alloy.
Table 3 Excluded conditions in trail datasets
4.3 Model application and validation based on FE simulation
The rationality of the constitutive model can be further evaluated by FE simulation. The stress-strain data obtained from hot compression tests are limited, and the accuracy of FE simulation mainly depends on the number of input stress- strain data. Here, the SCA model and BPNN model are applied to enriching the stress-strain data of Ti-55511 alloy. Two stress-strain data schemes are set up in the simulation process. In Scheme-A, the true stress-strain data are calculated by SCA model at the strain rate of 0.1-10 s-1 and the temperatures of 973-1123 K with an interval of 25 K. The true stress-strain data under the same conditions calculated by BPANN model are applied to Scheme-B. These data are implanted in FE simulation software DEFORM-3D for the hot compression simulation, and the validity of the developed constitutive models is further investigated [40].

Fig. 12 Cross-validation of models
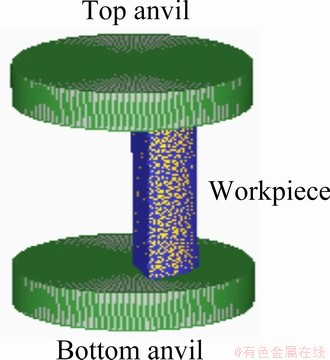
Fig. 13 Three-dimensional finite element model
Figure 13 show the FE simulation model of hot compression, in which the the cylindrical workpiece is defined as a plastic body and the two anvils are defined as rigid bodies. The initial workpiece with d10 mm �� 15 mm is consistent with the hot compression specimen. Only one-sixth of the workpiece is used in the FE simulation due to axial symmetry. The shear friction coefficient between anvils and workpiece is 0.3, and the thermal radiation and thermal conduction between objects are considered to simulate the real experimental conditions. The simulation is carried out at 1048 K and 0.5 s-1, and the workpiece is compressed to 50% height. Besides, the bottom anvil is fixed, and the movement of the top anvil is set by displacement control mode. The movement speed of top anvil is calculated as follows:
 (11)
(11)
where v stands for the movement speed of anvil, h0 stands for the initial height of specimen, and t stands for the motion time of top anvil.
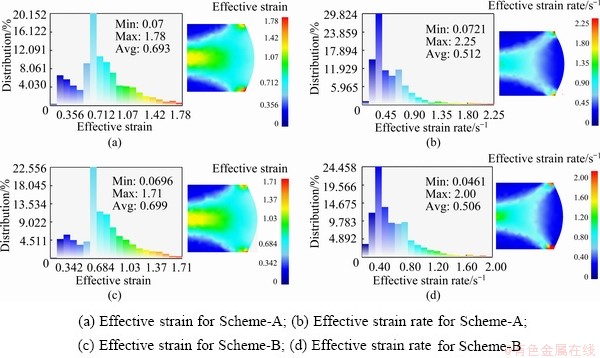
Fig. 14 Field distributions at temperature of 1048 K, strain rate of 0.5 s-1 and deformation degree of 50%
Figure 14 describes the effective strain field and the effective strain rate field of the hot deformed workpiece. The strain field can be roughly divided into three regions: large deformation, small deformation and difficult deformation. The average strains of Scheme-A and Scheme-B are 0.693 and 0.699, respectively. The average strain rates of Scheme-A and Scheme-B are 0.512 and 0.506 s-1, respectively. In addition, typical bulging phenomenon appears in the workpiece for each scheme. In summary, the simulated physical quantities show a good agreement with the experimental conditions.
The comparison between the simulated and measured load-stroke curves is described in Fig. 15. The mechanical response trend of each scheme is basically consistent with the test result. Moreover, the results illustrate that the developed BPANN model is valid and feasible to simulate the hot compression process of Ti-55511 alloy. The simulation accuracy of BPANN model is higher than that of SCA model. It is consistent with the fact that the accuracy of BPANN model in predicting flow stress is higher than that of SCA model. The BPANN model is used to expand the stress-strain data, so that the simulation accuracy can be improved by reducing the interpolation interval.
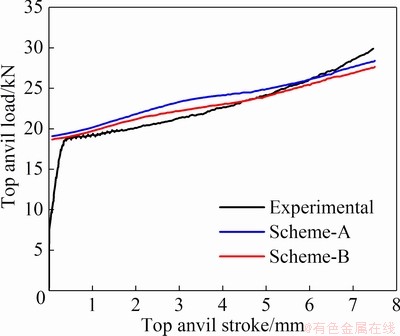
Fig. 15 Comparison between simulated and measured load-stroke curves at 1048 K and 0.5 s-1
5 Conclusions
(1) The flow stress of Ti-55511 alloy is sensitive to deformation temperature and strain rate, and increases with increasing strain rate and decreasing deformation temperature.
(2) The model material parameters (i.e. ��, n, Q and A) fitted by quintic polynomial of strain are very appropriate, and the SCA model has a certain fitting accuracy. The R-value and AARE-value of SCA model are 0.98102 and 6.8158%, respectively.
(3) The BPANN model with 12 neurons demonstrates strong ability to predict the flow stress during hot compression. The fitted and predicted values of BPANN model have a high correlation with the experimental values, up to 0.9997. The errors of fitting and predicting are small and stable. The AARE-values are in the range of 0.8%-0.9%.
(4) BPANN model has higher accuracy and generalization ability than SCA model in fitting flow stress by statistical analysis and cross- validation. The correlation coefficient of BPANN model is higher than that of SCA model; the AARE of BPANN is 0.8455%, which is far less than 6.8158% of SCA model; the standard deviation of BPANN model is 1.2128, which is only 13.1% of SCA model. The developed BPANN model is valid and feasible in simulation. The simulation accuracy of BPANN model is higher than that of SCA model.
Acknowledgments
The authors are grateful for the financial supports from the National Natural Science Foundation of China (No. 51871242), and Guang- dong Province Key-Area Research and Develop- ment Program, China (No. 2019B010943001).
References
[1] CHEN Wei, LI Chao, ZHANG Xiao-yong, CHEN Chao, LIN Y C, ZHOU Ke-chao. Deformation-induced variations in microstructure evolution and mechanical properties of bi-modal Ti-55511 titanium alloy [J]. Journal of Alloys and Compounds, 2019, 783: 709-717.
[2] QU F S, ZHOU Y H, ZHANG L Y, WANG Z H, ZHOU J. Research on hot deformation behavior of Ti-5Al-5Mo- 5V-1Cr-1Fe alloy [J]. Materials and Design, 2015, 69: 153-162.
[3] CHEN Wei, LV Ya-ping, ZHANG Xiao-yong, CHEN Chao, LIN Y C, ZHOU Ke-chao. Comparing the evolution and deformation mechanisms of lamellar and equiaxed microstructures in near ��-Ti alloys during hot deformation [J]. Materials Science and Engineering A, 2019, 758: 71-78.
[4] WU He, XU Wen-chen, WANG Si-bing, YANG Zhong-ze, CHEN Yu, TENG Bu-gang, SHAN De-bin, GUO Bin. A cellular automaton coupled FEA model for hot deformation behavior of AZ61 magnesium alloys [J]. Journal of Alloys and Compounds, 2020, 816: 152562.
[5] SU Lian-peng, LIU Han-yuan, JING Lei, YU Zhen-tao, WANG Wen-xian, ZHOU Lian. Flow stress characteristics and microstructure evolution during hot compression of Nb-47Ti alloy [J]. Journal of Alloys and Compounds, 2019, 797: 735-743.
[6] WANJARA P, JAHAZI M. MONAJATI H, YUE S, IMMARIGEON J P. Hot working behavior of near-�� alloy IMI834 [J]. Materials Science and Engineering A, 2005, 396: 50-60.
[7] BALACHANDRAN S, KASHIWAR A, CHOUDHURY A, BANERJEE D, SHI R P, WANG Y Z. On variant distribution and coarsening behavior of the �� phase in a metastable �� titanium alloy [J]. Acta Materialia, 2016, 106: 374-387.
[8] KOTKUNDE N, KRISHNAMURTHY H N, PURANIK P, GUPTA A K, SINGH S K. Microstructure study and constitutive modeling of Ti-6Al-4V alloy at elevated temperatures [J]. Materials and Design, 2014, 54: 96-103.
[9] MA Li-xia, WAN Min, LI Wei-dong, SHAO Jie, BAI Xue-piao. Constitutive modeling and processing map for hot deformation of Ti-15Mo-3Al-2.7Nb-0.2Si [J]. Journal of Alloys and Compounds, 2019, 808: 151759.
[10] LUO Jiao, LI Miao-quan, LI Xiao-li, SHI Yan-pei. Constitutive model for high temperature deformation of titanium alloys using internal state variables [J]. Mechanics of Materials, 2010, 42(2): 157-165.
[11] CHEN Gao-jin, CHEN Liang, ZHAO Guo-qun, ZHANG Cun-sheng, CUI Wei-chao. Microstructure analysis of an Al-Zn-Mg alloy during porthole die extrusion based on modeling of constitutive equation and dynamic recrystallization [J]. Journal of Alloys and Compounds, 2017, 710: 80-91.
[12] LIU Jiang-lin, ZENG Wei-dong, LAI Yun-jin, JIA Zhi-qiang. Constitutive model of Ti17 titanium alloy with lamellar-type initial microstructure during hot deformation based on orthogonal analysis [J]. Materials Science and Engineering A, 2014, 597: 387-394.
[13] RAN Chun, SHENG Ze-min, CHEN Peng-wan, ZHANG Wang-feng, CHEN Qi. Effect of microstructure on the mechanical properties of Ti-5Al�C5Mo�C5V�C1Cr�C1Fe alloy [J]. Materials Science and Engineering A, 2020, 773: 138728.
[14] ABBASI S M, MOMENI A, AKHONDZADEH A, MIRSAED S M G. Microstructure and mechanical behavior of hot compressed Ti-6V-6Mo-6Fe-3Al [J]. Materials Science and Engineering A, 2015, 639: 21-28.
[15] SESHACHARYULU T, MEDEIROS S C, FRAZIER W G, PRASAD Y V R K. Hot working of commercial Ti-6Al-4V with an equiaxed ���C�� microstructure: Materials modeling considerations [J]. Materials Science and Engineering A, 2000, 284: 184-194.
[16] JIANG Yu-qiang, LIN Y C, PANG Guo-dong, HE Dao-guang, KOTKUNDE N. Constitutive model and processing maps for a Ti-55511 alloy in �� region [J]. Advanced Engineering Materials, 2020, 22: 1900930.
[17] WANG Zhen-jun, QI Le-hua, ZHOU Ji-ming, GUAN Jun-tao, LIU Jian. A constitutive model for predicting flow stress of Al18B4O33w/AZ91D composite during hot compression and its validation [J]. Computational Materials Science, 2011, 50(8): 2422-2426.
[18] LIANG Xiao-peng, LIU Yong, LI Hui-zhong, ZHOU Can-xu, XU Guo-fu. Constitutive relationship for high temperature deformation of powder metallurgy Ti-47Al- 2Cr-2Nb-0.2W alloy [J]. Materials and Design, 2012, 37: 40-47.
[19] XIAO J, LI D S, LI X Q, DENG T S. Constitutive modeling and microstructure change of Ti-6Al-4V during the hot tensile deformation [J]. Journal of Alloys and Compounds, 2012, 541: 346-352.
[20] QUAN Guo-zheng, SHI Yu, YU Chun-tang, ZHOU Jie. The improved Arrhenius model with variable parameters of flow behavior characterizing for the as-cast AZ80 magnesium alloy [J]. Materials Research, 2013, 16(4): 785-791.
[21] DONG En-tao, YU Wei, CAI Qing-wu, CHENG Lei, NING Zhen, SHI Jia-xin. High-temperature deformation behavior of TiNi-Nb hypoeutectic alloy [J]. Materials Science and Engineering A, 2019, 764: 138228.
[22] XIA Yu-feng, JIANG Wei, CHENG Qian, JIANG Lai, JIN Li. Hot deformation behavior of Ti-6Al-4V-0.1Ru alloy during isothermal compression [J]. Transactions of Nonferrous Metals Society of China, 2020, 30: 134-146.
[23] PENG Wen-wen, ZENG Wei-dong, WANG Qing-jiang, YU Han-qing. Comparative study on constitutive relationship of as-cast Ti60 titanium alloy during hot deformation based on Arrhenius-type and artificial neural network models [J]. Materials and Design, 2013, 51: 95-104.
[24] YAN Jie, PAN Qing-lin, LI An-de, SONG Wen-bo. Flow behavior of Al-6.2Zn-0.70Mg-0.30Mn-0.17Zr alloy during hot compressive deformation based on Arrhenius and ANN models [J]. Transactions of Nonferrous Metals Society of China, 2017, 27: 638-647.
[25] LI Hong-ying, HU Ji-dong, WEI Dong-dong, WANG Xiao-feng, LI Yang-hua. Artificial neural network and constitutive equations to predict the hot deformation behavior of modified 2.25Cr-1Mo steel [J]. Materials and Design, 2012, 42: 192-197.
[26] GAN Shou-wu, ZHAO Lei-na. A comparison study at the flow stress prediction of Ti-5Al-5Mo-5V-3Cr-1Zr alloy based on BP-ANN and Arrhenius model [J]. Materials Research Express, 2018, 5: 066505.
[27] CHEN Hai-sheng, FENG Yong, MA Fan-jiao, MAO You-chuan, LIU Xiang-hong, ZHANG Ping-xiang, KOU Hong-chao, FU Heng-zhi. Isothermal Compression Flow Stress Prediction of Ti-6Al-3Nb-2Zr-1Mo Alloy Based on BP-ANN [J]. Rare Metal Materials and Engineering, 2016, 45: 1549-1553.
[28] QUAN Guo-zheng, WEN Hai-rong, JIA Pan, ZOU Zhen-yu. Construction of processing maps based on expanded data by BP-ANN and identification of optimal deforming parameters for Ti-6Al-4V alloy [J]. International Journal of Precision Engineering and Manufacturing, 2016, 17: 171-180.
[29] GAO Peng-fei, FU Ming-wang, ZHAN Mei, LEI Zhen-ni, LI Yan-xi Li. Deformation behavior and microstructure evolution of titanium alloys with lamellar microstructure in hot working process: A review [J]. Journal of Materials Science & Technology, 2020, 39(4): 58-75.
[30] SELLARS C M, MCTEGART W J. On the mechanism of hot deformation [J]. Acta Metallurgica, 1966, 14(9): 1136-1138.
[31] LONG Shuai, XIA Yu-feng, WANG Peng, ZHOU Yu-ting, GONG-YE Fan-jiao, ZHOU Jie, ZHANG Jian-sheng, CUI Ming-liang. Constitutive modelling, dynamic globularization behavior and processing map for Ti-6Cr-5Mo-5V-4Al alloy during hot deformation [J]. Journal of Alloys and Compounds, 2019, 796: 65-76.
[32] ASHTIANI H R R, SHAHSAVARI P. Constitutive modeling of flow behavior of precipitation-hardened AA7022-T6 aluminum alloy at elevated temperature [J]. Transactions of Nonferrous Metals Society of China, 2020, 30: 2927-2940.
[33] XIA Yu-feng, LONG Shuai, ZHOU Yu-ting, ZHAO Jia, WANG Tian-yu, ZHOU Jie. Identification for the optimal working parameters of Ti-6Al-4V-0.1Ru alloy in a wide deformation condition range by processing maps based on DMM [J]. Materials Research, 2016, 19(6): 1449-1460.
[34] QUAN Guo-zheng, PU Shi-ao, ZHAN Zong-yang, ZOU Zhen-yu, LIU Ying-ying, XIA Yu-feng. Modelling of the hot flow behaviors for Ti-13Nb-13Zr alloy by BP-ANN model and its application [J]. International Journal of Precision Engineering and Manufacturing, 2015, 16: 2129-2137.
[35] XIAO Gang, YANG Qin-wen, LI Luo-xing. Modeling constitutive relationship of 6013 aluminum alloy during hot plane strain compression based on Kriging method [J]. Transactions of Nonferrous Metals Society of China, 2016, 26: 1096-1104.
[36] MOSLEH A O, MIKHAYLOVSKAYA A V, KOTOV A D, KWAME J S, AKSENOV S A. Superplasticity of Ti-6Al-4V titanium alloy: Microstructure evolution and constitutive modelling [J]. Materials, 2019, 12: 1756.
[37] MOSLEH A, MIKHAYLOVSKAYA A, KOTOV A, POURCELOT T, AKSENOV S, KWAME J, PORTNOY V. Modelling of the superplastic deformation of the near-�� titanium alloy (Ti-2.5Al-1.8Mn) using Arrhenius-type constitutive model and artificial neural network [J]. Metals, 2017, 7: 568.
[38] MOSLEH A O, KOTOV A D, MESTRE-RINN P, MIKHAYLOVSKAYA A V. Superplastic forming of Ti-4Al-3Mo-1V alloy: Flow behavior modelling and finite element simulation [J]. Procedia Manufacturing, 2019, 37: 239-246.
[39] MOSLEH A O, MESTRE-RINN P, KHALIL A M, KOTOV A D, MIKHAYLOVSKAYA A V. Modelling approach for predicting the superplastic deformation behaviour of titanium alloys with strain hardening/softening characterizations [J]. Materials Research Express, 2020, 7: 016504.
[40] SHI Ze-yan, QUAN Guo-zheng, AN Chao, QIU Hui-min, WANG Wei-yong, ZHANG Zhi-hua. Artificial intelligence model of complicated flow behaviors for Ti13Nb13Zr alloy and relevant applications [J]. Transactions of Nonferrous Metals Society of China, 2019, 29: 2090-2098.
ʷ˫ϲ1��������2������Ӿ1,3���ܿƳ�1
1. ���ϴ�ѧ ��ĩұ������ص�ʵ���ң���ɳ 410083��
2. �人���ϱ����о������人 430030��
3. ���ϴ�ѧ �����о�Ժ������ 518057
ժ Ҫ��ͨ����ѹ��ʵ���о�Ti-55511�Ͻ��ڱ����¶�973~1123 K��Ӧ������0.01~10 s-1�����µ�������Ϊ������Ӧ�䲹��Arrhenius (SCA)�ͷ����˹�������(BPANN)�����Ը��ȱ��ι��̱�����ϵ���н�ģ����ͨ��ͳ�Ʒ����ͽ�����֤��ģ�ͽ���������������ģ����չ��Ӧ����Ӧ������ֲ������Ԫ��������ѹ��ʵ����̡��������������Ӧ�����¶Ⱥ�Ӧ���������У���Ӧ�����ʵ����ӻ��¶ȵĽ��Ͷ����ӡ�����5�ζ���ʽ��ϵ�SCAģ�ͺ�12����Ԫ��BPANNģ�;��������Ͻ�������Ϊ����BPANN��Ͼ��ȸ���SCA��16�ν�����֤����Ҳ֤ʵBPANNģ�;��нϸߵ�Ԥ�⾫�ȡ�����ģ��Ӧ���ڷ������Ч���У���BPANNģ���ڷ��澫�����нϴ����ơ�
�ؼ��ʣ�Ti-55511�Ͻ�����Ӧ����Arrhenius�������̣������˹������磻����Ԫ
(Edited by Bing YANG)
Corresponding author: Xiao-yong ZHANG, Tel/Fax: +86-731-88830464, E-mail: zhangxiaoyong@csu.edu.cn
DOI: 10.1016/S1003-6326(21)65606-6
1003-6326/ 2021 The Nonferrous Metals Society of China. Published by Elsevier Ltd & Science Press

