J. Cent. South Univ. (2013) 20: 433�C439
DOI: 10.1007/s11771-013-1504-0

Traffic sign recognition algorithm based on shape signature and dual-tree complex wavelet transform
CAI Zi-xing(������)1, GU Ming-qin(������)1
School of Information Science and Engineering, Central South University, Changsha 410083, China
 Central South University Press and Springer-Verlag Berlin Heidelberg 2013
Abstract: A novel traffic sign recognition system is presented in this work. Firstly, the color segmentation and shape classifier based on signature feature of region are used to detect traffic signs in input video sequences. Secondly, traffic sign color-image is preprocessed with gray scaling, and normalized to 64��64 size. Then, image features could be obtained by four levels DT-CWT images. Thirdly, 2DICA and nearest neighbor classifier are united to recognize traffic signs. The whole recognition algorithm is implemented for classification of 50 categories of traffic signs and its recognition accuracy reaches 90%. Comparing image representation DT-CWT with the well-established image representation like template, Gabor, and 2DICA with feature selection techniques such as PCA, LPP, 2DPCA at the same time, the results show that combination method of DT-CWT and 2DICA is useful in traffic signs recognition. Experimental results indicate that the proposed algorithm is robust, effective and accurate.
Key words: traffic sign recognition; signature; DT-CWT; 2DICA; nearest neighbor classifier
1 Introduction
traffic signs recognition was a challenging problem in recently years and of vital importance to intelligent vehicle. Generally, traffic sign recognition included two stages: detection and classification.
There are 3 approaches mainly used to detect traffic signs. 1) Edge detection in gray image. Overett et al [1] used a fast histogram of oriented gradient features for pedestrian and sign detection. BELAROUSSI and TAREL [2] built a geometric model of the image gradient orientation to detect triangular signs. A self-organizing map (SOM) was used in Ref. [3] to extract a contour line and recognize the road-sign shape from it. These methods that searched traffic signs in gray image were mainly focused on shape analysis. They were quite time-consuming and sensitive to noise. 2) Clustering and intelligent feature analysis. Classifier such as Adaboost and features such as Haar, orientation correction [4] were employed to detect traffic sign in input images. The problem of boosted classifiers was that the algorithm expressed a bias against the weak classifier families. Ruta et al [5] adopted an image representation and discriminative feature selection method for road-sign recognition. Since it could exhaustively search over the feature set, the training time grows with respect to the number of features. 3) Image segmentation by threshold in specific color space, then analysis with geometrical edge [6�C10]. Common color spaces using image preprocessing were RGB [6], HIS [7], HSV [8], YUV [9] and CIEAM97 [10]. This approach achieved fine results for traffic signs detection and was adopted by majority researchers, but selecting appropriate thresholds to segment image was very difficult. Furthermore, varying illumination can severely influence detection results.
Image representation was important in the traffic sign recognition. ALAN et al [11] obtained traffic sign features by Gabor wavelets used to create similarity maps, which helped separating the class space into smaller more distinctive clusters. Hossain et al [12] used Hu moment invariants as features which sent to neural network classifier for traffic sign recognition. Color distance transform (CDT) and highly discriminative sign descriptors were presented for classifying similar traffic signs in Ref. [13].
There were also several traffic signs classification methods as: 1) cross-correlation template matching [14]. 2) support vector machine (SVM). Linear and Gaussian kernels SVM were used to shape classification and recognition for traffic sign respectively in Ref. [15]. 3) neural network (NN) [16]. LIM et al [17] applied principle component analysis(PCA) and Fisher��s linear discriminant (FLD) to extract pictogram discriminant features and proposed RBFNN based on Lyapunov stability theory to train and classify features. 4) other pattern recognition methods. Deng et al [18] proposed a novel framework using the sparse model for traffic sign information representation and a classifier using a probability method for classification. Nguwi and KOUZANI [7] modeled human brain��s cognitive process at the primary visual cortex to comprehend road sign. The above methods were either difficult to recognize traffic sign in urban environments or had high computing complexity.
Due to drawbacks of above methods, a novel algorithm was proposed in this work. Color transform and segmentation were introduced to find traffic signs candidates regions. Shape classifier based on signature feature was used to reject other regions and distinguish the shape of traffic signs. Dual-tree Complex Wavelet Transform (DT-CWT) was proposed for representing traffic sign image to improve excellent categorization. 2D Independent Analysis (2DICA) and the nearest neighbor classifier were used to make the traffic sign recognition task less expensive computationally and increase its accuracy.
2 Traffic signs detection
In China, traffic signs were designed in the standard geometrical shapes such as circle, octagon, triangle, rectangle, square and the distinctive colors like red, blue, yellow, etc. The messages of traffic signs were represented by the specific color and shape as depicted in Table. 1.
Table 1 chinese traffic sign classification by shape and color

2.1 Color segmentation of traffic signs
In RGB color space, pixel values were changed greatly with the brightness and saturation, it was difficult to apply threshold segmentation to obtain desired image. Therefore, each pixel��s RGB value  was converted as follows:
 (1)
(1)
where S=vR+vG+vB is the sum of R, G, B channel value. Through this transformation, each distinctive color of traffic signs can be separated from the surrounding environment with only one threshold value, i.e.:
 (2)
(2)
where, c��{red, blue, yellow}, (x, y) is the pixel coordinates, tc is set along different colors of traffic signs. After segmentation, superimposed image of three binary images corresponding feature color of traffic signs are shown in Fig. 1. Erosion and dilation on binary image were used to eliminate noise pixels, since the binary images had superfluous noise pixels which affected the subsequent process.
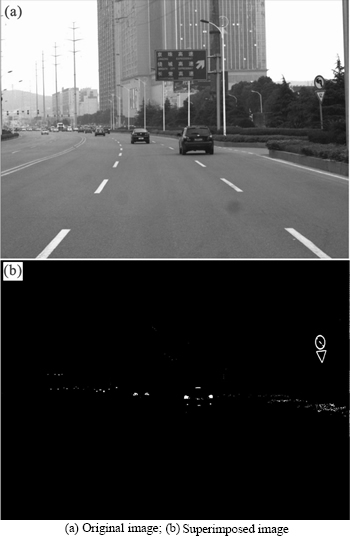
Fig. 1 color-based segmentation image:
three binary images corresponding different feature color(red, blue, yellow) regions whose pixels number were more than threshold were labeled as the traffic signs�� region of interest(ROI), and were sent to shape classification to decide whether they belonged to traffic signs candidates.
2.2 Shape classification of ROI
Shape signatures were used to distinguish different traffic sign shapes. In order to obtain shape signatures, the clockwise boundary of region shape was extracted, and denoted by (xi, yi)(i=1, ������, Nbp) and Nbp are the numbers of boundary points number. Barycenter was
computed by  . Then boundary sequence (xi, yi) was transformed to new coordinate system whose origin was Barycenter:

Then, radius as a function of changed angle was

where q��[0, 2p]. ri(q) was normalized as follows:
 (3)
(3)
In order to obtain feature shape, binary image was normalized to 30��30 image using bilinear interpolation algorithm, and then their features were extracted by above algorithm. Since the number of boundary points�� varied in different shapes, extracted features of shape were inconsistent. Therefore, obtained feature  needed to be expanded to 360 points by interpolation algorithm for the same number of feature. Figure 2 shows signatures of shape corresponding to two traffic signs in Fig. 1(a). The left images were the croping image and its corresponding binary shape image, respectively. The right figure was histogram of .
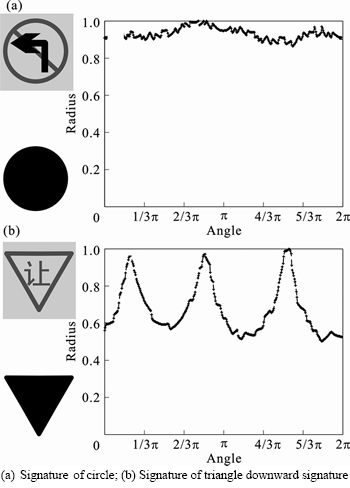
Fig. 2 signatures of two traffic sign shapes:
In order to classify the shape of ROI, a traffic sign shape (circle, octagon, triangle downward, equilateral triangle, rectangle) template database was established. Features of shape in template database were extracted by
above method, and denoted as  , i=1, ������, Ns, where Ns is the template number of class
 ,
,  { circle, octagon, triangle downward, equilateral triangle, rectangle}.
To obtained Ai,c, i��{1, 2, ������, N}, c��{red, blue, yellow}, shape features of Ai,c were extracted by above algorithm, and denoted by  .
.
Decision function of shape classification was defined as
 (4)
(4)
Its decision rule was as follows:
If and
and  , then
  , otherwise shape feature
  didn��t belong to traffic sign shape, and filtered this region.
  was called classified threshold.
3 Representation of traffic sign based on dual-tree complex wavelet transform
For the reason that DT-CWT had the directional advantage, less computation requirement nearest shift and rotation invariance [19], it was suitable for traffic sign representation.
To obtain DT-CWT image feature, candidate image of the traffic sign was converted from RGB to Gray, and then normalized to 64��64 pixels before using DT-CWT.
Hd,s(x, y)=Gd, s(x, y)+jCd, s(x, y) represents complex coefficients of each directional subband at each scale, where Gd, s(x, y) and Cd, s(x, y) are real and imaginary part respectively, d��{0, ������, 5} is a set of six subbands oriented in ��15��, ��45��, and ��75�� directions, s��{0, ������, 3} refers to scale. Traffic sign image was represented by set SC={Hd,s(x, y) d��{0, ������, 5} s��{0, ������, 3}}, it encompassed different spatial scales and orientation selectivities.
Synthesis filters were used to dual-tree complex wavelet transform for obtaining 4 level scales representation of traffic sign image. Oi, i=1, ������, 4 represented synthesis filtering result of six complex wavelets Hd,s(x, y) (d��{0, ������, 5}). Feature matrix c=(O1, ������, O4)T, each Oi had been normalized to unit variance before the concatenation. To reduce the computational complexity, interlaced sampling method was used to process feature matrix c to reduce the dimension of sample feature. Four levels DT-CWT representation Oi are shown in Fig. 3.
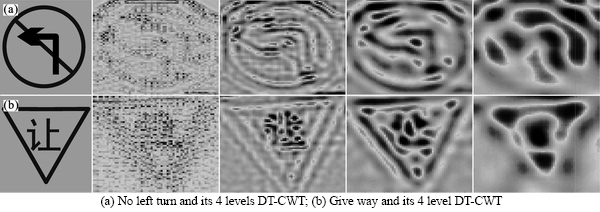
Fig. 3 Representation of traffic image by DT-CWT:
4 Traffic sign feature extraction based on 2d independent component analysis
Actually, the essence of independent component analysis(ICA) was to find linear representation of non-Gaussian data so that the components were statistically independent. 2DICA was an improving method of ICA and can eliminate redundancy and reduced dimension of the samples effectively. The algorithm of 2DICA and classifier were briefly introduced in this section.
4.1 2D Independent component analysis algorithm
Assume that the DT-CWT image features of traffic signs samples were c={ci, i��1, 2, ������,Q}, ci��Rn��n, each component may be combined by P(P��Q) unknown independent component by different coefficient [20]. To reduce dimension of samples, the main task was to obtain optimization projection matrix S=(s1, s2, ������, sm)T, according to the method introduced in Ref. [20], m was the number of independent components. Independent component si must have non-Gaussian distributions with zero mean, unit variance, and had
 (5)
(5)
where  are the largest eigenvalues diagonal matrix and their eigenvectors corresponding to covariance matrix
W is the named separable matrix. To obtain matrix W, let W=(w1, ������, wm)T, the steps of weight vector wi were updated by a learning rule as following:
1) Choose a random initial weight vector wi(L);
2) Let  ;
;
3) Let  ;
;
4) Let  ;
;
5) If  , go back to (2), else go to step (6);
6) Update over, wi= wi(N).
where wi(L), wi(N) are values of last and current updates respectively, g (u) and are selected by
g=tanh(a1u), g��(u)=1�C(tanh(a1u))2
whereis the first order derivative of function g(u), and a1=1.
4.2 Feature extraction
Optimal projection matrix S={s1, ������, sm} obtained by the above analysis, was adopted to feature extraction. Giving an image sample  , let
, let
 (6)
(6)
Then, feature vectors Yi1, ������, Yim were called the independent principal component (vectors) of the sample image feature ci. Feature matrix of the image sample ci can be reduced to n��m matrix B=(Yi1, Yi2, ������, Yim).
4.3 Classification method
After feature extracting by 2DICA, a nearest neighbor classifier was adopted for classification. Supposed that traffic sign category ci(i=1, 2, ������, p) had
Ni training samples  (j=1, 2, ������, Ni)
  was the total number of training samples, and these samples were assigned cp categories, p was the number of traffic signs categories used to classify.
Supposed that test feature B would be recognized, distance  which was computed by distance
decision function in Eq. (4) was taken to measure similarity between B and samples  . The following decision rule was taken to judge what categories of traffic sign B was or B was not be a traffic sign.
If  and Dm(B)��T, then B��cm, else B was not a traffic sign. T was called similarity threshold.
5 Experiments and analysis
5.1 Experiment data
To test traffic sign recognition system, experiments were performed on the real video sequences which were collected from a moving vehicle in cluttered Chinese urban scenes. There were 50 collected video sequences which were made of 300 frames. The quality of the sequence images varied from very good (short distance from the camera, good illumination, bright colors, and good contrast) to very poor (adverse illumination, far distance from the camera). the resolution of test sequence image was 1 040��1 392 pixels and included total of 50 categories of traffic sign which were divided into six classes: red circle, red triangle, blue circle, blue square, yellow triangle, yellow rectangle in urban scenes.
5.2 Overall performance
In test, threshold of shape classifier Tshape, independent component number m and threshold of traffic signs classifier T took 1.3, 10, and 1, respectively. Figure 4 shows results of two video sequences using proposed algorithm. Left corner in each image illustrated recognized traffic signs type, and regions enclosed by blue outsider boundaries were the detected traffic sign regions. From 46th frame image in first rows, a blue circle traffic sign was not detected since it is far from the camera. But it was successfully recognized in 71th frame. Table 2 illustrates the detection and recognition rate obtained for all available test sequences and shows that overall rate of proposed algorithm was up to 95.39% at the peak. The deformation, rotation, occlusion and image motion blur of traffic sign resulted in unsuccessful detection and recognition.
All recognition rates were determined from only these signs that were correctly detected. In the last row the overall detection and recognition rates were given by multiplying the percentages of the detected and correctly recognized signs.
5.3 Comparison of recognition performance
To evaluate the presented recognition algorithm, a dataset of 60 000 traffic sign images (10 000 for training and 50 000 for testing) extracted from several traffic video sequences was established. To obtain same feature number, all input images were converted from RGB to Gray, and then normalized to 64��64 pixels. For comparative analysis of feature representation and feature selection algorithm, several separate experiments were performed here. Recognition results of experiments are displayed in Table 3 and Table 4.
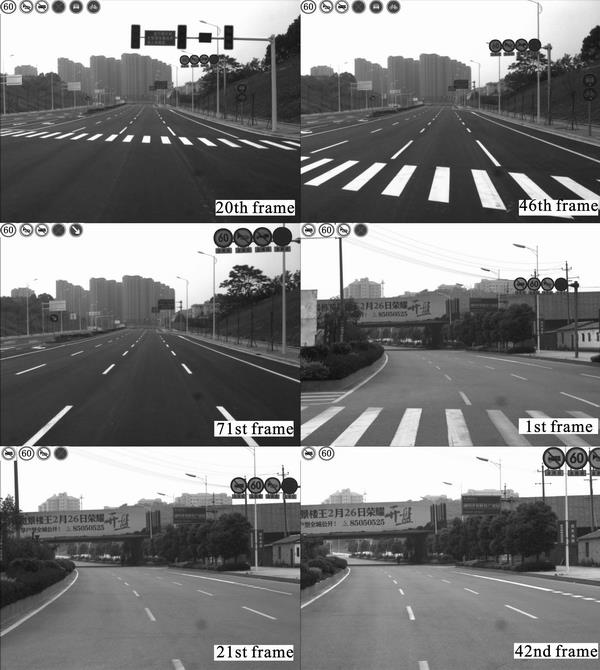
Fig. 4 detection and recognition results in two video sequences
Table 2 detection and recognition rate of traffic signs (%)

Table 3 Performance comparisons of different traffic sign representations with 2DICA (%)

Table 4 Performance comparisons of different methods of selecting feature with DT-CWT (%)

The results gave several conclusions: Firstly, DT-CWT performance was better than Gabor and template; its recognition rate reached 96.96% on the top. Secondly, PCA and LPP did not seem to be an adequate feature extracting algorithm for traffic signs recognition because their recognition rates were too lower than 2DPCA and 2DICA; maybe they merely captured the global variance of the data. Thirdly, DT-CWT+2DICA algorithm took on stable performance in traffic signs recognition because of their well performance on image representation and reducing data redundancy.
6 Conclusions
1) Image segmentation based on transforming value of RGB color space and shape classifier based on signature feature can be effective in detecting multiple traffic signs in complex urban scenes.
2) Dual-tree complex wavelet transform is used to represent traffic sign on gray image whose size is normalized to 64��64 pixels. A forward feature selection technique, 2D independent component analysis can be effective in reducing feature dimension of test image. Nearest neighbor classifier is employed to classify traffic sign image and reject noise image.
3) Experimental results show that overall rate of proposed algorithm is up to 95.39% at the peak and multiple recognition results can output in the same time. Comparing with different state-of-the-art image representation and feature selection methods, experimental results indicate that the proposed recognition method is robust, effective, and accurate to classify traffic signs.
References
[1] OVERETT G, PETERSSON L, ANDERSSON L, PETTERSSON N. Boosting a heterogeneous pool of fast hog features for pedestrian and sign detection [C]// 2009 IEEE Intelligent Vehicles Symposium, Xi��an, 2009: 584�C590.
[2] BELAROUSSI R, TAREL J. Angle vertex and bisector geometric model for triangular road sign detection [C]// 2009 Workshop on Applications of Computer Vision, Snowbird, UT, 2009: 1�C7.
[3] UETA T, SUMI Y, YABUKI N, MATSUMAE S. A study on contour line and internal area extraction method by using the self-organization map [C]// International Symposium on Intelligent Signal Processing and Communications, Tottori, Japan, 2006: 685�C688.
[4] BAHLMANN C, ZHU Y, RAMESH V, PELLKOFER M, KOEHLER T. A system for traffic sign detection, tracking, and recognition using color, shape, and motion information[C]// IEEE 2005 Proceeding on Intelligent Vehicles Symposium, Las Vegas, 2005, 255�C260.
[5] RUTA A, LI Yong-Ming, LIU Xiao-Hui. Towards real-time traffic sign recognition by class-specific discriminative features [C]// Proceeding of the 18th British Machine Vision Conference, Warwick, 2007: 399�C408.
[6] KANTAWONG S. Road Traffic Signs Detection and Classification for Blind Man Navigation System [C]// Proceeding of international Conference on Control, Automation and Systems (ICCAS), Seoul, 2007: 847�C852.
[7] NGUWI Y, KOUZANI A. Automatic road sign recognition using neural networks [C]// International Joint Conference on Neural Networks, Vancouver, 2006: 3955�C3962.
[8] REN F X, HUANG J, JIANG R, KLETTE R. General traffic sign recognition by feature matching [C]// Proceedings of 24th International Conference of Image and Vision Computing. New Zealand: IEEE, 2009: 409�C414.
[9] SHADEED W, ABU-AL-NADI D, MISMAR M. Road traffic sign detection in color images [C]// Proceedings of the 2003 10th IEEE International Conference on Electronics, Circuits and Systems, Sharjah, 2003: 890�C893.
[10] GAO X W, PODLADCHIKOVA L, SHAPOSHNIKOV D, HONG K, SHEVTSOVA N. Recognition of traffic signs based on their colour and shape features extracted using human vision models [J]. Journal of Visual Communication and Image Representation, 2006, 17(4): 675�C685.
[11] ALAN K, HOLGER J, SAMAN H. Gabor wavelet similarity maps for optimising hierarchical road sign classifiers [J]. Pattern Recognition Letters, 2007, 28(2): 260�C267.
[12] HOSSAIN M S, HASAN M M, ALI M A, KABIR M H, ALI A B M S. Automatic detection and recognition of traffic signs [C]// Proceedings of 2010 IEEE Conference on Robotics Automation and Mechatronics (RAM), Singapore, 2010: 286�C291
[13] RUTA A, LI Yong-ming, LIU Xiao-hui. Real-time traffic sign recognition from video by class-specific discriminative features [J]. Pattern Recognition, 2010, 43(1): 416�C430
[14] CYGANEK B. Road Signs Recognition by the Scale-Space Template Matching in the Log-Polar Domain [J]. Pattern Recognition and Image Analysis, 2007, 4447: 330�C337.
[15] MALDONADO-BASCON S, LAFUENTE-ARROYO S, GIL-JIMENEZ P, GOMEZ-MORENO H, LOPEZ-FERRERAS F.Road-sign detection and recognition based on support vector machines [J]. IEEE Transactions on Intelligent Transportation System, 2007, 8(2): 264�C278.
[16] MEUTER M, MULLER-SCHNEIDERS S, NUNNY C, HOLDY S, GOERMERY S, KUMMERTY A. Decision fusion and reasoning for traffic sign recognition [C]// Proceedings of 13th International IEEE Conference on Intelligent Transportation Systems (ITSC), Funchal, 2010: 324�C329.
[17] LIM K H, SENG K P, ANG L M. Intra color-shape classification for traffic sign recognition [C]// Proceedings of 2010 International Conference of Computer Symposium, Tainan, 2010, 642�C647.
[18] DENG Xiao, WANG Dong-hui, CHENG Li-li, KONG Shu. Traffic Sign Recognition Using Dictionary Learning Method [C]// Proceedings of 2010 Second WRI Global Congress on Intelligent Systems (GCIS), Wuhan, 2010, 372�C375.
[19] SELESNICK I W, BARANIUK R G, KINGSBURY N C. The dual-tree complex wavelet transform [J]. Signal Processing Magazine, IEEE. 2005, 22(6): 123�C151.
[20] HYVARINEN A, OJA E. Independent component analysis: algorithms and applications [J]. Neural networks. 2000, 13(4/5): 411�C430.
[21] REN Xiao-ping, CAI Zi-xing, CHEN Bai-fan, YU Ling-li. Anomaly detection method based on kinematics model and nonholonomic constraint of vehicle [J]. Journal of Central South University of Technology, 2011, 18(4): 1128�C1132.
(Edited by HE Yun-bin)
Foundation item: Projects(90820302, 60805027) supported by the National Natural Science Foundation of China; Project(200805330005) supported by Research Fund for Doctoral Program of Higher Education, China; Project(2009FJ4030) supported by Academician Foundation of Hunan Province, China;
Received date: 2011�C12�C19; Accepted date: 2012�C02�C27
Corresponding author: Gu Ming-qin, PhD candidate; Tel: +86�C15116455834; E-mail: gu_mingqin@hotmail.com

