
Conductivity of cerium oxides doped by trivalent cations
ZHANG Hong(张鸿), WANG Jian (汪健), WANG Shen-cun(王申存), LI Zhi-cheng(李志成)
School of Materials Science and Engineering, Central South University, Changsha 410083, China
Abstract: For the doping technique with single dopant of Sb2O3, Ga2O3, In2O3, AlCl3, Bi2O3 or Sm2O3, the dopant concentrations of 10%(molar fraction) were selected for the CeO2-based oxygen-ion conductors. A wet chemical method by polymerization of polyvinyl-alcohol was performed for the compound preparation. X-ray diffraction analysis result shows that the calcined powders have nanocrystalline structure with grain size less than 40 nm, and the sintered samples have pure single fluorite-type phase in all doped cerium oxides. Impedance measurement results show that the conductivities and activation energies of CeO2-based oxides depend closely on the dopants. The Sb2O3-doped CeO2 has the largest conductivity and In2O3-doped CeO2 has the lowest one at 200 ℃, the Bi2O3-doped oxide shows the highest activation energy and Al2O3-doped oxide shows the lowest one. Ionic radii and association enthalpies of dopants were taken account for different conductivities and activation energies of the CeO2-based oxygen-ion conductors.
Key words: cerium oxides; doping technique; synthesis process; ionic conductivity; enthalpy
1 Introduction
Oxide ionic conductors are used in various applications, such as oxygen sensors, oxygen pumps, and solid oxide fuel cells (SOFCs)[1-3]. Yttria-stabilized zirconia (YSZ) is one of the applied conductor materials, but it shows disadvantage for its high operating temperatures about 900 ℃. In order to reduce the operating temperature, some novel oxygen-ion conductors including CeO2-, Bi2O3- and LaGaO3-based oxides have been extensively investigated because they demonstrate much higher ionic conductivity at relatively lower temperatures compared with YSZ[4-6]. While, CeO2 oxides with dopants have been extensively studied as one of the most promising candidates for the application of oxide ionic conductors such as in the application of solid electrolyte for intermediate temperature SOFCs. And divalent and trivalent metallic oxides such as rare-earth oxides were always selected as dopants for CeO2 oxides. Among various doped ceria oxides, Sm2O3-doped ceria oxides were reported to have the highest conductivity[7-9].
However, as our knowledge, there have been few reports on ceria conductors doped by trivalent metallic cations such as Sb3+, Ga3+, In3+, Al3+ or Bi3+, so far. The study on the influence of radii and enthalpies of Sb3+, Ga3+, In3+, Al3+ and Bi3+ on the conductivities of ceria conductors should be one of the interesting topics. Recently, our researches revealed that conductivities of some of the ceria-based oxides doped with these trivalent oxides were higher than that of 20%(molar fraction) Sm2O3-doped CeO2, which has been considered as the best doping technique in literatures, when a suitable doping technique was performed[10-12]. The effect of ionic radii and related enthalpies of the dopants on the conductivities were considered in this paper.
2 Experimental
Ce0.9D0.1O1.95 (D= Sb, Ga, In, Al and Bi) oxides were prepared by a wet chemical method polymerized with polyvinyl-alcohol (PVA). CeO2, Sb2O3, Ga2O3, In2O3, AlCl3, Bi2O3 and Sm2O3, with the purities higher than 99.9 %, were used as the starting materials. Polyvinyl alcohol (PVA, 98%-99%, Alfa Aesar, a Johnson Matthey Company, Germany) was applied as the polymerization material. As the reference samples, 10%-Sm2O3 doped CeO2 were also prepared with the same synthesis process. Starting materials were weighed according to calculated amount for each experimental batch. Firstly, CeO2 was dissolved into HNO3-H2O2 matured aqueous solution, the dopant was dissolved into HNO3 aqueous solution and PVA was dissolved into distilled water, respectively. Secondly the dissolved slat solutions were mixed with PVA solution, respectively, resulting in the precursor solution. Mixed solution was heated at about 150 ℃ with stirring until the water evaporated. As a result, a crisp gel was obtained. The crisp gel was ground into powder. The calcination was performed in air in a furnace at 800 ℃ for 1 h.
Calcined powders were granulated with PVA solution, and pressed into pellets with diameter of 15 mm and thickness of about 3 mm. The pressure was about 200 MPa. Then green pellets were sintered at different temperatures, i.e. 900 ℃, 1 h for Bi2O3-doped ceria, 1 450 ℃, 5 h for Sb2O3-, Ga2O3-, In2O3-, AlCl3- and Sm2O3-doped cerium oxides.
Phases in the calcined powders and sintered bulk samples were analyzed by X-ray powder diffraction (XRD) (HUBER Imaging Plate Guinier Camera G670, with Cu Kα radiation) at room temperature. The sintered pellets were ground to a thickness of about 1 mm and then were painted with gold past on both parallel sides of the samples as the electrode. AC conductivities were characterized by an EI300 electrochemical impedance spectroscopy (Gamry Istruments, Inc.). The range of AC frequency is 0.01 Hz to 300 kHz.
3 Results and discussion
3.1 Phase examination
Fig.1 shows XRD patterns of the as-calcined powders and the as-sintered bulks of cerium oxides doped with various dopants. Fig.1(a) shows XRD patterns of the as-calcined powders. It can be seen that pure fluorite-type phases of Ga2O3-, AlCl3-, Bi2O3- and Sm2O3-doped cerium oxides were obtained after CeO2-based oxides had been calcined at 800 ℃ for 1 h. In the XRD spectra of Sb2O3-doped ceria, some additional Bragg peaks marked by full dots can be found. The analysis reveals that these impurity peaks come from the Sb2O3 and/or Sb2O5. The impurity Bragg peaks marked by full squares in the spectrum of In2O3-doped cerium oxide can also be found and related to the In2O3 oxide phase. After sintering, the XRD analysis shows that all samples have pure single fluorite-type phase, even in the Sb2O3- and In2O3-doped cerium oxides marked by 10 Sb and 10 In, respectively(see Fig.1(b)).
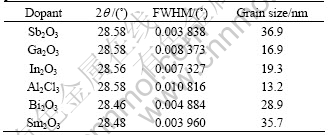
Fig.1(a) shows the broadened XRD Bragg peaks, indicating that fine-grain powders were prepared after the calcination. Average grain size calculated by Debye-Scherrer method for each batch of powder is listed in Table 1. Bragg diffraction angles (2θ) at the (111) diffraction peaks and the related full width at half maximum (FWHM) for the as-calcined powders are also listed in Table 1. One can see that all calcined powders have the average grain size less than 40 nm. This indicates that nanocrystalline powder can be easily prepared by the wet chemical process with the polymerization of polyvinyl-alcohol.
The relative densities of all sintered samples were determined by dividing the bulk density of the samples by the theoretical density. The theoretical density was calculated by using the lattice parameter a=0.541 2 nm of pure cerium oxide. The relative densities of the sintered pellets were calculated to be between 95.8% and 96.5%.

Fig.1 XRD patterns of doped cerium oxides: (a) As-calcined CeO2-based oxides; (b) As-sintered cerium oxides doped by Sb2O3 and In2O3
According to XRD analysis and relative densities described above, the chemical synthesis process with the polymerization of PVA should be an efficient synthesis method for the preparation of oxide solutions. It is generally accepted that synthesis of ceramics by wet-chemical method is preferred to those employing reaction in the solid state, because it gives rise to more homogeneous powders with controlled composition. The so called ‘steric entrapment synthesis method’, a polymerized organic-inorganic route, that uses simple and long-chain polymers such as PVA as the carrier phase, is a viable, simple, inexpensive technique for producing mixed-oxide powders, in comparison with other wet-chemical methods such as the Pechini method[11] and sol-gel method[12]. These simple polymer chains have no special chelating end groups, in contrast to the α-pyroxycarboxylic acid of the Pechini precursor. In PVA aqueous solutions, metal ions can be stabilized by the polymer via interaction with the hydroxyl groups.
Table 1 Average grain sizes of as-calcined ceria-based oxide powders
During processing precursor, the water in solution evaporates, the free space between the polymer molecules shrinks and the chain entanglement causes a close polymer. The cation mobility is greatly reduced and the water remained in the precursor with all the cations in the entanglement polymer network. As a result, there is no precipitation to cause off-stoichiometry, and homogeneous powders can be obtained. On the other hand, the PVA could also act as a surfactant during the preparation process.
In a dilute PVA solution, PVA disperses in the mixture aqueous solution and stabilizes the metal ions via the hydroxyl groups. When the PVA concentration increases large enough, PVA molecules might polymerize and micell forms. Cations or oxide molecules are enclosed inside the micellae. So a shell-core structure can be obtained. Where, the shell is composed of PVA and the core consists of the cations or oxide compound at atomic level or several nanometers scale. So the cations or oxide compound are kept away from each other by PVA. As the result, the grains of the calcined powder can not grow easily if the calcination temperature is not high enough. The suitable calcination temperature should be selected in the region that is little higher than the decomposing/vapor temperature point of the PVA (500-800 ℃ for different inorganic materials).
3.2 Conductivity measurement
The conductivity of the samples was measured by an AC complex impedance method, and the applied frequency range of AC is from 0.01 Hz to 300 kHz. Generally, an impedance spectrum for an ionic conductor consists of three parts, a bulk (grain) semicircle, a grain-boundary semicircle and an electrode-process arc. Fig.2 shows the Nyquist-plotted impedance spectra of the CeO2 based oxides doped by Sb2O3, Ga2O3, In2O3, AlCl3, Bi2O3 and Sm2O3, respectively, measured at 300 ℃. The concentration of each sample was 10%. They are respectively marked by 10Sb, 10Ga, 10In, 10Al, 10Bi and 10Sm. No grain-boundary semicircles could be detected in all the impedance spectra. These should result in forming the pure phase in each sample as verified by the XRD analysis showed in Fig.1.

Fig.2 Impedance spectra in Nyquist-plots of doped ceria recorded at 300 ℃
Fig.3 show the temperature dependence of the conductivities in Arrhenius-plots of CeO2 oxides doped with the concentration of 10%, respectively. One can see that cerium oxides doped by various dopants show different conductivities at each applied temperature. For example, the conductivities at 200 ℃ are increased by the sequence with dopants of In2O3, Ga2O3, Bi2O3, AlCl3, Sm2O3, and Sb2O3. On the other hand, the doped cerium oxides have different activation energies for various dopants (see Table 2). The Bi2O3-doped CeO2 has the maximum activation energy and the AlCl3-doped CeO2 shows the minimum activation energy.
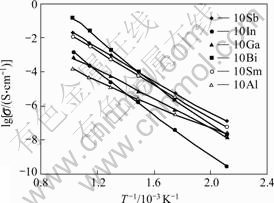
Fig.3 Arrhenius-plots conductivities of CeO2 oxides doped by trivalent cations with concentration of 10%
At the same time, it is interesting to find that Sb-doped CeO2 has higher conductivities for Sm-doped one at all applied temperatures, and Bi-doped ceria shows higher conductivities for Sm-doped ceria at the temperatures higher than 400 ℃.
3.3 Conductivity discussion
The conductivities of rare-earth-doped CeO2 oxides intensely depend on the ionic radii of dopants. For example, the doping of Sm3+ ion, whose ionic radius is the most similar one to the radius of Ce4+, gave the maximum conductivity[7-9]. In this case, it is regarded that the maximum conductivity is due to the similar ionic radius as the host ion resulting in the minimum association enthalpy between dopant ion and oxygen vacancy. However, as shown in Figs.2 and 3, the present experimental results do not follow this consideration when the trivalent cations instead of rare earth ones were applied as the dopants. For example, the ionic-radius difference between In3+ and Ce4+ is the smallest one among the dopants in present experiment, but In-doped CeO2 oxides show the lowest conductivity at 200 ℃. This means that the other influence factor, such as enthalpy, besides the ionic radius, should play an important role in the conductivity of CeO2-based oxides when the dopants are not rare-earth oxides, as applied in present experiments.
Generally, the material conductivity can be expressed as the sum of the products of the concentration ni, the mobility μi of charge carriers with charge qi:
 (1)
(1)
In the case of oxygen ions, the conductivity occurs via anions vacancies is expressed as follows.
 (2)
(2)
where σv is the ion conductivity; qv is the charge, μv is the mobility, and Cv is the concentration of oxygen vacancies. The mobility is related to the diffusivity D according to the Nernst-Einstein equation:
 (3)
(3)
where B represents the absolute mobility and k is Boltzman constant. The diffusivity D is usually expressed as an exponential function that relates a charge jumping distance between vacancies, an appropriate lattice vibration frequency υ0 and an activation enthalpy and entropy of diffusion ?HA, ?SA.
 (4)
(4)
where d is the jump distance of the vacancy. Additional considerations and simplifications allow the development of the following expression for the ionic conductivity of solid electrolytes.
 (5)
(5)
where A1 includes the entropy term as well as the vacancy concentration term. From this expression it can be concluded that small activation enthalpy leads to higher ionic conductivity. At low temperature of almost complete association, the population of charge carrying defects is determined by the thermodynamic equilibrium between the defects and the associated pairs. both σ and HA should be independent of dopant concentration[7, 13]. The effective activation enthalpy, HA, is composed of association enthalpy Ha and migration enthalpy Hm.
 (6)
(6)
So the conductivity is dependent on the association enthalpy Ha. Generally, the migration of an oxygen ion depends on the bonding/debonding energy between the oxygen ion and cation, enthalpy of cations, lattice enthalpy and the other related enthalpies. For the same host oxide, CeO2, in present discussion, the difference in lattice enthalpy for various dopant will not be discussed. The different oxygen-ionic mobility is suggested to be related to the bonding enthalpy (Hb) between dopant and oxygen as well as the dopant cation ionization enthalpy (HI). Here, association enthalpy (Ha) can be defined as Ha=Hb+HI. So the change ratio of association enthalpy, δHa, after doping can be given as

(7)
where Ha(Ce) is the association enthalpy of host cation Ce4+, cD is the dopant concentration and  is the association enthalpy of dopant. Table 2 gives the calculated change ratio of the association enthalpy for various dopants. It can be seen that the δHa sequence is in agreement with the conductivity sequence at low temperature (i.e. 200 ℃) as shown in Fig.3 for various cation-doped oxides.
At high temperature range, the conductivity is determined by the intrinsic defects in the crystal and the concentration of charge carrying defect which is determined by an dopant and impurity. Therefore, the description of the ion conductivity with respect to temperature requires detailed considerations on the defect association and the dopant ionic radii.
So, the expression of the temperature dependence of conductivity, one of the terms is activation energy, can be derived based on each association defect case. The change of activation enthalpy as shown in Eqn.(8)[13].
 (8)
(8)
Here the first term, the association enthalpy of the defect pair includes the electrostatic interaction of a dopant cation and an oxygen vacancy in the pair position as well as any other short range interaction terms. The second term is the change in the electrostatic energy of the lattice. This term is twice of the Madelung energy per charge, where αM =1.748 is the Madelung constant. The factor of 2 appears because dissociation has converted a positive charge into a negative charge. The final term is the interaction of the doubly charged oxygen vacancy with its two closest negative charges. The calculated enthalpy changes are shown in Table 2. It is interesting to note that the tendency of the enthalpy changes for various dopants is in agreement with one of the activation energies of the related doped CeO2-based oxides. The analysis described above indicates that the association enthalpy and ionic radius act important role in the conductivity and activation energy of the trivalent-cation doped CeO2-based oxides.
Table 2 Conductivities and thermal properties of various doped ceria

4 Conclusions
1) The wet chemical method polymerized with polyvinyl alcohol (PVA) is an efficient synthesis process. The calcined powders of CeO2-based oxides doped by Sb2O3, Ga2O3, In2O3, AlCl3, Bi2O3 and Sm2O3, respectively, show nanocrystalline structure with grain size less than 40 nm, and the sintered samples have pure single fluorite-type phase.
2) The conductivities measured at 200 ℃ are increased by the sequence with dopants of In2O3, Ga2O3, Bi2O3, AlCl3, Sm2O3, and Sb2O3, and are dependent on the related association enthalpies.
3) Sb-doped CeO2 has higher conductivities than that of the Sm-doped one, which is regarded as the best doping technique reported in literatures, at all applied temperatures. Bi-doped ceria shows higher conductivities than that of Sm-doped ceria at the temperatures higher than 400 ℃.
4) The association enthalpy and ionic radius play an important role on the conductivity and activation energy of the trivalent-cation doped CeO2-based oxides.
References
[1] MIURA N, KUROSAWA H, HASEI M, LU G, YAMAZOE W. Stabilized zirconia-based sensor using oxide electrode for detection of NOx in high-temperature combustion-exhausts[J]. Soilid State Ionics, 1996, 86/88: 1069-1073.
[2] STOUKIDES M, VAYENES C G. The effect of electrochemical oxygen pumping on the rate and selectivity of ethylene oxidation on polycrystalline silver[J]. J Catal, 1981, 70: 137-146.
[3] HUANG W, SHUK P, GREENBALTT M, CROFT M, LIUC M. Structural and electrical characterization of a novel mixed conductor: CeO2-Sm2O3-ZrO2 solid solution[J]. J Electrochem Soc, 2000, 147: 4196-4202.
[4] KUDO T, OBAYASHI H. Mixed electrical conduction in fluorite-type Ce1-xGdxO2-x/2[J]. J Electrochem Soc, 1976, 123: 415-419.
[5] BATLE P D, CATLOW C R A, HEAP J W, MORONEY L M. Structural and dynamic studies of delta-Bi2O3 oxide ion conductors: I. the structure of (Bi2O3)1-x(Y2O3)x as a function of x and temperature[J]. J Solid State Chem, 1986, 63: 8-15.
[6] ISHIHARA T, SSHIBAYAMA T, ISHIKAWA S, HOSOI K, NISHIGUCHI H, TAKITA Y. Novel fast oxide ion conductor and application for the electrolyte of solid oxide fuel cell[J]. J Europ Ceram Soc, 2004, 24: 1329-1335.
[7] INABA H, TAGAWA H. Ceria-base solid electrolytes[J]. Solid State Ionics, 1996, 83: 1-16.
[8] ZHA S W, XIA C R, MENG G G. Effect of Gd (Sm) doping on properties of ceria electrolyte for solid oxide fuel cells[J]. J Power Sources, 2003, 115: 44-48.
[9] WANG F Y, CHEN S, CCHENG S. Gd3+ and Sm3+ co-doped ceria electrolytes for intermediate temperature solid oxide fuel cells[J]. Electrochem Commun, 2004, 6: 743-746.
[10] LI Zhi-cheng, ZHANG Hong, BERGMAN B. Synthesis and characterization of nanostructured Bi2O3-doped cerium oxides fabricated by PVA polymerization process[J]. Ceram Int, 2007, doi:10.1016/j.ceramint.2007.07.018.
[11] POLINI R, PAMIO A, TRAVERSA E. Effect of synthesis route on sintering behavior, phase purity and conductivity of Sr- and Mg-doped LaGaO3 perovskites[J]. J Europ eram Soc, 2004, 24: 1365-1370..
[12] WANG Wen, JIA De-chang, ZHOU Yu. Preparation and properties of SrBi2.2Ta2O9 thin film[J]. J Cent South Univ Technol, 2005, 12: 376-379.
[13] WANG D Y, PARK D S, GRIFFITH J, NOWICK A S. Oxygen-ion conductivity and defect interactions in yttria-doped ceria[J]. Solid State Ionics, 1981, 2: 95-105.
Foundation item: Project(311501125) supported by the Science Research Foundation for Returned Overseas Scholars from the Ministry of Education of China; Projects(76112019; 76112020) supported by the Scientific Research Foundation by Central South University
Corresponding author: LI Zhi-cheng; Tel:+86-731-8877740;Fax: +86-731-8876692; E-mail: zhchli@mail.csu.edu.cn
(Edited by YANG Hua)

