Excavation influence of triangular-distribution tunnels for wind pavilion group of a metro station
来源期刊:中南大学学报(英文版)2020年第12期
论文作者:林宇亮 陈涛 周坤 卫军 刘晓春 张箭 申权
文章页码:3852 - 3874
Key words:station tunnel; wind pavilion group; finite element analysis; tunnel and surrounding rock deformation; stress analysis
Abstract: For the Guanshui Road Station tunnel project of Guiyang Metro Line 2, the wind pavilion group was moved out of the main tunnel to reduce the number of openings in the main tunnel, and the wind pavilion group was excavated in a triangular configuration at the entrance of the main tunnel. Based on the finite element software ABAQUS, a three-dimensional model is established to study the influence of different triangular-distribution tunnels excavation schemes on the surface settlement and tunnel stability. The objective of this study is to reveal the change rules of surface settlement, deformation and force in the support structures and the surrounding rock and identify the best excavation scheme for this tunnel configuration. Results show that to control the surface settlement and the deformation of the support structures, the optimal excavation sequence involves excavating the upper fresh air exhaust tunnel before the lower running tunnel. To control the stress of the support structures, the optimal excavation involves excavating the lower running tunnel before the upper fresh air exhaust tunnel. In this project, the most reasonable excavation sequence of the tunnel is from top to bottom. The most reasonable thickness of tunnel penetration is 5 m.
Cite this article as: CHEN Tao, ZHOU Kun, WEI Jun, LIU Xiao-chun, LIN Yu-liang, ZHANG Jian, SHEN Quan. Excavation influence of triangular-distribution tunnels for wind pavilion group of a metro station [J]. Journal of Central South University, 2020, 27(12): 3852-3874. DOI: https://doi.org/10.1007/s11771-020-4468-x.

J. Cent. South Univ. (2020) 27: 3852-3874
DOI: https://doi.org/10.1007/s11771-020-4468-x

CHEN Tao(陈涛)1, 2, ZHOU Kun(周坤)3, WEI Jun(卫军)1, LIU Xiao-chun(刘晓春)1,
LIN Yu-liang(林宇亮)1, ZHANG Jian(张箭)3, SHEN Quan(申权)4
1. School of Civil Engineering, Central South University, Changsha 410075, China;
2. China Railway City Development and Investment Group Co., Ltd., Chengdu 610000, China;
3. Key Laboratory for Geomechanics and Embankment Engineering of Ministry of Education,Hohai University, Nanjing 210024, China;
4. School of Civil Engineering, Hunan University of Technology, Zhuzhou 412007, China
 Central South University Press and Springer-Verlag GmbH Germany, part of Springer Nature 2020
Abstract: For the Guanshui Road Station tunnel project of Guiyang Metro Line 2, the wind pavilion group was moved out of the main tunnel to reduce the number of openings in the main tunnel, and the wind pavilion group was excavated in a triangular configuration at the entrance of the main tunnel. Based on the finite element software ABAQUS, a three-dimensional model is established to study the influence of different triangular-distribution tunnels excavation schemes on the surface settlement and tunnel stability. The objective of this study is to reveal the change rules of surface settlement, deformation and force in the support structures and the surrounding rock and identify the best excavation scheme for this tunnel configuration. Results show that to control the surface settlement and the deformation of the support structures, the optimal excavation sequence involves excavating the upper fresh air exhaust tunnel before the lower running tunnel. To control the stress of the support structures, the optimal excavation involves excavating the lower running tunnel before the upper fresh air exhaust tunnel. In this project, the most reasonable excavation sequence of the tunnel is from top to bottom. The most reasonable thickness of tunnel penetration is 5 m.
Key words: station tunnel; wind pavilion group; finite element analysis; tunnel and surrounding rock deformation; stress analysis
Cite this article as: CHEN Tao, ZHOU Kun, WEI Jun, LIU Xiao-chun, LIN Yu-liang, ZHANG Jian, SHEN Quan. Excavation influence of triangular-distribution tunnels for wind pavilion group of a metro station [J]. Journal of Central South University, 2020, 27(12): 3852-3874. DOI: https://doi.org/10.1007/s11771-020-4468-x.
1 Introduction
The wind pavilion group of a subway station includes the exhaust pavilion for discharging dirty air, the fresh air pavilion for delivering fresh air and the piston air pavilion for removing and replacing the piston air caused by a train [1]. Thus, the wind pavilion group is an important subsidiary structure for ventilation in underground stations [2]. In the conventional design scheme, each wind pavilion is established by excavating holes in the side of the main tunnel of the station. However, these openings damage the main structure of the tunnel and affect its stability. Therefore, it is necessary to optimize the layout of the wind pavilion group to facilitate the excavation of the main tunnel [3]. To reduce the adverse effects caused by openings at the side of the tunnel, the project studied in this paper involves building the wind pavilion group together at the end of the main tunnel of the station. Since the wind pavilion group is moved to the end of the main tunnel of the station, the newly generated fresh air exhaust tunnel and two running tunnels form adjacent triangular distribution three-hole tunnels, and it is necessary to study the mutual influence among tunnels during the excavation of adjacent tunnels.
At present, scholars in China and other countries have carried out considerable researches on the impacts of the construction of multiple tunnels through theoretical analysis, numerical simulation, model tests and other methods. In terms of theoretical analysis, KOOI and VERRUIJT [4] transformed two adjacent parallel tunnels into two adjacent circular cavities in an infinite elastic medium, and provided the analytical solution of surface displacement. TRAN-MANH et al [5] studied the influence of the distance between two circular tunnels in a transversely isotropic rock mass based on complex variable theory and proposed an analytical solution for the stress and displacement around the tunnels. WANG et al [6, 7] obtained analytical solutions for the ground displacement and stress after the excavation of a new tunnel in a semi-infinite viscoelastic ground by strictly considering the ground rheology, the order of tunnel excavation, the interaction between two parallel tunnels and the additional load. In terms of numerical simulation, YAMAGUCHI et al [8] studied the mutual influence of the construction of four parallel tunnels with rectangular layouts. The results showed that the surface subsidence caused by excavating two horizontal parallel tunnels simultaneously is greater than that caused by excavating two vertical parallel tunnels simultaneously. LI et al [9] carried out a three-dimensional numerical study on the relative position and separation distance among a new tunnel and existing parallel tunnels by using the finite difference software FLAC3D and concluded that the critical separation distance is approximately 3.5 times the tunnel diameter. LIU et al [10] simulated different construction schemes of parallel tunnels by considering various influencing factors, such as the excavation sequence and ground reinforcement depth, and concluded that the optimal reinforcement depth for controlling tunnel uplift and surface subsidence is approximately 1.5 times the tunnel diameter. JIANG et al [11], using the finite element analysis software ABAQUS, studied and analyzed the horizontal displacement of strata caused by excavations of parallel twin tunnels and obtained the pattern of variation in the horizontal displacement of the strata in both longitudinal and transverse sections. In terms of physical model tests, WANG et al [12] studied the influence of the excavation of three tunnels in weak surrounding rock on the surface settlement with model tests and numerical analysis software FLAC. It was found that middle tunnel construction is the key procedure that controls the surface settlement, and the influence of the construction footage on the deformation and stress in the surrounding rock is less than that in the tunnel reinforcement ring. CHAPMAN et al [13] simulated the construction of two parallel tunnels in soft soil through model tests and assessed the displacement behavior of surface soil, including the formation of an asymmetric settlement trough. SUN et al [14] conducted model tests to study the interaction between the tunnel lining and the surrounding rock during earthquakes, and the development of cracks in the surrounding rock and lining was studied.
In summary, previous studies have mostly focused on two parallel tunnels or multiple parallel tunnels, but there are relatively few studies on the construction of three adjacent triangular tunnels in a triangular configuration. Based on the Guanshui Road Station tunnel project of Guiyang Metro Line 2, this paper uses the finite element software ABAQUS [15-17] to establish a three-dimensional model to simulate the construction conditions associated with the construction of triangular- distribution three-hole tunnels in the optimization scheme of the tunnel wind pavilion group. The effects of the excavation sequence and excavation length of the triangular-distribution tunnels on the surrounding rock lining deformation, mechanical effects, and ground settlement of the tunnel are studied. Finally, the optimal tunnel construction scheme is proposed and some references are provided for similar projects in the future.
2 Project overview
2.1 Project background
Guanshui Road Station of Guiyang Metro Line 2 is an underground two-story station with a main length of 180 m and was constructed via island-type excavation. The maximum excavation dimensions of the station tunnel are 22.16 m wide and 19.21 m high; the burial depth of the rail surface is 32.5-35.7 m, and the overburden above the vault is approximately 17.5-20.5 m thick, with an overlaying rock thickness of 3.7-14 m. This tunnel is an extra-large cross-section tunnel, and the classification of the surrounding rock of the tunnel is V, which means that the surrounding rock has a weak strength. The layout of Guanshui Road Station is shown in Figure 1.

Figure 1 Layout of Guanshui Road Station (1:5000 scale)
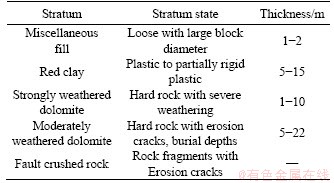
The station tunnel is located in a karst valley, and the elevation of the topography decreases from north to south. The surface of the area is covered with vegetation and structures, and most of the karst depressions have been buried. From top to bottom, the lithostratigraphy of the proposed Guanshui Road Station is miscellaneous fill, residual red clay, and strongly weathered and moderately weathered dolomite, as described in Table 1.
Because Guanshui Road Station is located in an old urban area, there are many nearby pipelines and structures, and the engineering geological conditions in the project section are complicated; therefore, strict requirements for stratum deformation control are necessary in the process of tunnel construction.
Table 1 Lithostratigraphy
2.2 Excavation scheme of triangular distribution tunnels
In the conventional design scheme of a wind pavilion group, the air ducts are arranged on one side of the main tunnel of a station and then extend to the surface to establish a wind pavilion. These air ducts include the fresh air duct, the exhaust air duct and the piston air duct. Because the conventional layout scheme of the wind pavilion group reduces the stability of the main tunnel [18], in this project, the air ducts are moved from the side of the main tunnel to the end of the tunnel. Through the centralized placement of wind pavilions at the end of the main tunnel, the number of holes on the side of the tunnel is reduced to one, which greatly reduces the difficulty of constructing the station’s auxiliary structure and the impact on the maintunnel stability. The different layout schemes for the wind pavilion group are shown in Figure 2.
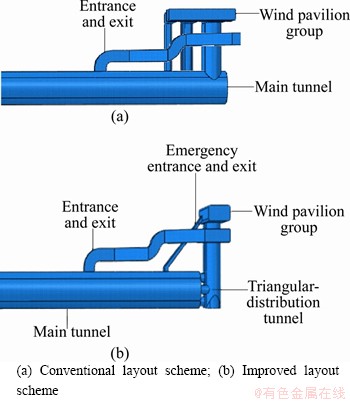
Figure 2 Layout schemes of wind pavilion group:
The improved scheme involves triangular distribution three-hole tunnels, including a fresh air exhaust tunnel and two running tunnels, at the end of the main tunnel. The layout and dimensions of these three tunnels are shown in Figure 3. As the spacing among the three tunnels is small, the mutual influences of these tunnels during the construction process are not conducive to the stability of the tunnel [19, 20]. Therefore, it is necessary to conduct a comparative study on the deformation and mechanical behavior of each tunnel under different construction sequences to determine the optimal construction scheme of the triangular-distribution three-hole tunnels.
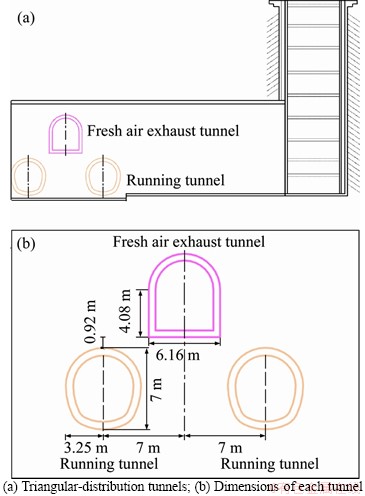
Figure 3 Schematic diagram of triangular distribution tunnels:
3 Three-dimensional numerical model of triangular-distribution tunnels
According to the working conditions of Guanshui Road Station and data from on-site investigations, a three-dimensional model of the triangular-distribution tunnels is established by using the finite element software ABAQUS, and the excavation of the tunnels is simulated. The deformation and destruction of underground caverns are influenced by geological discontinuities such as rock cracks and joints [21]. These fractures will provide unfavorable channels for groundwater, delaying the construction of the project. Therefore, considering geological discontinuities is very important when evaluating the stability of underground structures [22]. However, due to the relatively well developed karst in the proposed site, the distribution of cracks in the rock is more complicated and difficult to understand in detail. Therefore, it is difficult to model such a situation if the discontinuities of the surrounding rock are considered. To facilitate the modeling process, two assumptions are made when simulating soil material. One is that the rock and soil are regarded as a uniform and codirectional continuous medium. The other is the assumption of a uniform material: there are no voids [23].
3.1 Soil parameters and constitutive model of rock and soil mass
Since the Mohr-Coulomb yield criterion can express the stress relationship between the strain and stress of a failure surface under various stress states after plastic deformation occurs in rock [24], the Mohr-Coulomb elastoplastic constitutive model is used to simulate tunnel excavation in this model. The plastic constitutive model is used to set the parameters for the soil mass and the elastic constitutive model is used to set the parameters for the initial support and secondary lining of the tunnel [25]. Three-dimensional solid hexahedral elements are used to simulate the soil and tunnel lining. From top to bottom, the strata associated with the station are miscellaneous fill, residual red clay, strongly weathered dolomite, and moderately weathered dolomite. The physical and mechanical parameters of the relevant materials are shown in Table 2 (γ stands for volumetric weight; E stands for elastic modulus; v stands for Poisson ratio; c stands for cohesive forces; Ψ stands for the angle of internal friction).
3.2 Model scope and boundary conditions
According to the survey data and tunnel size, most of the tunnel body is located in moderately weathered dolomite, and part of the tunnel body is located in strongly weathered dolomite. The burial depth of the tunnel roof is 15-20 m, the thickness of the overlying sediment is 5-16 m, and the thickness of the rock layer is 4-14 m, which varies greatly. The three-dimensional model is shown in Figure 4.
To avoid the boundary effect, the length of the three-dimensional model is 140 m, the height is 80 m, and the width is L [26], which represents the final penetration thickness of the triangular distribution tunnels.
Table 2 Physical and mechanical parameters
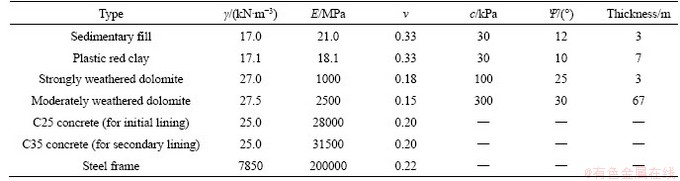

Figure 4 Three-dimensional model of triangular distribution tunnels
For the boundary conditions, the horizontal displacements of the left and right side boundaries and the longitudinal displacements of the front and back sides are restrained, with no vertical displacements allowed at the bottom boundary.
3.3 Construction schemes of triangular- distribution tunnels
To study the differences in tunnel deformation and stress caused by different excavation sequences of the triangular-distribution tunnels, it is necessary to formulate construction schemes of different tunnel excavation sequences. The tunnels are numbered as follows: ① represents the fresh air exhaust tunnel, and ② and ③ represent the left and right running tunnels, respectively. Considering the most unfavorable factors, the tunnel was excavated as a complete section during the simulation, and the distance in each step was 1 m [27].
There are six permutations of excavation sequences for the three tunnels in a triangular configuration, but because the tunnels are symmetrically arranged, only three schemes need to be considered. Additionally, to study the influence of the penetration thickness L of the triangular- distribution tunnels on the excavation stability and mechanical properties of the tunnel, four L values, including L=5, 10, 15 and 20 m, are selected for simulation.
3.4 Simulation steps of tunnel excavation
According to the simulated excavation schemes, each tunnel is excavated separately. The simulation of the tunnel excavation is carried out in four steps. The first step is to release the stress of the excavated soil of the tunnel; the second step is to activate the initial support; the third step is to “kill” the excavated soil, that is, to remove the excavated soil; and the fourth step is to activate the lining segment.
4 Analysis of influence of excavation of triangular-distribution tunnels
4.1 Excavation stability analysis of scheme 1
Scheme 1 involves excavating the ① fresh air exhaust tunnel, ② left running tunnel, and ③ right running tunnel in turn. To fully understand the stability of the tunnel under the excavation sequence of scheme 1, the deformation and stress of the tunnel support structures and surrounding rock, considering their variation with different tunnel penetration thicknesses L, are studied.
4.1.1 Deformation analysis of scheme 1
1) Deformation analysis of tunnel support structure
Figures 5 and 6 show the final vertical displacement nephograms (the displacement is positive upward and negative downward) and the horizontal displacement nephograms (the displacement is positive to the right and negative to the left) of the tunnel support structures for different L values.
Figure 5 shows that when L=5 m, for the fresh air exhaust tunnel, the maximum and minimum vertical displacements of the triangular-distribution tunnel support structure are located at the inverted arch (uplift of 2.332 mm) and the vault (settlement of 2.193 mm), respectively. The maximum and minimum horizontal displacements occur in the right sidewall (1.284 mm to the right) and left sidewall (1.135 mm to the left), respectively. Then, as L increases gradually (Figure 6), the maximum and minimum vertical displacements of the triangular-distribution tunnels support structures are located at the inverted arch of the left running tunnel and the vault of the fresh air exhaust tunnel, respectively, and the maximum and minimum horizontal displacements are located at the right and the left sidewalls of the fresh air exhaust tunnel, respectively. The maximum and minimum vertical displacements of the tunnel support structures both decrease slightly with increasing L, and are the lowest when L equals 20 m (2.304 mm and -2.208 mm, respectively). The maximum horizontal displacement of the tunnel decreases slightly with increasing L, and the minimum horizontal displacement varies only slightly with increasing L (by only 0.002 mm). When L equals 20 m, the maximum and minimum horizontal displacements are 1.281 mm and -1.131 mm, respectively.
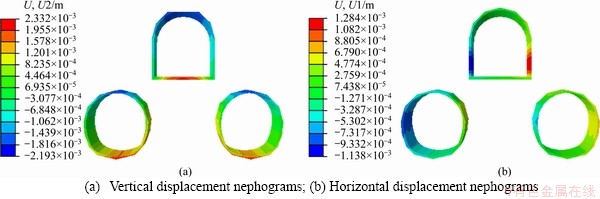
Figure 5 Displacement nephograms of triangular-distribution tunnel support structures (L=5 m):
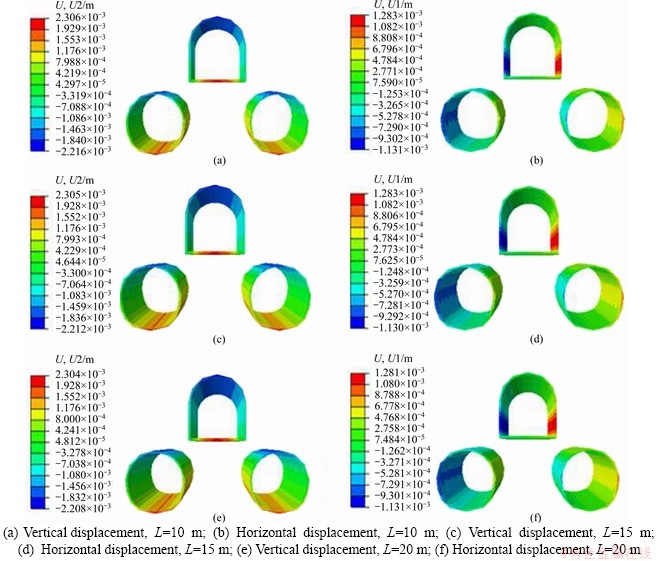
Figure 6 Displacement nephograms of triangular-distribution tunnels support structure (L=10, 15, 20 m):
2) Deformation analysis of surrounding rock and soil
Compared with the vertical displacement, the horizontal displacement of the triangular- distribution tunnels support structures is small and varies only slightly with increasing L. Therefore, for the rock and soil surrounding the triangular-distribution tunnels, the vertical displacement is very important, and the final vertical displacement nephograms for different L values are shown in Figure 7.
As seen from Figure 7, the surrounding rock of each tunnel exhibits large uplift near the inverted arch and large settlement near the vault. From the ground surface to the vault of the tunnel, the settlement of the soil increases. The maximum and minimum vertical displacements of the rock surrounding triangular-distribution tunnels for each L value tested occur at the inverted arch of the left running tunnel and the vault of the fresh air exhaust tunnel at the midline of the tunnel. With the increase in L, the maximum vertical displacement of the tunnel surrounding rock decreases gradually, and the maximum vertical displacement is the smallest at L=20 m (2.310 mm).The minimum vertical displacement first increases and then decreases gradually; the minimum vertical displacement occurs at L=5 m (-2.193 mm) and the maximum vertical displacement occurs at L=10 m (-2.217 mm).The maximum ground settlement for each L value tested occurs at the midline of the fresh air exhaust tunnel, and the ground settlement decreases gradually along the midline in both directions.
To further analyze the influence of triangular-distribution tunnels excavation on the surface subsidence, the point where the midline of each tunnel is perpendicular to the surface is taken as the surface settlement analysis point. The fresh air exhaust tunnel corresponds to the midpoint, the left running tunnel corresponds to the left point, and the right running tunnel corresponds to the right point. The settlement at each surface monitoring point caused by the construction is shown in Figure 8.
Figure 8 shows that the ground settlement at each monitoring point increases gradually with tunnel excavation. The largest ground settlement is at the midline of the fresh air exhaust tunnel (-1.076 mm), followed by the ground settlement at the midline of the right running tunnel (-0.910 mm), and the ground settlement at the midline of the left running tunnel is the lowest (-0.728 mm). When excavating tunnel ①, the settlement at the middle, left and right monitoring points account for 19.1%, 17.6% and 14.1% of the final settlement, respectively. When excavating tunnel ②, the settlements at each point account for 30.7%, 56.6% and 18.6%, respectively. When excavating tunnel ③, the settlements at each point account for 50.2%, 25.8% and 67.3%, respectively. Therefore, the maximum surface subsidence is caused by the excavation of tunnels ② and ③.
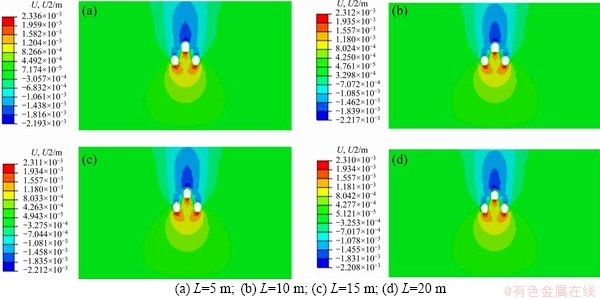
Figure 7 Final vertical displacement nephograms of rock and soil surrounding triangular-distribution tunnels:
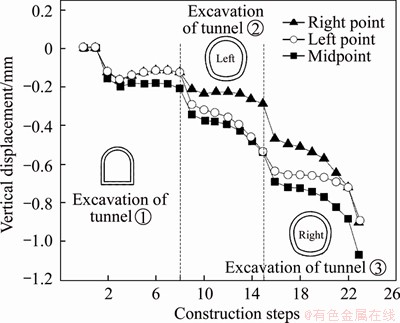
Figure 8 Surface displacement for scheme 1
4.1.2 Stress analysis of scheme 1
1) Stress analysis of tunnel support structures
Since the maximum and minimum principal stresses of the material are often used to judge the stability of a structure or construction, they are used here to analyze the mechanical effects caused by the excavation of triangular-distribution tunnels [28]. Figures 9 and 10 show the stress nephograms of the triangular-distribution tunnels support structures with different L conditions (tensile stress is positive, and compressive stress is negative).
According to Figure 9, when L=5 m, for the fresh air exhaust tunnel, the maximum principal stress (5.838 MPa) and the minimum principal stress (-7.917 MPa) of the tunnel supports structure are located at the left side of the inverted arch and in the bottom third of the tunnel, respectively. For the running tunnels, the maximum and minimum principal stresses of the tunnel support structures are located at the arch of the right running tunnel (1.323 MPa) and upper part of the right arch waist of the left running tunnel (-7.06 MPa), respectively.
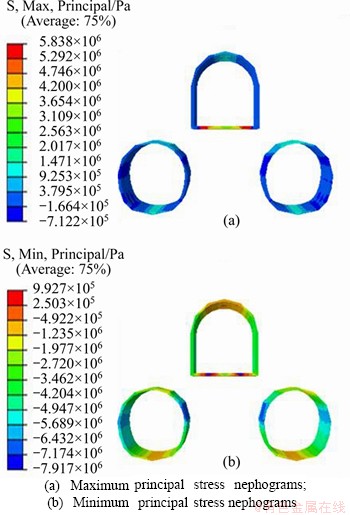
Figure 9 Stress nephograms of triangular-distribution tunnels support structures (L=5 m):
Figure 10 shows the maximum and minimum principal stresses of the triangular-distribution tunnels support structures for each L condition. For the fresh air exhaust tunnel support structure, the maximum and minimum principal stresses are located on the right side of the inverted arch of the fresh air exhaust tunnel. The maximum principal stress of the support structure first increases and then decreases with increasing L, reaching the maximum when L=15 m (5.817 MPa). The minimum principal stress decreases gradually with increasing L, reaching the minimum when L=20 m (-7.836 MPa). For the support structures of the running tunnels, the maximum principal stress is located at the vault of the left running tunnel when L=10 m, whereas the maximum and minimum principal stresses of the support structures for other L values are located in the vault of the right running tunnel and the upper part of the right arch waist of the left running tunnel, respectively. The maximum and minimum principal stresses of the support structures first decrease and then increase with increasing L, reaching the minimum when L=15 m (1.732 MPa and -7.335 MPa, respectively). Each tunnel is subjected to high compressive stress at the inverted arch, and because of the triangular layout of the tunnel, the arch waist of the running tunnels is subjected to compression.
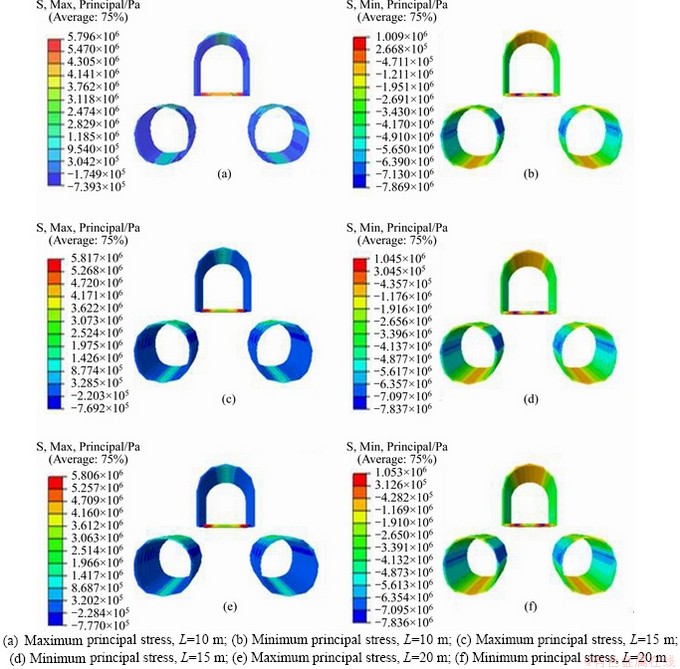
Figure 10 Stress nephograms of triangular-distribution tunnels support structures (L=10, 15, 20 m):
2) Stress analysis of surrounding rock and soil
After the tunnel is excavated, the support structures and the surrounding rock jointly bear the overburden pressure. Considering the compressive and non-tensile properties of rock and soil materials, Figure 11 shows maximum principal stress nephograms of the rock surrounding the triangular-distribution tunnels for each L. Here, tensile stress is positive, and compressive stress is negative.
From Figure 11, the maximum principal stress in the rock surrounding the triangular-distribution tunnels is located at the inverted arch of the fresh air exhaust tunnel and decreases gradually with increasing L. When L=20 m, the lowest maximum principal stress is 0.07686 MPa, which is 9.1% higher than the maximum principal stress of 0.06778 MPa in the rock surrounding the inverted arch when only the fresh air exhaust tunnel is excavated.

Figure 11 Nephograms of maximum principal stress distributions in rock surrounding triangular-distribution tunnels:
In the process of tunnel excavation, the stress of the surrounding rock continues to redistribute, and some of the surrounding rock experiences plastic deformation under the action of the minimum principal stress [29]. Nephograms of the plastic zone distribution in the rock surrounding the triangular-distribution tunnels are shown in Figure 12 for each L value tested.
Figure 12 shows that under the excavation sequence of scheme 1, the plastic zone formed by the extrusion of the rock surrounding the triangular-distribution tunnels is mainly distributed in the area surrounding the arch foot of the fresh air exhaust tunnel to the arch waist of the two running tunnels. Because the left running tunnel is excavated before the right running tunnel, the plastic zone of the surrounding rock between the fresh air exhaust tunnel and the left running tunnel is larger than that near the right running tunnel.
4.2 Excavation stability analysis of scheme 2
Scheme 2 involves the excavation of the ② left running tunnel, ① fresh air exhaust tunnel and ③ right running tunnel in turn.
4.2.1 Deformation analysis of scheme 2
1) Deformation analysis of tunnel support structures
In scheme 1, the deformation of the tunnel support structures exhibits a certain rule with the change in L, so to reduce the length of the article, the displacement nephograms of the results are provided for only L=5 m and L=20 m. The final vertical displacement nephograms (the displacement is positive upward and negative downward) and the horizontal displacement nephograms (the displacement is positive to the right and negative to the left) of the tunnel support structures for L=5 m and L=20 m are shown in Figure 13.

Figure 12 Nephograms of plastic zone distribution in rock surrounding triangular-distribution tunnels:
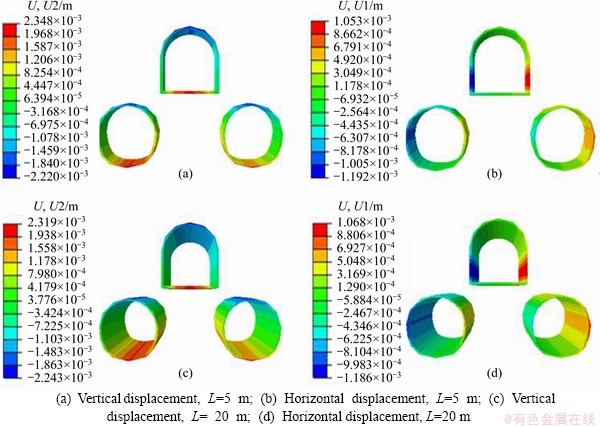
Figure 13 Displacement nephograms of triangular distribution tunnels support structures (L=5, 20 m):
Figure 13 indicates that the maximum and minimum vertical displacements of the triangular distribution tunnels support structures for each L are consistently located at the inverted arch of the left running tunnel and the vault of the fresh air exhaust tunnel, respectively, whereas the maximum and minimum horizontal displacements are consistently located at the right sidewall and the left sidewall of the fresh air exhaust tunnel, respectively. With an increase in L, the maximum vertical displacement and the minimum horizontal displacement of the tunnel support structures both decrease gradually, thus, the lowest values are observed for L=20 m (2.319 mm and -1.186 mm, respectively).
2) Deformation analysis of surrounding rock and soil
The final vertical displacement nephograms of the surrounding rock and soil for L=5 m and 20 m are shown in Figure 14.

Figure 14 Final vertical displacement nephograms of rock and soil surrounding the triangular-distribution tunnels:
Figure 14 shows that the maximum and minimum vertical displacements of the rock surrounding the triangular-distribution tunnels for each L value tested occur in the inverted arch of the left running tunnel and the vault midline of the fresh air exhaust tunnel, respectively. Each tunnel exhibits large uplift at the inverted arch and large settlement at the vault. As L increases, the maximum vertical displacement in the rock surrounding the tunnel decreases gradually, with the lowest vertical displacement of 2.323 mm when L=20 m. Additionally, the minimum vertical displacement first increases and then decreases, with the inflection point at L=10 m and the lowest vertical displacement (-2.221 mm) at L=5 m.
Regarding the ground settlement, the points corresponding to the midlines of each tunnel at the surface are taken as the ground settlement analysis points. The midpoint, left point and right point correspond to the fresh air exhaust tunnel, left running tunnel and right running tunnel, respectively. The settlement of each surface monitoring point caused by the construction is shown in Figure 15.
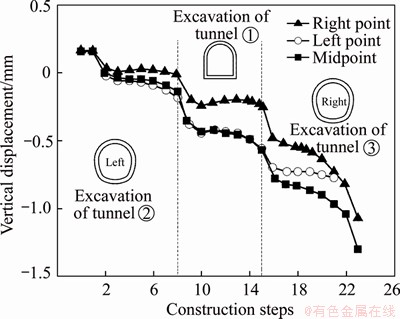
Figure 15 Displacement of ground surface points for scheme 2
Figure 15 shows that the final surface settlement is the largest at the midpoint (-1.097 mm), followed by the left point (-0.911 mm), and the smallest at the right point (-0.920 mm). When excavating tunnel ②, the proportions of the surface subsidence relative to the final settlement at the midpoint, left point and right point are 20.6%, 27.9% and 14.2%, respectively. When excavating tunnel ①, the surface subsidence proportions are 22.7%, 31.7% and 18.8%, respectively. When excavating tunnel ③, the surface subsidence proportions are 56.7%, 40.4% and 67%, respectively. In the process of excavation, the increasing rate of surface subsidence is the greatest at the midpoint, and the ground surface at each point exhibits the maximum settlement when tunnel ③ is excavated.
4.2.2 Stress analysis of scheme 2
1) Stress analysis of tunnel support structures
Scheme 1 shows that the stress of the tunnel support structures changes with L regularly, so to reduce the length of the article, the stress nephograms of the results are listed for only L=5 m and L=20 m. The stress nephograms of the triangular-distribution tunnels support structures for L=5 m and L=20 m (tensile stress is positive, and compressive stress is negative) are shown in Figure 16.
Figure 16 shows that the maximum and minimum principal stresses of the triangular distribution tunnels support structures for each L are located in the inverted arch of the fresh air exhaust tunnel and in the right arch waist of the left running tunnel and that the arch waist of the running tunnels experiences intense compression. With the increase in L, the maximum principal stress of the tunnel support structures first increases and then decreases gradually, with an inflection point at L=15 m and the lowest value at L=5 m (5.441 MPa). The minimum principal stress also first increases and then decreases gradually with increasing L, resulting in an inflection point at L=10 m and the lowest value at L=5 m (-7.612 MPa).

Figure 16 Stress nephograms of triangular distribution tunnels support structures (L=5, 20 m):
2) Stress analysis of surrounding rock and soil
Figure 17 shows the maximum principal stress nephograms of the rock surrounding the triangular- distribution tunnels for L=5 m and 20 m. Here, tensile stress is positive, and compressive stress is negative.
Figure 17 indicates that the maximum principal stresses in the rock and soil surrounding the triangular-distribution tunnels are located at the inverted arch of the fresh air exhaust tunnel for each L tested. The maximum principal stress of the surrounding rock and soil first increases and then decreases gradually with increasing L. The inflection point occurs at L=10 m, and the lowest value is 0.08317 MPa at L=5 m, which is 9.45% lower than the maximum principal stress of the surrounding rock at the inverted arch (0.09815 MPa) when only the fresh air exhaust tunnel is excavated.
Nephograms of the plastic zone distribution in the rock surrounding the triangular-distribution tunnels for L=5 m and 20 m are shown in Figure 18.
As Figure 18 shows, for excavation scheme 2, the plastic zone distribution of the rock surrounding the triangular-distribution tunnels is basically the same as that for scheme 1, but due to the difference in excavation sequence, the plastic zone generated in the surrounding rock mass between the upper part of the left arch waist of the right running tunnel and the arch foot of the fresh air exhaust tunnel is larger than that of the surrounding rock near the arch waist of the left running tunnel.
4.3 Excavation stability analysis of scheme 3
Scheme 3 involves excavating the ② left running tunnel, ③ right running tunnel and ① fresh air exhaust tunnel in turn.
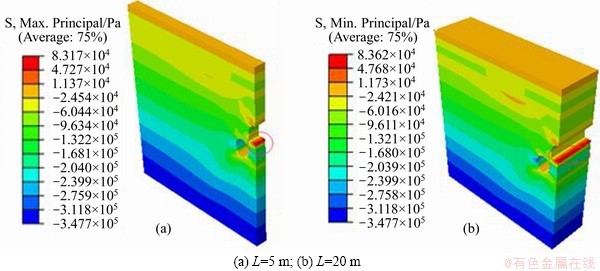
Figure 17 Nephograms of maximum principal stress distributions in rock surrounding triangular-distribution tunnels:

Figure 18 Nephograms of plastic zone distribution in rock surrounding triangular-distribution tunnels:
4.3.1 Deformation analysis of scheme 3
1) Deformation analysis of tunnel support structures
Figure 19 shows the final vertical displacement nephograms (the displacement is positive upward and negative downward) and the horizontal displacement nephograms (the displacement is positive to the right and negative to the left) of the tunnel support structures for L=5 m and L=20 m.
Figure 19 shows that when L=5 m, the maximum vertical displacement of the triangular-distribution tunnels support structure is located at the inverted arch of the left running tunnel, whereas for the other L values, the maximum and minimum vertical displacements are located at the inverted arch of the right running tunnel and the vault of the fresh air exhaust tunnel, respectively. The maximum and minimum horizontal displacements are located at the right sidewall of the fresh air exhaust tunnel and the left arch waist of the left running tunnel. With the increase of L, the maximum vertical displacement and the minimum horizontal displacement of the tunnel support structures decrease gradually and then remain unchanged, reaching the greatest values at L=20 m (2.323 mm and -1.021 mm, respectively). The minimum vertical displacement first increases and then decreases gradually as L increases, with an inflection point at L=10 m and the lowest value at L=5 m (-2.244 mm). The maximum horizontal displacement remains basically unchanged after increasing gradually and exhibits the lowest value at L=5 m (1.063 mm).
2) Deformation analysis of surrounding rock and soil
The final vertical displacement nephograms of the surrounding rock and soil for L=5 m and 20 m are shown in Figure 20.
When L=20 m, the maximum vertical displacement of the rock surrounding the triangular-distribution tunnels occurs at the inverted arch of the right running tunnel, whereas for other L values, the maximum and minimum vertical displacements of the surrounding rock occur at the inverted arch of the left running tunnel and at the midline of the vault of the fresh air exhaust tunnel, respectively. With an increase in L, the maximum vertical displacement of the rock surrounding the triangular-distribution tunnels decreases gradually, with the lowest value at L=20 m (2.321 mm), and the minimum vertical displacement first increases and then decreases, with an inflection point at L= 10 m and a lowest value at L=5 m (-2.244 mm).
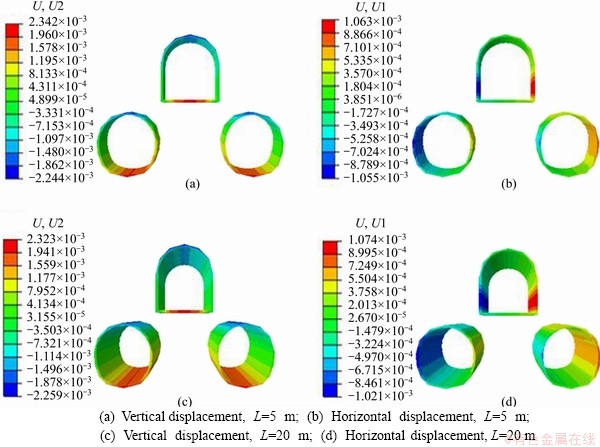
Figure 19 Displacement nephograms of triangular-distribution tunnel support structures (L=5, 20 m):

Figure 20 Final vertical displacement nephograms of rock and soil surrounding triangular-distribution tunnels:
For the ground settlement, the settlement at each tunnel surface monitoring point during construction when L=5 m is shown in Figure 21.
As shown in Figure 21, with the excavation of the tunnel, the settlement of each surface monitoring point increases gradually. The final surface settlement is the greatest at the midpoint (-1.109 mm), the second greatest at the right point (-0.928 mm), and the lowest at the left point (-0.921 mm). When excavating tunnel ②, the proportions of surface subsidence to the final settlement at the midpoint, left point and right point are 20.4%, 27.6% and 14.1%, respectively. When excavating tunnel ③, the surface subsidence proportions are 9.9%, 14.8% and 28.5%, respectively. When excavating tunnel ①, the surface subsidence proportions are 59.7%, 57.6% and 57.4%, respectively. The ground surface at each point produces the maximum settlement when ① is finally excavated.
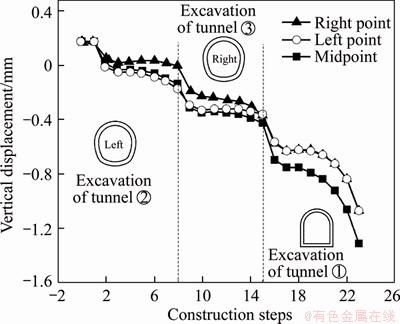
Figure 21 Displacement of ground surface points for scheme 3
4.3.2 Stress analysis of scheme 3
1) Stress analysis of tunnel support structures
Figure 22 shows the stress nephograms of the triangular-distribution tunnels support structures (tensile stress is positive, and compressive stress is negative). Figure 22 shows that the maximum and minimum principal stresses of the triangular- distribution tunnels support structures are located at the inverted arch of the fresh air exhaust tunnel and the right arch waist of the left running tunnel, respectively. With the increase in L, the maximum principal stress of the support structures decreases gradually, reaching the highest value at L=5 m (5.087 MPa), and the minimum principal stress first increases and then decreases, with an inflection point at L=10 m and the lowest value at L=5 m (-7.672 MPa).
2) Stress analysis of surrounding rock and soil
The maximum principal stress nephograms of the rock surrounding the triangular-distribution tunnels for L=5 m and 20 m are shown in Figure 23. Here, tensile stress is positive, and compressive stress is negative.
Figure 23 indicates that the maximum principal stress in the rock and soil surrounding the tunnel for each L is located at the inverted arch of the fresh air exhaust tunnel. The maximum principal stress of the surrounding rock and soil first increases and then decreases with increasing L. The inflection point is at L=10 m and the lowest stress, 0.08855 MPa, is observed when L=20 m.
Nephograms of the plastic zone distribution in the rock surrounding the triangular-distribution tunnels for L=5 m and 20 m are shown in Figure 24.
As Figure 24 shows, the plastic zone distribution in the rock surrounding the triangular- distribution tunnels for scheme 3 is basically the same as that for scheme 2, for each L value tested.
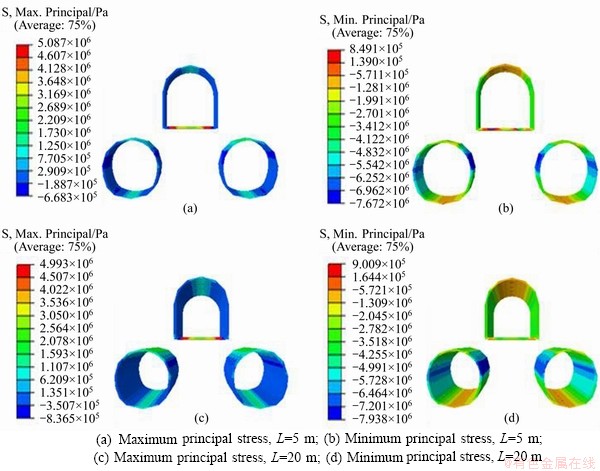
Figure 22 Stress nephograms of triangular-distribution tunnels support structures (L=5 m, 20 m):
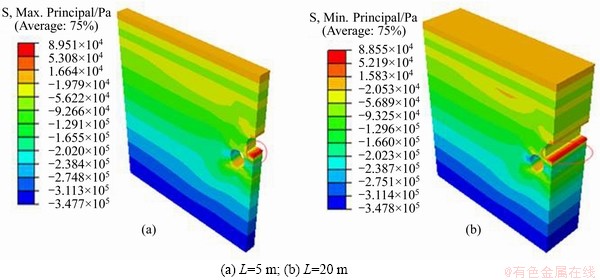
Figure 23 Nephograms of maximum principal stress distributions in rock surrounding triangular-distribution tunnels:
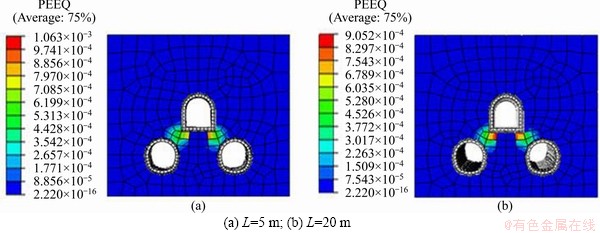
Figure 24 Nephograms of plastic zone distribution in rock surrounding triangular-distribution tunnels:
5 Comparison of triangular-distribution tunnels construction schemes
5.1 Deformation and surface settlement analysis of support structures under each scheme
1) Comparative analysis of deformation
The maximum and minimum vertical displacements of the support structures under different schemes are shown in Figure 25.
As Figure 25 indicates, the maximum and minimum vertical displacements of the tunnel support structures for scheme 1 are the lowest among the three schemes for each L tested. The maximum uplift of the tunnel support structures decreases gradually with increasing L but varies nonlinearly. The maximum settlement first increases and then decreases gradually with the increase in L, with an inflection point at L=10 m, and the lowest value at L=5 m. Note that the construction site is located in an old urban area with a karst valley landform, and the surrounding structures and underground pipelines are relatively dense, so the soil displacement needs to be strictly controlled to guarantee the safety of these structures. Because the maximum uplift and maximum settlement produced during scheme 1 with L=5 m are the smallest, scheme 1 with L=5 m is the optimal scheme to control the vertical displacement.
The maximum and minimum horizontal displacements of the support structures under the different schemes are shown in Figure 26.
As seen from Figure 26, for the maximum horizontal displacement, scheme 1 always exhibits the highest values, and scheme 2 always exhibits the lowest values. For the minimum horizontal displacement, scheme 2 always exhibits the highest values and scheme 3 always exhibits the lowest values. In this respect, scheme 1 is not more favorable than the other two schemes. With an increase in L, except for the increase and stabilization in the minimum horizontal displacement of the support structures observed for scheme 3, the maximum and minimum horizontal displacements of the tunnel support structures do not change considerably among the three considered scheme.
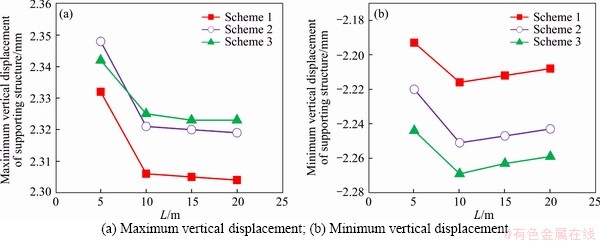
Figure 25 Maximum and minimum vertical displacement of support structures for three schemes:

Figure 26 Maximum and minimum horizontal displacement of support structures for the three schemes:
2) Comparative analysis of surface subsidence
According to the previous analysis, the settlement of the support structures and surrounding rock is the lowest when L=5 m under each scheme, and the ground settlement at the midline of the tunnel is the highest. Here, the surface settlement results of the three schemes at L=5 m are compared. The final surface settlement results of the three schemes are listed in Table 3.
Table 3 shows that when L=5 m, the ground settlement of scheme 1 (-1.076 mm) is smaller than those of scheme 2 (-1.097 mm) and scheme 3 (-1.109 mm), making scheme 1 the optimal scheme.
Table 3 Surface settlement results of three schemes (L= 5 m)
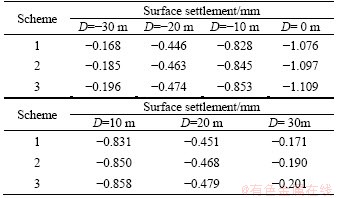
In summary, to control the surface settlement caused by the construction of a triangular- distribution tunnels, scheme 1 with L=5 m is always the best approach to use.
5.2 Comparative analysis of stress
1) Comparative analysis of stress of support structures
The maximum and minimum principal stresses of the support structures are shown in Figure 27 for each of the three schemes.
Figure 27 shows that when L increases from 5 m to 10 m, the maximum and minimum principal stresses of the tunnel support structures in each scheme initially change quickly but then change more slowly with a further increase in L. The maximum principal stress of the tunnel support structures is the highest with scheme 1, followed by scheme 2, and the lowest is observed with scheme 3, making scheme 3 the optimal scheme. The minimum principal stress is the lowest for scheme 2 when L=5 m among the various excavation conditions, making this the optimal scheme.
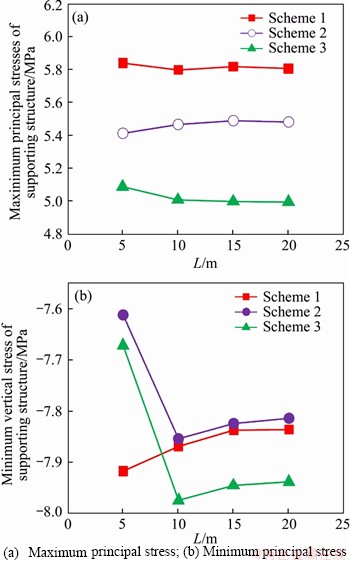
Figure 27 Maximum and minimum principal stresses of support structures for three schemes:
2) Comparative analysis of stress of surrounding rock
The principal stress and the maximum equivalent plastic strain of the support structures are shown in Figure 28 for each of the three schemes.
Figure 28 shows that the maximum principal stress of the rock surrounding the tunnel for scheme 1 is the lowest among the three schemes and the soil is subjected to a weak tensile force, which is optimal. However, the maximum equivalent plastic strain of the rock surrounding the tunnel for scheme 1 is the highest among the three schemes [30]. The surrounding rock and soil exhibit considerable plastic deformation, which is not conducive to the stability of the tunnel. When L increases from 5 m to 10 m, the maximum principal stress and maximum equivalent plastic strain of the surrounding rock and soil in each scheme change greatly.

Figure 28 Maximum principal stress and maximum equivalent plastic strain of surrounding rock for three schemes:
In summary, to control the internal force of the support structures caused by the construction of triangular-distribution tunnels, there is little difference between scheme 2 and scheme 3 when L=5 m, and they are both considered better schemes than scheme 1. For controlling the internal stress of the surrounding rock, there is no clearly optimal scheme. Each scheme has advantages, so when choosing the construction scheme, it is necessary to choose the appropriate construction scheme via comprehensive consideration.
6 Analysis of running tunnel monitoring data
The engineering geological conditions of the triangular-distribution tunnels construction site are relatively complex, with relatively well developed karst features. Moreover, there are many structures and underground pipelines around the building site. Therefore, to avoid adverse effects on adjacent structures and underground pipelines, it is necessary to control the vertical displacement of the surface and the support structures. Compared with the results of the other two schemes, the surface settlement and the vertical displacement of the support structures produced for scheme 1 are the lowest; thus, scheme 1 has the best ability to control the deformation of the strata. Therefore, scheme 1 should be adopted when carrying out the triangular-distribution tunnels construction: the fresh air exhaust tunnel should be excavated first, then the left running tunnel should be excavated, and finally, the right running tunnel should be excavated.
According to numerical simulation results, the surface settlement and support structure deformation are the lowest when L=5 m. Therefore, scheme 1 (L=5 m) should be adopted when constructing the triangular-distribution tunnels to ensure the smooth completion of the project. Below, the final surface settlement obtained from on-site monitoring of the running tunnels is compared with that obtained from the model.
According to the calculation results of the model, the surface settlement values corresponding to the midline of the left running tunnel, the fresh air exhaust tunnel and the right running tunnel are -0.898, -1.076 and -0.902 mm, respectively. The corresponding monitoring points are DBC36130-3, DBC36130-4 and DBC36130-5, which yielded settlement values of -1.23, -1.44 and -1.31 mm, respectively. The monitoring data and simulation results are shown in Figure 29.
Figure 29 shows that the monitoring data are basically consistent with the simulation results. Therefore, the numerical simulation of this triangular-distribution tunnels excavation scheme is in line with the actual situation and provides a reference for on-site construction in actual construction.
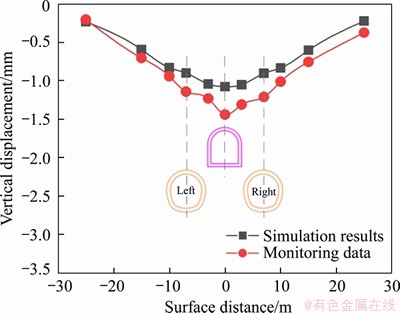
Figure 29 Comparison of vertical surface displacements
7 Discussion
In this paper, the influence of tunnel construction on the surrounding rock and soil in karst areas is studied with the finite element software ABAQUS to obtain the optimal scheme for controlling surface deformation in karst areas. When establishing the tunnel excavation model, the rock and soil mass is regarded as a homogeneous isotropic continuous medium with no cavities. Therefore, the effects of geological discontinuities such as rock cracks and mineral veins are not considered in this paper. However, the existence of geological discontinuities in the rock will affect the strength and stability of the surrounding rock. At present, many scholars have conducted research on geological discontinuities in rock. The research directions include the distribution and development of cracks in rock [31], and the quality evaluation of rock. The existence of cracks and mineral veins in rock affects by the intermediate principal stress [32], but the Mohr-Coulomb model used in the modeling ignores the influence of the intermediate principal stress. Therefore, to more accurately represent the distribution of cracks and mineral veins in the rock, a more appropriate constitutive model and discrete element model will be one of the future research directions.
For a specific area, there are often specific geological conditions, and there will be engineering treatment methods most appropriate for the area. To determine the optimal engineering treatment method in this area, it is necessary to evaluate the geological conditions, rock quality and other parameters, and then establish the corresponding relationship between these regional characteristics and the engineering treatment to provide a reference for the construction of similar areas in the future. Therefore, further research needs to integrate parameters such as rock mass quality, rock support and deformation data in karst areas to establish an evaluation system for construction methods in karst areas [33].
At the same time, tunnel construction is often accompanied by grouting, and the existence of cracks will affect the grouting effect. At present, scholars have established fracture network and studied the influence of fracture distribution, shape, and connectivity on instantaneous grouting penetration [34]. Therefore, the next research direction is to study the distribution of fracture networks in rock and soil under the condition of hydraulic coupling and refine the impact evaluation during tunnel construction.
8 Conclusions
In this paper, a three-dimensional numerical simulation method is used to study the influence of the triangular-distribution tunnels construction on the strata and to assess the surrounding interactions among the tunnels. Based on this analysis, a reasonable construction scheme is proposed to ensure the smooth completion of the project. The main conclusions are as follows:
For a given L value, when scheme 1 is adopted for construction, the surface subsidence, the uplift and settlement of the support structures, and the maximum principal stress of the surrounding rock are the lowest among the three schemes and can reach -1.076, 2.332, 2.193 mm, and 0.08197 MPa, respectively, when L=5 m. When adopting scheme 2, the support structures are subjected to the lowest minimum principal stress (-7.612 MPa, when L=5 m). When adopting scheme 3, the maximum principal stress of the support structure and the plastic deformation of the surrounding rock are the lowest (5.087 MPa and 0.001063, respectively, when L=5 m). Among the three construction schemes of the triangular distribution tunnels, if it is necessary to control the ground settlement caused by the tunnel, scheme 1 (L=5 m) is the best scheme, and scheme 3 is the worst scheme. If it is necessary to control the vertical displacement of the support structures, the maximum settlement and uplift values of the support structures in scheme 1 are the lowest, making it the optimal scheme (L=5 m). However, if it is necessary to control the horizontal displacement of the support structures or the stress in the support structures, scheme 1 is the worst scheme, while scheme 2 and scheme 3 are both slightly better options and provide similar results. If it is necessary to control the plastic deformation of the surrounding rock, the three schemes are not considerably different. In the studied project, it is more reasonable to adopt the top-to-bottom strategy of scheme 1 for tunneling.
Contributors
The overarching research goals were developed by CHEN Tao, WEI Jun, and LIN Yu-liang. CHEN Tao, ZHOU Kun, LIN Yu-liang and ZHANG Jian provided the concept and edited the draft of manuscript. CHEN Tao, ZHOU Kun, LIU Xiao-chun, and SHEN Quan conducted the literature review and wrote the first draft of the manuscript.
Conflict of interest
CHEN Tao, ZHOU Kun, WEI Jun, LIU Xiao- chun, LIN Yu-liang, ZHANG Jian, and SHEN Quan declare that they have no conflict of interest.
References
[1] LIU Xiu-juan, YAN Li, YUAN Guo-qing, LI Shuang. Simulation analysis of wind pavilion noise characteristic and the attenuation in Suzhou Metro [J]. Urban Mass Transit, 2015(12): 53-58. DOI: 10.16037/j.1007-869x.2015.12.013. (in Chinese)
[2] HAN Yun, ZHAO Lei, ZHU Chang-lin. On construction and management of subway ventilation pavilion in Xi’an city [J]. Urban Mass Transit, 2010, 38(1): 61-70. DOI: 10.16037/ j.1007-869x.2010.04.006. (in Chinese)
[3] YANG Hong-she. Technology for support consisting of systematic bolts and steel arches applied in construction of ingate and junction section between ventilation tunnel and main body of metro station [J]. Tunnel Construction, 2014, 34(9): 900-907. DOI: 10.3973/j.issn.1672-741X. 2014.09.013. (in Chinese)
[4] KOOI C B, VERRUIJT A. Interaction of circular holes in an infinite elastic medium [J]. Tunnelling and Underground Space Technology, 2001, 16(1): 59-62. DOI: 10.1016/ S0886-7798(01)00027-X.
[5] TRAN-MANH H, SULEM J, SUBRIN D. Interaction of circular tunnels in anisotropic elastic ground [J]. Géotechnique, 2015, 65(4): 287-295. DOI: 10.1680/geot.14. P.178.
[6] WANG H N, GAO X, WU L, JIANG M J. Analytical study on interaction between existing and new tunnels parallel excavated in semi-infinite viscoelastic ground [J]. Computers and Geotechnics, 2020, 120: 103385. DOI: 10.1016/j.compgeo.2019.103385.
[7] WANG H N, WU L, JIANG M J, SONG F. Analytical stress and displacement due to twin tunneling in an elastic semi-infinite ground subjected to surcharge loads [J]. International Journal for Numerical and Analytical Methods in Geomechanics, 2018, 42(6): 809-828. DOI: 10.1002/ nag.2764.
[8] YAMAGUCHI I, YAMAZAKI I, KIRITANI Y. Study of ground-tunnel interactions of four shield tunnels driven in close proximity, in relation to design and construction of parallel shield tunnels [J]. Tunnelling and Underground Space Technology, 1998, 13(3): 289-304. DOI: 10.1016/S0886-7798(98)00063-7.
[9] LI Xue-feng, DU Shou-ji, ZHANG Ding-feng. Numerical simulation of the interaction between two parallel shield tunnels [C]// International Conferenceon Pipelines and Trenchless Technology, 2012. DOI: 10.1061/9780784412619. 155.
[10] LIU Han-long, LI Ping, LIU Jin-yuan. Numerical investigation of underlying tunnel heave during a new tunnel construction [J]. Tunnelling and Underground Space Technology, 2011, 26(2): 276-283. DOI: 10.1016/j.tust.2010. 10.002.
[11] JIANG Xi-liang, LI Lin, YUAN Jie, YIN Jia-shun. Dynamic analysis of strata horizontal displacements induced by shield construction of deep tunnel [J]. Rock and Soil Mechanics, 2011, 32(4): 1186-1192. DOI: 10.16285/j.rsm.2011.04.034. (in Chinese)
[12] WANG Ming-nian, LI Zhi-ye, GUAN Bao-shu. Research on controlling measures for ground surface settlement of three little distance parallel shallow embedded tunnels [J]. Rock and Soil Mechanics, 2002, 23(6): 821-824. DOI: 10.16285/ j.rsm.2002.06.0040. (in Chinese)
[13] CHAPMAN D N, AHN S K, HUNT D V L. Investigating ground movements caused by the construction of multiple tunnels in soft ground using laboratory model tests [J]. Canadian Geotechnical Journal, 2007, 44(6): 631-643. DOI: 10.1139/t07-018.
[14] SUN Tie-cheng, YUE Zu-run, GAO Bo, LI Qiang, ZHANG Yun-gang. Model test study on the dynamic response of the portal section of two parallel tunnels in a seismically active area [J]. Tunnelling and Underground Space Technology, 2011, 26(2): 391-397. DOI: 10.1016/j.tust.20 10.11.010.
[15] LIU Hong-yuan, SMALL J C, CARTER J P. Full 3D modelling for effects of tunnelling on existing support systems in the Sydney region [J]. Tunnelling and Underground Space Technology, 2008, 23(4): 399-420. DOI: 10.1016/j.tust.2007.06.009. (in Chinese)
[16] HERNANDEZ Y Z, FARFAN A, De Assis A P. Three-dimensional analysis of excavation face stability of shallow tunnels [J]. Tunnelling and Underground Space Technology, 2019. DOI: 10.1016/j.tust.2019.103062.
[17] JIN Yin-fu, ZHU Bing-qing, YIN Zhen-yu, ZHANG Dong-mei. Three-dimensional numerical analysis of the interaction of two crossing tunnels in soft clay [J]. Underground Space, 2019, 4(4): 310-327. DOI: 10.1016/j.undsp.2019.04.002. (in Chinese)
[18] YOO C, CUI Shuai-shuai, WU Ke, ZHANG Qian-jin, ZHANG Zheng, ZHAO Jia-hui. Mechanical mechanism of main tunnels and cross passage construction-a 3d numerical investigation [J]. Journal of Korean Geosynthetics Society, 2019, 18(1): 11-23. https://scholar.cnki.net/new/Detail/ index/SJNVLAST/SJNVADBDBCD37C8EE4737F68C90A5B573647.
[19] FANG Qian, ZHANG Ding-li, LI Qian-qian, LOUIS N Y W. Effects of twin tunnels construction beneath existing shield-driven twin tunnels [J]. Tunnelling and Underground Space Technology, 2015, 45: 128-137. DOI: 10.1016/ j.tust.2014.10.001.
[20] ZHANG Jian, LIANG Yu, FENG Tu-gen. Investigation of the cause of shield-driven tunnel instability in soil with a soft upper layer and hard lower layer [J]. Engineering Failure Analysis, 2020, 118: 104832. DOI: 10.1016/j.engfailanal. 2020.104832.
[21] ZHANG Jian, FENG Tu-gen, ZHANG Fu-hai, LI Wen-bin. Experimental study on the improvement of seawall filler materials composed of sea-sand and sea-mud [J]. Marine Georesources & Geotechnology, 2020, 38(2): 193-203. DOI: 10.1080/1064119X.2018.1564805
[22] WANG Xiao-shan, JIANG Yu-jin, LI Bo . Experimental and numerical study on crack propagation and deformation around underground opening in jointed rock masses [J]. Geosciences Journal, 2017, 21(2): 291-304. DOI: 10.1007/ s12303-016-0051-8.
[23] CHENG Lyu, LI Yu, WANG Ming-nian, XIA Peng-xi, SUN Yuan. Upper bound analysis of collapse failure of deep tunnel under karst cave considering seismic force [J]. Soil Dynamics and Earthquake Engineering, 2020. DOI: 10.1016/j.soildyn.2019.106003.
[24] WANG Hong-cai, ZHAO Wen- hua, SUN Dong-sheng, GUO Bin-bin. Mohr-coulomb yield criterion in rock plastic mechanics [J]. Chinese Journal of Geophysics, 2012, 55(6): 733-741. DOI: 10.1002/cjg2.17 67.
[25] BANERJEE S K, CHAKRABORTY D. Behavior of twin tunnels under different physical conditions [J]. International Journal of Geomechanics, 2018, 18(8): 06018018. DOI: 10.1061/(asce)gm.1943-5622.0001216.
[26] KATEBI H, REZAEI A H, HAJIALILUEBONAB M, TARIFARD A. Assessment the influence of ground stratification, tunnel and surface buildings specifications on shield tunnel lining loads (by FEM) [J]. Tunnelling and Underground Space Technology, 2015, 49: 67-78. DOI: 10.1016/j.tust.2015.04.004.
[27] BARLA G B. Full-face excavation of large tunnels in difficult conditions [J]. Journal of rock mechanics and geotechnical engineering, 2016, 8(3): 294-303. DOI: 10.1016/j.jrmge.2015.12.003.
[28] SHIN B, SUNG S. Explosion simulation for viscoelastic objects [J]. Multimedia Tools and Applications, 2018, 77(22): 30135-30147. DOI: 10.1007/ s11042-018-6438-y.
[29] WANG Ming-yang, XIE Dong-sheng, LI Jie, ZHANG Ning. Dynamic constitutive model for deformation and fracture of deep rock mass [J]. Chinese Journal of Rock Mechanics and Engineering, 2013, 32(6): 1112-1120. DOI: 10.3969/ j.issn.1000-6915.2013.06.004. (in Chinese)
[30] WANG Hui, CHEN Wei-zhong, TAN Xian-jun, TIAN Hong-ming, CAO Jun-jie. Development of a new type of foam concrete and its application on stability analysis of large-span soft rock tunnel [J]. Journal of Central South University, 2012, 19(11): 3305-3310. DOI: 10.1007/s117 71-012-1408-4.
[31] JAYASINGHE L B, SHANG Jun-long, ZHAO Zhi-ye, GOH A T C. Numerical investigation into the blasting-induced damage characteristics of rocks considering the role of in-situ stresses and discontinuity persistence [J]. Computers and Geotechnics, 2019. DOI: 10.1016/j.comp10.1016/j. compgeo.2019.10327.
[32] SHANG Jun-long. Rupture of veined granite in polyaxial compression: Insights from three-dimensional discrete element method modeling [J]. Journal of Geophysical Research: Solid Earth, 2020, 125(2). DOI: 10.1029/2019J B019052.
[33] HOIEN A H, NILSEN B, OLSSON R. Main aspects of deformation and rock support in Norwegian road tunnels [J]. Tunnelling and Underground Space Technology, 2019: 262-278. DOI: 10.1016/j.tust.2019.01.026.
[34] FEI Xiao, SHANG Jun-long, ZHAO Zhi-ye. DDA based grouting prediction and linkage between fracture aperture distribution and grouting characteristics [J]. Computers and Geotechnics, 2019: 350-369. DOI: 10.1016/j.compgeo.2019. 04.028.
(Edited by HE Yun-bin)
中文导读
地铁车站风亭组三角形分布隧道开挖影响分析
摘要:贵阳地铁2号线观水路站隧道工程为减少主体隧道开孔数量,将风亭组搬出主体隧道,在主体隧道入口处以三角形布局开挖风亭组。通过有限元软件ABAQUS建立三维模型研究了不同三角形布设隧道群开挖方案对地表沉降和隧道稳定性的影响。本研究的目的是揭示支护结构和围岩中地表沉降、变形和受力的变化规律,确定适合该种隧道布局的最佳开挖方案。结果表明,为控制地表沉降和支护结构变形,最佳开挖顺序为先开挖上部新风排风隧道,再开挖下部区间隧道。为控制支护结构的应力,最佳开挖方案是先开挖下部区间隧道,然后再开挖上部新风排风隧道。在本工程中,隧道最合理的开挖顺序为自上而下。隧道的最合理贯通厚度为5 m。
关键词:车站隧道;风亭组;有限元分析;隧道及围岩变形;应力分析
Foundation item: Projects(B200204032, 2019B07914) supported by the Fundamental Research Funds for the Central Universities, China; Projects(51878667, 51678571, 51808193) supported by the National Natural Science Foundation of China
Received date: 2020-03-25; Accepted date: 2020-08-27
Corresponding author: LIN Yu-liang, PhD, Professor; Tel: +86-13508477813; E-mail: linyuliang11@csu.edu.cn, linyuliang11@ 163.com; ORCID: https://orcid.org/0000-0001-9314-7957

