DOI: 10.11817/j.issn.1672-7207.2018.06.021
јфЗРІЁФЪ¶СКҜМеЦРҙ«ІҘөДПё№ЫКэЦөДЈДв
СоЙР»Ы1, 2Ј¬ВнёХ1, 2Ј¬ЦЬО°1, 2Ј¬іВФ¶1, 2Ј¬іЈПюБЦ1, 2
(1. ОдәәҙуС§ Л®ЧКФҙУлЛ®өз№ӨіМҝЖС§№ъјТЦШөгКөСйКТЈ¬әюұұ ОдәәЈ¬430072Ј»
2. ОдәәҙуС§ Л®№ӨСТКҜБҰС§ҪМУэІҝЦШөгКөСйКТЈ¬әюұұ Одәә 430072)
ХӘТӘЈәІЙУГЛж»ъҝЕБЈІ»Б¬РшұдРО·Ҫ·Ё(SGDD)Ј¬¶Ф¶СКҜМе¶юО¬НдЗъФӘКФСйҪшРРКэЦөДЈДвЈ¬ҙУО»ТЖСЭ»ҜәНЖөУт·ЦОц·ЦОцјфЗРІЁҙ«ІҘМШРФЈ¬ІўНЁ№эУлЛ«ЦбС№ЛхКФСйҪб№ы¶ФұИСЎФсәПАнөДјфЗРІЁҙ«ІҘКұјдИ·¶Ё·Ҫ·ЁЈ¬СРҫҝјӨ·ўЖөВКЎўјӨ·ў·щЦөЎўҝЕБЈҪУҙҘёХ¶ИТФј°О§С№өИТтЛШ¶ФјфЗРІЁЛЩөДУ°ПмЎЈСРҫҝҪб№ыұнГчЈә¶СКҜМе¶ФёЯЖөВКјфЗРІЁРЕәЕҫЯУРГчПФөД№эВЛЧчУГЈ»ЧЫәПұИҪПјёЦЦіЈјы·Ҫ·ЁЈ¬ІЙУГ»ҘПа№Ш·ЁИ·¶ЁјфЗРІЁҙ«ІҘКұјдөД·Ҫ·Ёҫ«И·¶ИЧоёЯЈ»јфЗРІЁЛЩЛжјӨ·ў·щЦөөДФцјУПИјхРЎәуЗчУЪКХБІЈ¬ЛжјӨ·ўЖөВКөДФцјУПИФцҙуәуұЈіЦОИ¶ЁЈ¬ЛжО§С№ЎўҝЕБЈҪУҙҘёХ¶ИөДФцјУ¶шЦрҪҘФцҙуЎЈ
№ШјьҙКЈә¶СКҜМеЈ»јфЗРІЁЛЩЈ»ЖөУт·ЦОцЈ»»ҘПа№Ш·Ё
ЦРНј·ЦАаәЕЈәTV641 ОДПЧұкЦҫВлЈәA ОДХВұаәЕЈә1672-7207(2018)06-1472-09
Mesomechanically numerical simulation of shear wave propagation in rockfill
YANG Shanghui1, 2, MA Gang1, 2, ZHOU Wei1, 2, CHEN Yuan1, 2, CHANG Xiaolin1, 2
(1. State Key Laboratory of Water Resources and Hydropower Engineering Science,Wuhan University, Wuhan 430072, China;
2. Key Laboratory of Rock Mechanics in Hydraulic Structural Engineering,Ministry of Education, Wuhan University, Wuhan 430072, China)
Abstract: The stochastic granular discontinuous deformation (SGDD) method was employed to simulate the bender element test. The characteristics of shear wave propagation were analyzed from two aspects of displacement evolution and frequency domain analysis. Different travel determination methods were compared in a biaxial compression test to determine the most precise method. Based on the selected method, the influences of the excitation frequency, excitation amplitude, inter-particle contact spring stiffness and confining pressure on shear wave velocity were further studied. The results indicate that the granular assembly acts as an obvious filter for the higher frequency components of the input signal. The cross-correlation method is adopted due to its high precision. The shear wave velocity decreases and then tends to converge with the increase of excitation amplitude, increases firstly and then remains stable with the increase of excitation frequency, and increases gradually with the increase of inter-particle contact spring stiffness and confining pressure.
Key words: rockfill; shear wave velocity; frequency domain analysis; cross-relation method
СТНБҝЕБЈІДБПөДРЎУҰұдјфЗРДЈБҝКЗСТНБ№ӨіМЙијЖУл·ЦОцЦРөДЦШТӘБҰС§ІОКэЦ®Т»[1-2]Ј¬ұ»№г·әУҰУГУЪөШХрЎўұ¬ЖЖөИНБ¶ҜБҰОКМвЈ¬ТФј°·ЦОцТ»Р©НБ№ӨҪб№№ОпЧчУГПВөШ»щНБөДҫІБҰұдРОЦРЎЈНБМеөДРЎУҰұдјфЗРДЈБҝҝЙНЁ№эПЦіЎКФСйәНКТДЪКФСйАҙІв¶Ё[3-5]Ј¬°ьАЁПВҝЧ·ЁЎўҝзҝЧ·ЁТФј°ұнГжІЁ·ЁөИЎЈКТДЪКФСйФтТФ№ІХсЦщәННдЗъФӘКФСйОӘЦчЈ¬НЁ№эЦұҪУІв¶ЁНБМеөДјфЗРІЁЛЩ»сөГЎЈЧФSHIRLEYөИ[6]ІЙУГНдЗъФӘ·ЁІвКФКТДЪЦЖұёёЯБлНБКФСщөДјфЗРІЁЛЩәНДЬБҝЛҘјхМШРФЈ¬ХвПоОЮЛрјјКхТтФӯАнГчИ·ЎўІЩЧчјтөҘЎўјЫёсөНБ®өИУЕКЖЈ¬ұ»№г·әУГУЪНБМеРЎУҰұдјфЗРДЈБҝөДІв¶Ё[7-8]ЎЈНдЗъФӘНЁіЈКЗУЙҪфГЬХіҪбөД2Ж¬»т¶аЖ¬С№өзМХҙЙҫ§МеЖ¬ЧйіЙЈ¬КЗТ»ЦЦҝЙНЁ№эС№өзР§УҰәНДжС№өзР§УҰКөПЦ»ъРөДЬәНөзДЬЦ®јдЧӘ»»өД»ъөзҙ«ёРЖч[7]ЎЈҪшРРНБСщјфЗРІЁЛЩІвКФКұЈ¬№М¶ЁФЪЧ°ЦГТ»¶ЛөДНдЗъФӘФӘјюЧчОӘјӨ·ўФӘФЪВціеөзС№ПВІъЙъХс¶ҜЈ¬јӨ·ўіцјфЗРІЁЈ¬№М¶ЁФЪЧ°ЦГБнТ»¶ЛөДНдЗъФӘФӘјюЧчОӘҪУКХФӘҪУКХҫӯНБМеҙ«ІҘ¶шАҙөДјфЗРІЁЈ¬ІўНЁ№эКэҫЭІЙјҜЧ°ЦГҪ«ҪУКХФӘІъЙъөДХс¶ҜЧӘ»ҜОӘөзРЕәЕЈ¬Ҫш¶шУлјӨ·ўФӘөДөзРЕәЕ¶ФұИјҙҝЙјЖЛгіцНБМеөДјфЗРІЁЛЩЎЈНБМеөДјфЗРІЁЛЩУлЦЪ¶аТтЛШГЬЗРПа№ШЈ¬ИзҝЕБЈРОЧҙЎўј¶ЕдЎўҝЧП¶ұИЎўУҰБҰЛ®ЖҪәНУҰБҰАъК·өИ[9-11]ЎЈZENGөИ[12]НЁ№эНдЗъФӘ·ЁІвКФБЛЙ°НБФЪОЮІаПтУҰұдМхјюПВІ»Н¬УҰБҰГжЙПөДРЎУҰұдјфЗРДЈБҝЈ¬МбіцБЛІ»Н¬УҰБҰЧҙМ¬ПВРЎУҰұдјфЗРДЈБҝөДҫӯС鹫КҪЎЈОвәкО°өИ[13]АыУГНдЗъФӘ·ЁСРҫҝБЛУҰБҰЧҙМ¬¶ФЙПәЈФӯЧҙрӨНБРЎУҰұдјфЗРДЈБҝөДУ°ПмЈ¬ІўҪшТ»ІҪҪиЦъҝЧП¶ұИәҜКэҪЁБўЖрУлНБМеУҰБҰЧҙМ¬өД№ШПөұнҙпКҪЎЈРмҪаөИ[14]НЁ№э2ЧйНдЗъФӘКФСйСРҫҝБЛОьБҰәНёЙКӘВ·ҫ¶¶Ф·ЫНБРЎУҰұдјфЗРДЈБҝөДЧчУГЈ¬ІўҪбәПКФСйҪб№ыёДҪшБЛРЎУҰұдјфЗРДЈБҝ°лҫӯС鹫КҪЎЈІЙУГНдЗъФӘјјКхҪшРРөДјфЗРІЁКФСйКұЈ¬ИзәОЧјИ·өШИ·¶ЁјфЗРІЁөДҙ«ІҘКұјдЈ¬Т»ЦұҙжФЪҪПҙуөДХщТйЎЈХвКЗТтОӘҝЕБЈМеПөөДДЪФЪёҙФУРФЎўРЕәЕёЙИЕ(Изҙ®ТфЎўС№ЛхІЁёЙФӨөИ)ТФј°ұҫЙнөДЧй№№ИұПЭ[15-18]Ј¬ҝЙДЬІъЙъ30%~50%өДІвБҝОуІо[17]ЎЈДҝЗ°Ј¬№ъДЪНвС§ХЯАыУГАлЙўФӘ·ЁУлКТДЪКФСйПаҪбәПЈ¬Хл¶ФҝЕБЈІДБПөДІЁ¶ҜОКМвҝӘХ№БЛҙуБҝСРҫҝЈ¬ҝЛ·юБЛОпАнКФСйЦРөДРЕәЕёЙИЕОКМвЈ¬ДЬ№»өГөҪЦКБҝҪПёЯөДјфЗРІЁҪУКХРЕәЕ[18-20]ЎЈРмПюГф өИ[18]Хл¶ФОЮрӨРФҝЕБЈІДБПҪшРРБЛИэЦбКФСйАлЙўФӘДЈДвЈ¬ІўЙиЦГјӨ·ўФҙәНҪУКХФҙКөПЦБЛҝЕБЈІДБПЦРјфЗРІЁҙ«ІҘөДДЈДвЈ¬ПөНі·ЦОцБЛјӨ·ўЖөВКөИЦо¶аТтЛШ¶ФјфЗРІЁЛЩөДУ°ПмЎЈOЎдDONOVANөИ[19]ДЈДвБЛҫщФИФІЕМөДАнПлБщҪЗ¶С»эМеөД¶юО¬НдЗъФӘКФСйЈ¬ұИҪПБЛ4ЦЦјфЗРІЁЛЩөДИ·¶Ё·Ҫ·ЁЈ¬ІўСРҫҝБЛАлЙўФӘДЈРНөДПё№ЫІОКэУлјфЗРІЁЛЩөД№ШПөЎЈNINGөИ[20]¶ФУЙЗтРОҝЕБЈЛж»ъ¶С»э¶шіЙөДФІЦщМеКФСщҪшРРБЛИэО¬НдЗъФӘКФСйКэЦөДЈДвЈ¬ІЙУГҝЕБЈЛЩ¶ИКёБҝіЎөДСЭұдұнКҫІЁҙ«ІҘ№эіМЦРөДҝЕБЈФЛ¶ҜЗйҝцЎЈMAөИ[21-24]МбіцБЛЛж»ъҝЕБЈІ»Б¬РшұдРО·Ҫ·ЁЈ¬ІЙУГЛж»ъДЈДвјјКхІъЙъН№¶аұЯРОҝЕБЈј°ЖдФЪҝХјдЦРөД·ЦІјЈ¬ХжКөДЈДвБЛҝЕБЈРОМ¬Ј¬Ҫ«ҝЕБЈ»®·ЦіЙУРПЮёцөҘФӘЈ¬ФКРнҝЕБЈ·ўЙъұдРОЈ¬ҝЕБЈУлҝЕБЈЦ®јдөДПа»ҘЧчУГБҰНЁ№эРйДвөД·ЁПтәНЗРПтөҜ»ЙәНЧиДбЖчАҙҙ«өЭЎЈұҫОДЧчХЯ»щУЪЛж»ъҝЕБЈІ»Б¬РшұдРО·Ҫ·ЁҙУ¶СКҜМеҝЕБЈО»ТЖСЭ»ҜТФј°ЖөУт·ЦОц·ҪГжСРҫҝБЛјфЗРІЁҙ«ІҘМШРФЈ»ІЙУГ3ЦЦ·Ҫ·ЁИ·¶ЁјфЗРІЁЛЩІўУлЛ«ЦбС№ЛхКФСйҪб№ыҪшРРұИҪПЈ¬ҙУ¶шөГөҪҪПУЕөДјфЗРІЁҙ«ІҘКұјдИ·¶Ё·Ҫ·ЁЈ»ПөНіөШ·ЦОцјӨ·ўЖөВКЎўјӨ·ў·щЦөЎўҝЕБЈҪУҙҘёХ¶ИТФј°О§С№¶ФјфЗРІЁЛЩөДУ°ПмЎЈ
1 НдЗъФӘКэЦөКФСй
1.1 КэЦөКФСщ
ЙъіЙ¶юО¬¶аұЯРОҝЕБЈј°ЖдФЪҝХјдЦРөД·ЦІјЈ¬ФЩС№ЛхіЙЦё¶ЁіЯҙзөДКФСщЈ¬КФСщј¶ЕдЗъПЯИзНј1ЛщКҫЈ¬ҝЧП¶ВКОӘ0.135ЎЈКФСщіӨЎБҝнОӘ12 mЎБ6 mЈ¬ЧоҙуБЈҫ¶dmaxОӘ80 mmЈ¬dmax/dmin=4(ЖдЦРЈ¬dminОӘЧоРЎБЈҫ¶)ЎЈ¶ЁТеҝЕБЈөДНвҪУНЦФІөДіӨ¶Мҫ¶Ц®ұИОӘҝЕБЈөДРОЧҙЦёұкЈ¬іӨ¶Мҫ¶ұИФЪ1.4~1.6Ц®јдіКҫщФИ·ЦІјЎЈКФСщЦР№ІЙъіЙ10 217ёцҝЕБЈЈ¬ІЙУГ¶юҪЧЛДұЯРОөҘФӘАлЙўөГөҪ64 838ёцөҘФӘәН243 520ёцҪЪөгЎЈОӘБЛДЈДвКТДЪНдЗъФӘјфЗРІЁЛЩІвКФЧ°ЦГЈ¬КФСщЙППВ¶ЛОӘёХРФ°еЈ¬ЛДЦЬУГПрҪәДЈ°ь№ьЧЎЈ¬ПрҪәДЈЙППВ¶ЛУлёХРФ°е·ЦАлЈ¬О§С№К©јУФЪПрҪәДЈЙПЎЈПрҪәДЈөДәс¶ИИЎ2 mmЈ¬ІЙУГі¬өҜРФДӨөҘФӘДЈДвПрҪәДЈЎЈ

Нј1 КэЦөКФСщј¶ЕдЗъПЯНј
Fig. 1 Particle size distribution of numerical sample
1.2 јфЗРІЁІъЙъУлҙ«ІҘ
УЙУЪХэПТІЁККУГНБСщ·¶О§ҪП№гЈ¬¶ш·ҪІЁҪцККУГУЪёХ¶ИҪПРЎөДНБСщ[15]Ј¬ұҫОДІЙУГХэПТІЁЧчОӘјӨ·ўРЕәЕЎЈФЪКФСщ¶ҘІҝСЎИЎЦұҫ¶ОӘ0.75 mЎўәс¶ИОӘ0.20 mөДұЎІгҝЕБЈЧчОӘјӨ·ўФҙЈ¬К©јУЛ®ЖҪ·ҪПтөҘЦЬЖЪХэПТО»ТЖІъЙъјфЗРІЁЈ¬УлУЙөҘёцҝЕБЈЧчОӘјӨ·ўФҙПаұИЈ¬ұЎІгІЁФҙДЬ№»УРР§өШјхЙЩОпАнКФСйЦРУЙС№ЛхІЁәНјфЗРІЁПа»ҘсоәПРОіЙөДҪьіЎР§УҰөДёЙИЕ[15, 20]ЎЈН¬КұЈ¬СШКФСщЦбПЯСЎИЎ3ёцҝЕБЈ(R1Ј¬R2Ј¬R3)ЧчОӘҪУКХФҙЈ¬ҫаАлКФСщ¶ҘІҝөДҫаАл·ЦұрОӘ6Ј¬9әН12 mЈ¬ІўКдіцҝЕБЈО»ТЖКұіМЗъПЯЈ¬ҝЕБЈО»ТЖИЎҝЕБЈЙПЛщУРҪЪөгО»ТЖөДЖҪҫщЦөЎЈКэЦөКФСщИзНј2ЛщКҫЈ¬ДЈРНЦчТӘјЖЛгІОКэИзұн1ЛщКҫЈ¬ЛщСЎІОКэҝЙТФұЈЦӨ»щұҫПыіэГЦЙўМШРФ(ҰЛ/d50ЎЭ10Ј¬ҰЛОӘІЁіӨЈ»d50ОӘҝЕБЈЖҪҫщБЈҫ¶)УлҪьіЎР§УҰөДУ°Пм(L/ҰЛЈҫ2Ј¬LОӘҙ«ІҘҫаАл)[25-26]ЎЈ
КэЦөДЈДвҝӘКјКұЈ¬ПИ¶ФКФСщК©јУО§С№ҪшРРөИПт№МҪбЈ¬№МҪбНкіЙәу¶ФКФСщҪшРРИ«ФјКшјМРшФЛРРТ»¶ЁКұІҪЈ¬К№өГҝЕБЈЛЩ¶ИУлјӨ·ў·щЦөПаұИЧг№»РЎЈ¬КөПЦЎ°іэФлЎұЎЈөұКФСщЦРҝЕБЈЗчУЪЖҪәвЈ¬¶ФұЎІгјӨ·ўФҙҝЕБЈК©јУЛ®ЖҪ·ҪПтөҘЦЬЖЪХэПТО»ТЖІъЙъјфЗРІЁЈ¬ІаПтұЎДӨК©јУәг¶ЁО§С№Ј¬Н¬КұјаІвҪУКХФҙҝЕБЈЛ®ЖҪ·ҪО»ТЖәНКъЦұПтЧшұкЛжКұјдұд»Ҝ¶ҜМ¬ЎЈ
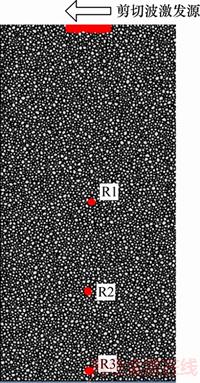
Нј2 КэЦөКФСщ
Fig. 2 Numerical sample
ұн1 јЖЛгІОКэ
Table 1 Parameters for calculation

2 КэЦөДЈДвҪб№ыј°·ЦОц
2.1 О»ТЖСЭ»Ҝ
Нј3ЛщКҫОӘКұјдtОӘ0әН2T(TОӘК©јУөДХэПТО»ТЖөДЦЬЖЪ)КұҝМ¶СКҜМеҝЕБЈЛ®ЖҪ·ҪПтО»ТЖФЖНјЎЈҙУНј3ҝЙТФҝҙіцЈәФЪіхКјКұҝМЈ¬ҪцұЎІгҝЕБЈІъЙъО»ТЖЈ¬ЛжЧЕКұјдөДНЖҪшЈ¬ұЎІгҝЕБЈөДФЛ¶ҜПтПВҙ«өЭЈ¬ЗТФЛ¶Ҝ·щ¶ИЦрҪҘҪөјхИхЈ¬ПФКҫБЛІЁФЪ¶СКҜМеЦРөДҙ«ІҘ№эіМЎЈ

Нј3 І»Н¬КұҝМ¶СКҜМеҝЕБЈО»ТЖФЖНј
Fig. 3 Contours of particle displacement for different time
Нј4ЛщКҫОӘКэЦөКФСщЦРјӨ·ўФҙУлҪУКХФҙҝЕБЈЛ®ЖҪ·ҪПтО»ТЖКұіМЗъПЯЈ¬ЖдЦРЈ¬SҙъұнјӨ·ўФҙҝЕБЈЈ¬R1Ј¬R2әНR3ҙъұнҪУКХФҙҝЕБЈЎЈҙУНј4ҝЙТФҝҙіцЈәҪУКХФҙҝЕБЈ°ҙХХҫаАлІЁФҙөДФ¶ҪьТАҙОЧціцПмУҰЈ¬ЗТІЁ¶Ҝ·щ¶ИЦрҪҘЛҘјхЈ»ҪУКХФҙҝЕБЈR1іхКјіцПЦУлјӨ·ўФҙПаО»Па·ҙөДО»ТЖЈ¬ХвКЗУЙУЪҪьіЎР§УҰС№ЛхІЁ(PІЁ)ҙ«ІҘЛЩ¶ИҙуУЪјфЗРІЁ(SІЁ)ЛЩ¶ИЈ¬ПИЖЪөҪҙпЈ»ЛжЧЕҙ«ІҘҫаАлөДФцјУЈ¬ҪьіЎР§УҰјхИхЈ¬R2әНR3ҝЕБЈіхКј·ҙПаО»О»ТЖПЦПуЦрҪҘПыК§ЎЈ¶ФУЪөҘёцҪУКХФҙҝЕБЈ¶шСФЈ¬ФЛ¶ҜҫӯАъБЛіхЖЪЛҘјхЛжәуФЪ0.04~0.05 sјдФЩҙОФцЗҝөД№эіМЈ¬ХвКЗУЙөЧІҝёХРФ°еұЯҪзөД·ҙЙдФміЙөДЎЈЧЫәПҝјВЗјфЗРІЁҙ«ІҘ№эіМЦРөДҪьіЎР§УҰТФј°УЙУЪЧиДбөИТтЛШТэЖрөДХс·щЛҘјхЛщФміЙөДУ°ПмЈ¬СЎИЎҪУКХФҙҝЕБЈR1О»ТЖЛжКұјдұд»ҜЗъПЯЧчОӘИ·¶ЁјфЗРІЁЛЩөДТАҫЭЎЈ
2.2 ЖөУт·ЦОц
ЖөУт·ЦОц·Ҫ·ЁУЦұ»іЖОӘҝмЛЩёөАпТ¶ұд»»(fast Fourier transform, FFT)·ЦОц·ЁЈ¬НЁ№э¶Ф»сИЎөДІЁРЕәЕКэҫЭҪшРРҝмЛЩёөАпТ¶ұд»»Ј¬Ҫ«КұУтРЕәЕЧӘұдОӘЖөУтРЕәЕЈ¬Іў¶ФЖдКұУтәНЖөУтМШРФҪшРР·ЦОцЎЈОӘБЛёьјУҫ«И·өШұИҪП·ўЙдРЕәЕәНҪУКХРЕәЕөДёчЖөВКЧй·ЦЈ¬·Цұр¶ФЖдҪшРРҝмЛЩёөАпТ¶ұд»»Ј¬УЙУЪҪУКХРЕәЕХс·щЛҘјхГчПФЈ¬Ул·ўЙдРЕәЕПаІоҪПҙуЈ¬І»ұгУЪұИҪПЈ¬ТтҙЛЈ¬Ҫ«ҪУКХРЕәЕХс·щА©ҙу20ұ¶Ј¬Ҫб№ыИзНј5ЛщКҫЎЈ
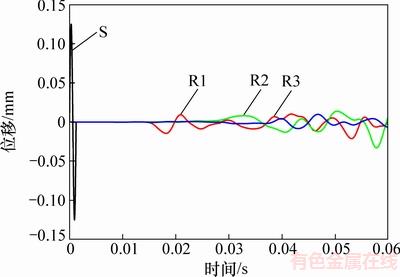
Нј4 КдИлҪУКХРЕәЕІЁРОНј
Fig. 4 Signals transmitted and received by bender element

Нј5 0.8 kHz·ўЙдРЕәЕУлҪУКХРЕәЕЖөУт¶ФұИ
Fig. 5 Comparison between input signals and received signals in frequency domain for 0.8 kHz
УЙНј5ҝЙЦӘЈә¶СКҜМеҝЕБЈ¶ФёЯЖөВКјфЗРІЁРЕәЕҫЯУРГчПФөД№эВЛЧчУГЎЈ¶ФУЪ·ўЙдРЕәЕ¶шСФЈ¬өҘЦЬЖЪХэПТІЁҫЯУРҪПҝнөДЖөВК·¶О§Ј¬ЧоёЯЖөВКҙпөҪ1.6 kHzёҪҪьЈ¬·еЦөХс·щ¶ФУҰөДЖөВКОӘ0.8 kHzЈ¬¶шҪУКХРЕәЕЛщ°ьә¬өДЖөВК·¶О§ҪПХӯЈ¬ЦчТӘјҜЦРФЪ1 kHzТФПВЈ¬ЧоёЯЖөВКҙуФјФЪ1.1 kHzёҪҪьЈ»өұЖөВКҙуУЪ0.5 kHzКұЈ¬Хс·щСёЛЩЛҘјхЈ¬·еЦөХс·щ¶ФУҰ3ЧйЖөВК·ЦұрОӘ0.12Ј¬0.15әН0.18 kHZЎЈёДұд·ўЙдРЕәЕөДЖөВКЈ¬·ЦұрҪшРРХэПТО»ТЖЖөВКОӘ0.4Ј¬0.6әН1 kHzөДКэЦөКФСйЈ¬Іў¶Ф·ўЙдРЕәЕәНҪУКХРЕәЕҪшРРҝмЛЩёөАпТ¶ұд»»Ј¬Ҫб№ыИзНј6ЛщКҫЎЈ
УЙНј5әННј6ҝЙЦӘЈәЛжЧЕ·ўЙдРЕәЕЖөВКөДФцјУЈ¬ЖдЛщ°ьә¬өДЖөВК·¶О§ТІЛжЦ®ФцҙуЈ¬·еЦөХс·щ¶ФУҰөДЖөВК·ЦұрОӘ0.4Ј¬0.6әН1.0 kHzЈ¬¶шҪУКХРЕәЕөДЖөВК·¶О§Ул·ўЙдРЕәЕөДЖөВКОЮ№ШЈ¬ЦчТӘјҜЦРФЪ1.0 kHzТФПВІҝ·ЦЈ¬ІўЗТөұҪУКХРЕәЕөДЖөВКҙуУЪ0.5 kHzКұЈ¬Жд¶ФУҰөДХс·щҪ«СёЛЩјхРЎЎЈ¶ЁТеО»ТЖХс·щЗчУЪ0 mmКұ¶ФУҰөДЖөВКОӘ¶СКҜМеХс·щЛҘјхөДБЩҪзЖөВКЈ¬јЖЛгөГөҪІ»Н¬·ўЙдРЕәЕЖөВКПВХс·щЛҘјхөДБЩҪзЖөВКөД·ҪІоОӘ3.2ЎБ10-5Ј¬ЛөГчЖдЛж·ўЙдРЕәЕЖөВКұд»ҜІ»ГчПФЈ¬ЦӨГчБЩҪзЖөВККЗУлКФСйІОКэОЮ№ШөД¶СКҜМеЧФЙнөДМШРФІОКэЎЈ
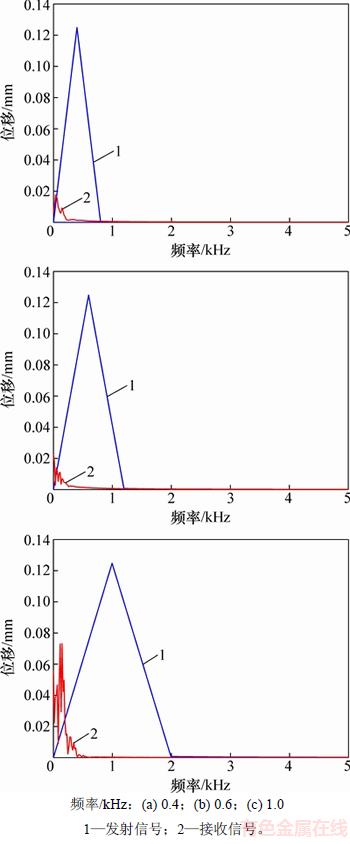
Нј6 ·ўЙдРЕәЕУлҪУКХРЕәЕЖөУт¶ФұИ
Fig. 6 Comparison between input signals and received signals in frequency domain for different input signals
3 јфЗРІЁҙ«ІҘКұјдөДИ·¶Ё
јфЗРІЁЛЩУЙ·ўЙдФҙәНјӨ·ўФҙөДҫаАләНјфЗРІЁөДҙ«өЭКұјдАҙИ·¶ЁЈ¬ДҝЗ°УР2АаИ·¶ЁјфЗРІЁҙ«ІҘКұјдөД·Ҫ·ЁЈәЦұҪУИ·¶Ё·ЁәНјЖЛг·ЦОц·ЁЎЈЦұҪУИ·¶Ё·ЁёщҫЭКдИлІЁРОәНКдіцІЁРОөДМШХчөгИ·¶Ёҙ«ІҘКұјдЈ¬іЈјыөДУРіхҙпІЁ·Ё(S-S·Ё)әН·еЦө-·еЦө·Ё(P-P·Ё)Ј¬јЖЛг·ЁНЁ№э»ҘПа№Ш·ЦОцИ·¶Ёҙ«ІҘКұјдЎЈ·ЦұрёщҫЭS-S·ЁЎўP-P·ЁәН»ҘПа№Ш·ЦОц·ЁұЎІгҝЕБЈSәНR1ҪУКХФҙҝЕБЈО»ТЖІЁРОЗъПЯ(јыНј7)И·¶ЁҝЕБЈМеөДјфЗРІЁЛЩЈ¬ІўУлЛ«ЦбС№ЛхКФСйҪб№ыҪшРР¶ФұИЈ¬ҙУ¶шСЎФсіцҪПУЕөДјфЗРІЁҙ«ІҘКұјдИ·¶Ё·Ҫ·ЁЎЈ

Нј7 јфЗРІЁҙ«ІҘКұјдөДИ·¶Ё
Fig. 7 Determination of travel time of shear wave
3.1 іхҙпІЁ·Ё(S-S·Ё)
іхҙпІЁ·ЁАыУГјфЗРІЁөДКЧҙОөҪҙпАҙИ·¶Ёҙ«өЭКұјдЈ¬НЁіЈКЗТФҪУКХРЕәЕөДКЧёцЖ«ЧӘөгЧчОӘјфЗРІЁөДөҪҙпО»ЦГЎЈ·ўЙдНдЗъФӘФЪјӨ·ўјфЗРІЁөДН¬КұТІІъЙъС№ЛхІЁЈ¬УЙУЪС№ЛхІЁФЪНБМеЦРөДҙ«ІҘЛЩ¶ИұИјфЗРІЁөДҙуЈ¬Ҫ«»бТэЖрҪУКХРЕәЕІъЙъіхКјО»ТЖ¶шЛжәуөҪҙпөДјфЗРІЁҪ«»бёДұдІЁРЕәЕөД·ҪПтЈ¬ТтҙЛЈ¬Ҫ«AЎдөгКУОӘјфЗРІЁөҪҙпҪУКХФҙҝЕБЈR1өДіхКјО»ЦГЈ¬¶ФУҰөДКұјдОӘ18.288 msЈ¬ҙЛКұҝЕБЈУлұЎІгөЧІҝөДҫаАлОӘ5.780 63 mЈ¬јЖЛгөГөҪјфЗРІЁЛЩОӘ316.09 m/sЎЈ
3.2 МШХчөг·Ё(P-P·Ё)
МШХчөг·Ё·ЦұрСЎИЎ·ўЙдРЕәЕәНҪУКХРЕәЕөДКЧёц·еЦөөгЈ¬НЁ№э·еЦөөгјдөДКұјдәНО»ТЖІоАҙјЖЛгјфЗРІЁЛЩЈ¬УЙНј7ҝЙЦӘЈәҪУКХФҙҝЕБЈR1О»ТЖІЁРОөДөЪ1·еЦөBЎд¶ФУҰөДКұјдОӘ20.603 msЈ¬ҙЛКұҝЕБЈУлұЎІгөЧІҝөДҫаАлОӘ5.780 59 mЈ¬јЖЛгөГөҪјфЗРІЁЛЩОӘ280.57 m/sЎЈУліхҙпІЁ·ЁПаұИЈ¬МШХчөг·ЁЦРҪУКХРЕәЕөД·еЦөөгУЙУЪІ»КЬФлТфёЙИЕДЬ№»ұ»ЗеіюК¶ұрЈ¬ө«¶ФСЎФсКЧёц·еЦөөг»№КЗЧоҙу·еЦөөгОКМвИФҙжФЪТ»¶ЁХщТй[27]ЎЈ
3.3 »ҘПа№Ш·Ё
іхҙпІЁ·ЁәНМШХчөг·ЁЦРҫщРиТӘИЛОӘЕР¶ПјфЗРІЁөҪҙпәНҙ«ІҘКұјдЈ¬ҫЯУРТ»¶ЁөДЦч№ЫРФЈ¬¶ш»ҘПа№Ш·ЁКЗТ»ЦЦКэС§·Ҫ·ЁЈ¬НЁ№э»ҘПа№ШәҜКэјҙCXYАҙәвБҝ2ёцРЕәЕЦ®јдөДПа№ШРФЈ¬ЖдКэС§ұнҙпКҪОӘ
 (2)
(2)
КҪЦРЈәT1ОӘРЕәЕЧЬІвКФКұјдЈ»ҰООӘ2ёцРЕәЕЦ®јдөДКұјдІоЎЈ
¶Ф·ўЙдРЕәЕәНҪУКХРЕәЕҪшРРҝмЛЩёөАпТ¶ұд»»өГөҪИзНј8ЛщКҫөД»ҘПа№ШәҜКэЈ¬ИЎCXYЧоҙуЦө¶ФУҰөДКұјдtcЧчОӘјфЗРІЁөДҙ«ІҘКұјдЈ¬өГөҪtc=19.015 msЈ¬јЖЛгөГөҪјфЗРІЁЛЩОӘ299.91 m/sЎЈ

Нј8 »ҘПа№Ш·ЁИ·¶ЁјфЗРІЁөҪҙпКұјд
Fig. 8 Determination of arrive time using cross-correlation method
3.4 јфЗРІЁЛЩ¶ФұИ
ҪшРРЛ«ЦбС№ЛхКФСйөГөҪРЎУҰұдјфЗРДЈБҝGmaxЈ¬ІўҪшТ»ІҪёщҫЭ (ЖдЦРЈ¬ҰСОӘҝЕБЈГЬ¶ИЈ»vsОӘјфЗРІЁЛЩ)Ј¬јЖЛгјфЗРІЁЛЩvsЧчОӘІОХХЎЈЛ«ЦбС№ЛхКФСйУлНдЗъФӘКФСйІЙУГПаН¬өДұЯҪзМхјюЈ¬ҫщұЈіЦәг¶ЁО§С№Ј¬ІўҪ«¶ҘІҝёХРФ°е°ҙХХ1 kHzЖөВКК©јУ6ј¶НщёҙәЙФШЈ¬ёщҫЭУЙ6ёцСӯ»·әЙФШј¶өДЦбПт¶ҜУҰБҰ·щЦөҰТdәНЦбПт¶ҜУҰұд·щЦөҰЕd»жЦЖөДҰТd-ҰЕdЗъПЯөДіхКјРұВКјЖЛгөГөҪКэЦөКФСщөД¶ҜөҜРФДЈБҝEmax=448.38 MPaЈ¬ёщҫЭ№«КҪGmax=Emax/2(1+v)ЧоЦХөГөҪvsөДІОҝјЦөОӘ292.93 m/sЎЈ
Ҫ«3ЦЦ·Ҫ·ЁјЖЛгөГөҪөДјфЗРІЁЛЩУлЛ«ЦбС№ЛхКФСйІОҝјЦөҪшРРұИҪПЈ¬Изұн2ЛщКҫЎЈҙУұн2ҝЙТФҝҙіцЈәІЙУГ»ҘПа№Ш·ЁјЖЛгөГөҪөДјфЗРІЁЛЩУлЛ«ЦбКФСйҪб№ыЧоҪУҪьЈ¬ЛөГч»щУЪЛж»ъҝЕБЈІ»Б¬РшұдРОSGDD·Ҫ·ЁөД¶СКҜМе¶юО¬НдЗъФӘКФСйөДКэЦөДЈДвЦРЈ¬ІЙУГ»ҘПа№Ш·ЁИ·¶ЁөДјфЗРІЁҙ«ІҘКұјдҫ«И·¶ИЧоёЯЈ¬УлAHNөИ[28]»щУЪАлЙўФӘ·Ҫ·ЁөГөҪөДҪбВЫПаТ»ЦВЈ¬ТтҙЛЈ¬ұҫОДСЎФс»ҘПа№Ш·ЦОцЧчОӘјЖЛгјфЗРІЁҙ«ІҘКұјдөД·Ҫ·ЁЎЈ
ұн2 І»Н¬јЖЛг·Ҫ·ЁјфЗРІЁЛЩ¶ФұИ
Table 2 Comparison of values of vs calculated by different methods

4 јфЗРІЁҙ«ІҘУ°ПмТтЛШ·ЦОц
¶СКҜМеЦРјфЗРІЁөДҙ«ІҘКЬЦо¶аТтЛШөДУ°ПмЈ¬ЦчТӘ°ьАЁјӨ·ў·щЦөЎўјӨ·ўЖөВКЎўО§С№ТФј°Пё№ЫІгҙОЙПөДҝЕБЈјдҪУҙҘёХ¶ИЎЈ
4.1 јӨ·ў·щЦө
УЙУЪ¶СКҜМеөДјфЗРёХ¶ИКЗЛжУҰұдЛ®ЖҪұд»ҜөДәҜКэЈ¬ТтҙЛјфЗРІЁЛЩФЪІ»Н¬өДУҰұдЛ®ЖҪПВУРЛщІ»Н¬ЎЈНдЗъФӘКФСйЦРКФСщІъЙъөДјфЗРУҰұдФтКЗНЁ№эјӨ·ў·щЦөАҙҝШЦЖЎЈ·ЦұрҪшРРA/d50=1ЎБ10-6~1ЎБ10-2(ЖдЦРЈ¬AҙъұнјӨ·ў·щЦө)өД6ЧйЖҪРРКФСйЈ¬јЖЛгөГөҪ6ЦЦЗйҝцПВөДјфЗРІЁЛЩИзНј9ЛщКҫЈ¬Н¬КұМбИЎіцјфЗРІЁҙ«ІҘ№эіМЦРҪУҙҘК§Р§ВКЛжКұјдұд»ҜЗъПЯИзНј10ЛщКҫЎЈУЙНј9ҝЙЦӘЈәЛжЧЕA/d50јхЙЩЈ¬јфЗРІЁЛЩВФУРФцјУЈ¬өұјӨ·ў·щЦөРЎУЪ10-3КұЈ¬јфЗРІЁЛЩЗчУЪКХБІЈ¬»щұҫОИ¶ЁЎЈ¶ФУҰНј10ЦРөДҪУҙҘК§Р§ВКұд»ҜЗъПЯЈ¬өұA/d50РЎУЪ10-3КұЈ¬ҝЕБЈҪУҙҘК§Р§ВКөДұд»ҜЗъПЯҪьЛЖЦШәПЈ¬¶шөұA/d50ҙуУЪ10-3КұЈ¬ҪУҙҘК§Р§ВКЗъПЯЙПЙэЈ¬¶ФУҰөДјфЗРІЁЛЩВФУРҪөөНЎЈ

Нј9 јӨ·ў·щЦө¶ФјфЗРІЁЛЩөДУ°Пм
Fig. 9 Influence of excitation amplitude on shear wave velocity
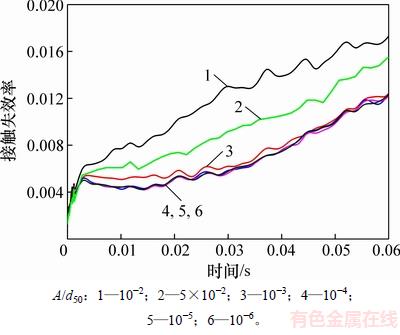
Нј10 І»Н¬јӨ·ў·щЦөПВҪУҙҘК§Р§ВК
Fig. 10 Percentage of sliding contacts for different excitation amplitudes
4.2 јӨ·ўЖөВК
Нј11ЛщКҫОӘјӨ·ўЖөВК·ЦұрОӘ0.4Ј¬0.6Ј¬0.8әН1.0 kHzКұҪУКХФҙҝЕБЈR1КдіцөДО»ТЖІЁРОНјЎЈҙУНј11ҝЙТФҝҙіцЈәөұјӨ·ўЖөВКРЎУЪ0.6 kHzКұЈ¬ҪУКХФҙҝЕБЈөДО»ТЖІЁРОҪПОўИхЈ»өұјӨ·ўЖөВКҙпөҪ0.8 kHzәуЈ¬РЕәЕЗҝ¶ИФцЗҝІўЗТІЁРОПаЛЖЈ¬ө«1.0 kHzПВІЁРОХс·щВФУРПВҪөЈ¬јҙөұјӨ·ўЖөВКОӘ0.8 kHzКұЈ¬ҪУКХРЕәЕХс·щҙпөҪ·еЦөЈ¬¶ФУҰ¶СКҜМеҝЕБЈТФЧоҙуХс·щЧцХс¶ҜЎЈУЦУЙНј5әННј6ҝЙЦӘЈәҪУКХРЕәЕ°ьә¬өДЖөВКЦчТӘјҜЦРФЪ0.8 kHzТФПВЈ¬ТтҙЛЈ¬ҝЙҪьЛЖИПОӘ0.8 kHzОӘ¶СКҜМеөД№ІХсЖөВКЎЈБнНвЈ¬ҙУНј11»№ҝЙТФЦұҪУ№ЫІмөҪІ»Н¬ЖөВКПВјфЗРІЁөДіхҙпКұјдЈ¬ҙУ¶шИ·¶ЁјфЗРІЁЛЩЈ¬ҪшТ»ІҪөГіцөұјӨ·ўЖөВКҙУ0.4 kHzФцјУөҪ0.8 kHzКұЈ¬јфЗРІЁЛЩВФУРФцҙуЈ»өұјӨ·ўЖөВКҙпөҪ№ІХсЖөВКәуЈ¬јфЗРІЁЛЩҪ«ұЈіЦОИ¶ЁЎЈ
¶СКҜМеөДЗҝ¶ИІҝ·ЦАҙФҙУЪ¶СКҜМеҝЕБЈјдДҰІБөДјӨАшЈ¬ОӘСРҫҝ¶СКҜМеҝЕБЈҪУҙҘҙҰөДДҰІБМШРФЈ¬¶ЁТе¶СКҜМеҝЕБЈДҰІБјӨАшЦёұкОӘ (ЖдЦРЈ¬ftәНfn·ЦұрұнКҫ¶СКҜМеҝЕБЈјдЗРПтҪУҙҘБҰәН·ЁПтҪУҙҘБҰ)ЎЈНј12ЛщКҫОӘІ»Н¬јӨ·ўЖөВКПВ¶СКҜМеЖҪҫщДҰІБјӨАшЦёұкImөДСЭ»ҜЗъПЯ(ImОӘПаУҰ»э·Цөг¶ФУҰөД¶СКҜМеЦРЛщУРҪУҙҘҙҰөДЖҪҫщДҰІБјӨАш)ЎЈҙУНј12ҝЙТФҝҙіцЈ¬іхКјҪЧ¶О0.4 kHzәН0.6 kHzјӨ·ўЖөВКПВ¶СКҜМеөДДҰІБјӨАшПөКэСЭ»ҜЗъПЯО»УЪ0.8 kHzәН1 kHzЗъПЯПВ·ҪЈ¬өұјӨ·ўЖөВКҙуУЪ0.8 kHzКұЈ¬ЗъПЯҪьЛЖЦШәПЈ¬¶ФУҰНј11ЦРөұјӨ·ўЖөВКРЎУЪ№ІХсЖөВККұЈ¬¶СКҜМеПмУҰҪПОўИхЈ¬өұјӨ·ўЖөВКҙпөҪ№ІХсЖөВКәуЈ¬ПмУҰФцЗҝІўЗТІЁРОПаЛЖЎЈН¬КұЈ¬ЛжЧЕІЁөДҙ«ІҘЈ¬І»Н¬јӨ·ўЖөВКПВ¶СКҜМеөДДҰІБјӨАшПөКэЧоЦХОИ¶ЁФЪН¬Т»КэЦөёҪҪьЈ¬¶ФУҰ¶СКҜМеөДјфЗРІЁЛЩЛжјӨ·ўЖөВКІЁ¶ҜҪПРЎЈ¬ОИ¶ЁФЪ1ёц¶ЁЦөёҪҪьЎЈ
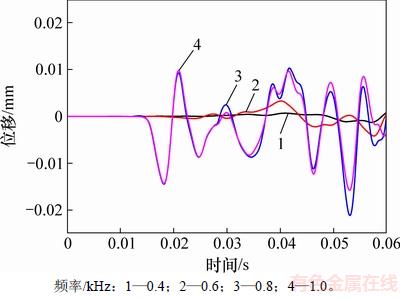
Нј11 І»Н¬јӨ·ўЖөВКПВҪУКХІЁРО
Fig. 11 Waveform of a receiver in the time domain,excited by different frequencies
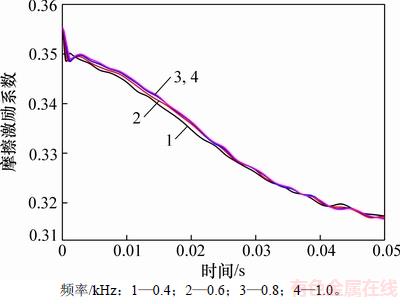
Нј12 І»Н¬јӨ·ўЖөВКПВДҰІБјӨАшПөКэСЭ»Ҝ№эіМ
Fig. 12 Evolution of friction incentive index, excited by different frequencies
4.3 О§С№
¶СКҜМеөДУҰБҰЧҙМ¬НЁ№эУ°Пм¶СКҜМеҝЕБЈјдөДёХ¶ИҙУ¶шК№јфЗРІЁЛЩ·ўЙъёДұдЈ¬·ЦұрјЖЛг¶СКҜМеҝЕБЈФЪ0.4Ј¬0.5Ј¬0.6Ј¬0.8әН1.0 MPaО§С№№МҪбПВөДјфЗРІЁЛЩЈ¬Ҫб№ыИзНј13ЛщКҫЎЈҙУНј13ҝЙТФҝҙіцЈәЛжЧЕО§С№өДФцјУЈ¬јфЗРІЁЛЩЦрҪҘФцҙуЈ¬ЗТөНО§С№ПВөДФцјУЛЩ¶ИВФҙуУЪёЯО§С№ПВөДФцјУЛЩ¶ИЈ¬јҙЛжЧЕМеПөС№ЗҝөДФцҙуЈ¬ҝЕБЈЦ®јдөДҪУҙҘёьјУҪфГЬЈ¬¶ФУҰөДЖҪҫщҪУҙҘКэФцјУЈ¬ҝЕБЈМеПөДЪІҝҪб№№ёьІ»ИЭТЧ·ўЙъөчХыЈ¬ПаУҰөДјфЗРІЁЛЩФцјУЛЩ¶ИҪөөНЎЈХвУлРмРЎГфөИ[18]өГөҪөДјфЗРІЁЛЩЛжО§С№ұд»ҜөД»щұҫ№жВЙТ»ЦВЈ¬ө«јфЗРІЁЛЩФціӨЛЩ¶ИөДұд»ҜИФҙжФЪІоТмЈ¬ФміЙөДФӯТтҝЙДЬКЗ¶С»э·ҪКҪТФј°МоідВКІ»Н¬ЎЈ
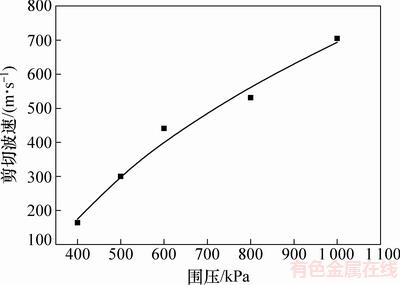
Нј13 О§С№¶ФјфЗРІЁЛЩөДУ°Пм
Fig. 13 Influence of confining pressure on shear wave velocity
4.4 ҝЕБЈҪУҙҘёХ¶И
¶СКҜМеөДПё№ЫКэЦөКФСйІЙУГ»щУЪ·ЈәҜКэөДПЯРФҪУҙҘДЈРНЈ¬јҙНЁ№э·ЁПтәНЗРПтөҜ»ЙАҙҙ«өЭ¶СКҜМеҝЕБЈјдөД·ЁПтәНЗРПтПа»ҘЧчУГБҰЈ¬ТтҙЛЈ¬РиТӘ¶СКҜМеҝЕБЈјдҪУҙҘёХ¶ИЧчОӘПё№ЫІОКэЎЈ¶шФЪёГҪУҙҘДЈРНЦРЈ¬ҪУҙҘёХ¶ИІўГ»УРГчИ·өДОпАнТвТеЈ¬ТІәЬДСНЁ№эіЈ№жКФСй»сИЎЈ¬ТтҙЛЈ¬ұҫОДјЖЛг¶СКҜМеөД·ЁПтҪУҙҘёХ¶ИKn·ЦұрИЎЦө1ЎБ105Ј¬5ЎБ105Ј¬1ЎБ106Ј¬5ЎБ106әН1ЎБ107 kN/m3КұөДјфЗРІЁЛЩЈ¬¶ФЖдҪшРРГфёРРФ·ЦОцЈ¬ИзНј14ЛщКҫЎЈУЙНј14ҝЙЦӘЈәјфЗРІЁЛЩЛж·ЁПтҪУҙҘёХ¶ИөДФцҙу¶шФцјУЈ¬ІўУл·ЁПтҪУҙҘёХ¶ИөДҝӘ·ҪҪьЛЖіЙЦұПЯ№ШПөЎЈDONOVANөИ[19]ІЙУГАлЙўФӘ·ЁДЈДв¶юО¬НдЗъФӘКФСйТІөГөҪБЛПаЛЖөДјфЗРІЁЛЩУлҝЕБЈҪУҙҘёХ¶ИЦ®јдөД№ШПөЎЈ
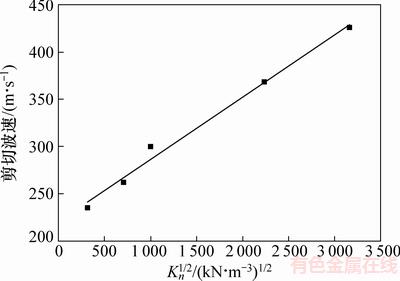
Нј14 ҝЕБЈҪУҙҘёХ¶И¶ФјфЗРІЁЛЩөДУ°Пм
Fig. 14 Influence of inter-particle contact spring stiffness on shear wave velocity
5 ҪбВЫ
1) ¶СКҜМеҝЕБЈ¶ФёЯЖөВКөДјфЗРІЁРЕәЕҫЯУР№эВЛЧчУГЈ¬ҪУКХРЕәЕПа¶ФУЪ·ўЙдРЕәЕ¶шСФ°ьә¬өДЖөВК·¶О§ұдХӯЈ¬ЦчТӘјҜЦРФЪ1 kHzТФПВЈ¬ІўЗТХс·щЛҘјхөДБЩҪзЖөВККЗУлКФСйІОКэОЮ№ШөД¶СКҜМеЧФЙнөДМШРФІОКэЎЈ
2) УліхҙпІЁ·ЁәНМШХчөг·ЁПаұИЈ¬»ҘПа№Ш·ЁјЖЛгөГөҪөДјфЗРІЁЛЩУлЛ«ЦбС№ЛхКФСйҪб№ыЧоҪУҪьЈ¬ҪшТ»ІҪСйЦӨБЛҪ«ЖдЧчОӘИ·¶ЁјфЗРІЁҙ«ІҘКұјд·Ҫ·ЁөДәПАнРФЎЈ
3) ¶СКҜМеҝЕБЈЦРјфЗРІЁөДҙ«ІҘКЬЦо¶аТтЛШөДУ°ПмЈ¬ЖдЦРЈ¬ЛжЧЕјӨ·ў·щЦөјхЙЩЈ¬јфЗРІЁЛЩВФУРФцјУЈ¬өұA/d50РЎУЪ10-3КұЈ¬јфЗРІЁЛЩЗчУЪКХБІЈ¬»щұҫОИ¶ЁЈ»өұјӨ·ўЖөВКРЎУЪ№ІХсЖөВККұЈ¬ҪУКХФҙҝЕБЈөДО»ТЖІЁРОҪПОўИхЈ¬ЗТјфЗРІЁЛЩЛжЖөВКВФУРФцјУЈ¬өұјӨ·ўЖөВКҙпөҪ№ІХсЖөВКәуЈ¬РЕәЕЗҝ¶ИФцЗҝІўЗТІЁРОПаЛЖЈ¬Н¬КұјфЗРІЁЛЩҪ«ұЈіЦОИ¶ЁЈ»ЛжО§С№ФцјУЈ¬јфЗРІЁЛЩЦрҪҘФцҙуЈ»јфЗРІЁЛЩЛж·ЁПтҪУҙҘёХ¶ИөДФцҙу¶шФцјУЈ¬ІўУл·ЁПтҪУҙҘёХ¶ИөДҝӘ·ҪҪьЛЖіЙЦұПЯ№ШПөЎЈ
ІОҝјОДПЧЈә
[1] CLAYTON C R I. Stiffness at small strain: research and practice[J]. GЁҰotechnique, 2011, 61(1): 5-37.
[2] SANTAMARINA J C, KLEIN A, FAM M A. Soils and waves:Particulate materials behavior, characterization and process monitoring[J]. Journal of Soils and Sediments, 2001, 1(2): 130-130.
[3] KOKUSHO T. Cyclic triaxial test of dynamic soil properties for wide strain range[J]. Soils & Foundations, 1980, 20(2): 45-60.
[4] BENEDETTO H D, EZAOUI A. Experimental measurements of the global anisotropic elastic behaviour of dry Hostun sand during triaxial tests, and effect of sample preparation[J]. GЁҰotechnique, 2009, 59(7): 621-635.
[5] CHAUDHARY S K. Measurement of quasi-elastic stiffness parameters of dense Toyoura sand in hollow cylinder apparatus and triaxial apparatus with bender elements[J]. Geotechnical Testing Journal, 2004, 27(1): 1-13.
[6] SHIRLEY D J, HAMPTON L D. Shear-wave measurements in laboratory sediments[J]. The Journal of the Acoustical Society of America, 1978, 63(2): 607-613.
[7] іВФЖГф, ЦЬСа№ъ, »ЖІ©. АыУГНдЗъФӘІвКФЙ°НБјфЗРДЈБҝөД№ъјКЖҪРРКФСй[J]. СТНБ№ӨіМС§ұЁ, 2006, 28(7): 874-880.
CHEN Yunmin, ZHOU Yanguo, HUANG Bo. International parallel test on the measurement of shear modulus of sand using bender elements[J]. Chinese Journal of Geotechnical Engineering, 2006, 28(7): 874-880.
[8] FONSECA A V D, FERREIRA C, FAHEY M. A framework interpreting bender element tests, combining time-domain and frequency-domain methods[J]. Geotechnical Testing Journal, 2009, 32(2): 91-107.
[9] ЦЬСа№ъ. НБҪб№№РФөДјфЗРІЁЛЩұнХчј°¶Ф¶ҜБҰМШРФөДУ°Пм[D]. әјЦЭ: ХгҪӯҙуС§ҪЁЦю№ӨіМС§Фә, 2007: 95-116.
ZHOU Yanguo. Shear wave velocity-based characterization of soil structure and its effects on dynamic behavior[D]. Hangzhou: Zhejiang University. College of Civil Engineering and Architecture, 2007: 95-116.
[10] HARDIN B O, RICHART F E. Elastic wave velocities in granular soils[J]. Journal of the Soil Mechanics & Foundations Division, 1963, 89: 33-66.
[11] SUITS L D, SHEAHAN T C, PATEL A, et al. An empirical relationship for determining shear wave velocity in granular materials accounting for grain morphology[J]. Geotechnical Testing Journal, 2009, 32(1): 1-10.
[12] ZENG X, NI B. Stress-induced anisotropic G max of sands and its measurement[J]. Journal of Geotechnical and Geoenvironmental Engineering, 1999, 125(9): 741-749.
[13] ОвәкО°, АоЗа, Бх№ъұт. АыУГНдЗъФӘІвБҝЙПәЈФӯЧҙИнрӨНБёчПтТмРФјфЗРДЈБҝөДКФСйСРҫҝ[J]. СТНБ№ӨіМС§ұЁ, 2013, 35(1): 150-156.
WU Hongwei, LI Qing, LIU Guobin. Measurements of small-strain inherent stiffness anisotropy of intact Shanghai soft clay using bender elements[J]. Chinese Journal of Geotechnical Engineering, 2013, 35(1): 150-156.
[14] РмҪа, ЦЬі¬. ёЙКӘВ·ҫ¶У°Пм·ЫНБРЎУҰұдјфЗРДЈБҝөДКФСйСРҫҝ[J]. СТНББҰС§, 2015: 36(1): 577-381.
XU Jie, ZHOU Chao. Experimental study of effect of wetting-drying path on small-strain shear modulus of silt[J]. Rock and Soil Mechanics, 2015: 36(1): 577-381.
[15] LEE J S, SANTAMARINA J C. Bender elements: performance and signal interpretation[J]. Journal of geotechnical and geoenvironmental engineering, 2005, 131(9): 1063-1070.
[16] ALVARADO G, COOP M R. On the performance of bender elements in triaxial tests[J]. GЁҰotechnique, 2012, 62(1): 1-17.
[17] ARROYO M, MUIR WOOD D, GREENING P D. Source near-field effects and pulse tests in soil samples[J]. GЁҰotechnique, 2003, 53(3): 337-345.
[18] РмРЎГф, БиөАКў, »ЖІ©, өИ. АлЙўФӘДЈДвЦРҝЕБЈІДБПјфЗРІЁЛЩөДјфЗРХс¶ҜИ·¶Ё·Ҫ·Ё[J]. СТНБ№ӨіМС§ұЁ, 2011, 33(9): 1462-1468.
XU Xiaomin, LING Daosheng, HUANG Bo, et al. Determination of shear wave velocity in granular materials by shear vibration within discrete element simulation[J]. Chinese Journal of Geotechnical Engineering, 2011, 33(9): 1462-1468.
[19] OЎҜDONOVAN J, OЎҜSULLIVAN C, MARKETOS G. Two-dimensional discrete element modelling of bender element tests on an idealised granular material[J]. Granular Matter, 2012, 14(6): 733-747.
[20] NING Z, KHOUBANI A, EVANS T M. Shear wave propagation in granular assemblies[J]. Computers & Geotechnics, 2015, 69: 615-626.
[21] MA G, ZHOU W, CHANG X L, et al. Combined fem/dem modeling of triaxial compression tests for rockfills with polyhedral particles[J]. International Journal of Geomechanics, 2014, 14(4): 04014014.
[22] MA G, ZHOU W, CHANG X L. Modeling the particle breakage of rockfill materials with the cohesive crack model[J]. Computers & Geotechnics, 2014, 61(61): 132-143.
[23] MA G, ZHOU W, NG T T, et al. Microscopic modeling of the creep behavior of rockfills with a delayed particle breakage model[J]. Acta Geotechnica, 2015, 10(4): 481-496.
[24] MA G, ZHOU W, CHANG X L, et al. Formation of shear bands in crushable and irregularly shaped granular materials and the associated microstructural evolution[J]. Powder Technology, 2016, 301: 118-130.
[25] TOOMEY A, BEAN C J. Numerical simulation of seismic waves using a discrete particle scheme[J]. Geophysical Journal International, 2000, 141(3): 595-604.
[26] CHANEY R C, DEMARS K R, PENNINGTON D S, et al. Horizontally mounted bender elements for measuring anisotropic shear moduli in triaxial clay specimens[J]. Geotechnical Testing Journal, 2001, 24(2): 133-144.
[27] LEONG E C. Measuring shear wave velocity using bender elements[J]. Astm Geotechnical Testing Journal, 2005, 28(5): 488-498.
[28] AHN J, BISCONTIN G, ROESSET J M. Wave propagation in nonlinear one-dimensional soil model[J]. International Journal for Numerical & Analytical Methods in Geomechanics, 2010, 33(33): 487-509.
(ұајӯ ХФҝЎ)
КХёеИХЖЪЈә2017-06-08Ј»РЮ»ШИХЖЪЈә2017-08-04
»щҪрПоДҝ(Foundation item)Јә№ъјТЧФИ»ҝЖС§»щҪрЧКЦъПоДҝ(51509190)Ј»№ъјТЦШөгСР·ўјЖ»®ПоДҝ(2017YFC0404801)Ј»ЦР№ъІ©КҝәуҝЖС§»щҪрЧКЦъПоДҝ(2016T907272)(Project(51509190) supported by the National Natural Science Foundation of China; Project(2017YFC0404801) supported by the National Key R&D Program of China; Project(2016T907272) supported by the China Postdoctoral Science Foundation)
НЁРЕЧчХЯЈәВнёХЈ¬І©КҝЈ¬ёұҪМКЪЈ¬ҙУКВёЯ°УҪб№№КэЦө·ВХжСРҫҝЈ»E-mailЈәmagang630@whu.edu.cn

