Spectrum spatial structure characteristic analysis ofremote sensing alteration information and interference factors
来源期刊:中南大学学报(英文版)2009年第4期
论文作者:杨自安 彭省临 朱谷昌 石菲菲 邹林 张远飞
文章页码:647 - 653
Key words:remote sensing data; alteration information; background; interference factor; spectrum spatial structure; scatter diagram
Abstract: Based on the statistical characteristics of remote sensing data, the spatial geometric structure characteristics of spectral data and distribution of background, interference and alteration information in characteristic space were researched through the analysis of two-dimensional and three-dimensional scatter diagrams. The results indicate that the hyper-space of remote sensing multi-data aggregation belongs to low-dimensional geometric structure, i.e. hyperplane form, and anomalous point groups including alteration information usually dissociate out of hyperplane. Scatter diagrams of remote sensing data band are mainly presented as two distribution forms of single-ellipse and dual-ellipse. Clarifying the relations of three objects of background, disturbance and alteration information in remote sensing images provides an important technical thought and guidance for accurately detecting and extracting remote sensing alteration information.
基金信息:the National Science and Technology Pillar Program Project during the 11th Five-Year Plan Period
Land and Resources Investigation Project
J. Cent. South Univ. Technol. (2009) 16: 0647-0652
DOI: 10.1007/s11771-009-0107-2
![]()
YANG Zi-an(杨自安)1, 2, PENG Sheng-lin(彭省临)2, ZHU Gu-chang(朱谷昌)1,
SHI Fei-fei(石菲菲)1, ZOU lin(邹 林)1, ZHANG Yuan-fei(张远飞)1
(1. China Non-ferrous Metals Resource Geological Survey, Beijing 100012, China;
2. School of Geoscience and Environmental Engineering, Central South University, Changsha 410083, China)
Abstract: Based on the statistical characteristics of remote sensing data, the spatial geometric structure characteristics of spectral data and distribution of background, interference and alteration information in characteristic space were researched through the analysis of two-dimensional and three-dimensional scatter diagrams. The results indicate that the hyper-space of remote sensing multi-data aggregation belongs to low-dimensional geometric structure, i.e. hyperplane form, and anomalous point groups including alteration information usually dissociate out of hyperplane. Scatter diagrams of remote sensing data band are mainly presented as two distribution forms of single-ellipse and dual-ellipse. Clarifying the relations of three objects of background, disturbance and alteration information in remote sensing images provides an important technical thought and guidance for accurately detecting and extracting remote sensing alteration information.
Key words: remote sensing data; alteration information; background; interference factor; spectrum spatial structure; scatter diagram
1 Introduction
Alteration is an important metallogenic symbol generated by different mineralizations and is also an important basis to guide geological prospecting directly [1]. Remote sensing images reflecting spectral features of ground objects have varying degrees of spectral anomaly of mineralization and alteration. The alteration information can be extracted through professional image enhancement processing methods to provide a direct and strong basis for geological metallogenic prediction and delineation of prospecting targets [2]. In recent years, the extraction technology of multi-(hyper-) spectra remote sensing alteration information has been widely used in geologic prospecting by remote sensing and has made good application effect. Numerous remote sensing geological workers pay more and more attention to the application and research of the technology.
The extraction of remote sensing alteration information is based on spectral characteristics of rocks and ores: selecting characteristic factors that can enhance alteration information through combination and transformation of wave bands of remote sensing images according to spectral differences between altered rock and unaltered rock, and extracting alteration information related to mineralization [3-6]. However, it causes that many people frequently refer to geological minerals data, and directly select certain method in common use to extract alteration information in practical work, but they overlook first detecting to the objective existence of alteration information. Although the spectral features of altered minerals (rock) are very obvious in theory, low spectral resolution of multi-band remote sensing images and influence of background and interference ground objects cause mineralization, and alteration information is always weak in remote sensing images [7]. In other words, on the physical sense, alteration minerals (rock) have obvious spectral separability of spectral characteristics in spectral curve. But statistically significant, the identification of alteration information in multi-data aggregation of remote sensing image is still uncertain and difficult [8]. Therefore, the most essential issue is to clarify three main targets background, interference and alteration anomaly and their relationship in remote sensing images when detecting and extracting remote sensing alteration information.
Based on the theories of spectral mixing model and the probability distribution of random variable, the spatial geometric structure features of remote sensing images and data in different natural landscape areas were analyzed thoroughly from the basic features of non-Gaussian distribution of remote sensing images and data, by ascertaining that the higher space of multi-data
aggregation of remote sensing images belongs to low-dimensional geometric structure hyper dimensional plane form and anomalous point groups including alteration information usually dissociate out of hyperplane. At the same time, some new ideas about the explanation of background and interference in the detection of alteration information were put forward to systematically discuss the relationship between background and interference and the classification of the types of interference ground objects and to provide an important technical idea for the elimination of interference factors, the position location of alteration information, and the extraction of alteration information.
2 Spatial geometric structure of multi-(hyper-) spectral data
Remote sensing multi-(hyper-) spectral data belong to an aggregation of multi-data and every pixel is on behalf of one spectral vector. Therefore, multi-data aggregation of image forms a lattice in higher space, and the space lattice has a certain geometric structure.
Multi-band data, such as the TM (or ETM+), generally have 7-8 bands, and ASTER data have 14 bands. The hyper-spectral data usually have a few dozen to several hundreds of bands, and the lattice formed by multi-data aggregation falls in several-dozen- dimensional higher space. In fact, both hyper-spectral data and multi-band data have high redundancy and high relevance. Because background pixel points in low frequency domain of any remote sensing image always occupy the vast majority of total image pixels, these background pixels make wave band data have a high correlative feature. In addition, spectral variable features of images are always formed by differences of special spectra of limited member ground objects, and the mixture of spectra of member ground objects forms the pixel points occupying vast majority of the total number. These mixing pixels form the main body of the background of image and the spectral features of these mixing pixels lead to high relevance of multi-(hyper-) spectral data, which makes higher space lattice geometry of remote sensing image. The data show the characteristics of low-dimensional structure.
2.1 Low-dimensional spatial structure of spectra data based on relevance of remote sensing bands
In a large number of remote sensing image data processing, bands of remote sensing images have a relative strong linear correlation. In particular, the linear correlation of adjacent bands is very strong. The strong linear correlation of bands is one of important characteristics of remote sensing multi-(hyper-) spectral data [9-10], and makes spectral data aggregation present a low-dimensional geometric structure in higher dimensional space. For example, scatter distribution of two-dimensional data shows one-dimensional geometric feature and that of three-dimensional data shows two-dimensional geometric feature (see Fig.1).
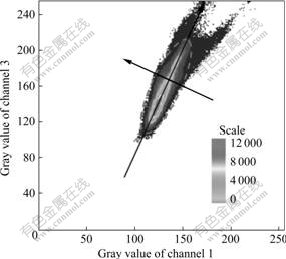
Fig.1 Two-dimensional scattergram of TM3 and TM1 (Inside ellipse for background, outside ellipse for alteration anomaly and interference)
2.2 Low-dimensional spatial structure of spectra data based on theory of spectral mixing model
The theory of spectral mixing model [11-14] is that in a given region, the surface is composed of a set of characteristic ground objects (members) with relatively stable spectrum, for example, water, grass, soil and shadow, and most spectral changes of the surface scenes are caused by the occurrence location and a certain percentage of these members. This means that the linear combination of these members can better describe the spectral changes observed by remote sensing system. According to the theory of spectral linear mixing model, it is not difficult to obtain the redundancy of multi-(hyper-) spectral data and the correlation between wave bands, and the important conclusion that multi-(hyper-) spectral data space belongs to low-dimensional geometric structure.
According to the research results of 30 typical different natural landscape areas by CHRISTOPHER [15] based on spectral mixing space of ETM+ images, the overall situation is that main spectral changes of ETM+ images can be described by the spectral linear mixture of four main ground objects of soil, rock formation, green vegetation and dark surface. At the same time, he pointed out that more than 98% spectral change of ETM+ image can be expressed in three-dimensional spectral mixing space and even more than 90% spectral change can be expressed in two-dimensional projection of mixing spectral space [15]. These important conclusions are in support of low-dimensional spatial structure of spectral data space.
2.3 Inference of low-dimensional structure feature on hyperplane
Multi-band data of remote sensing images belong to multi-data random variable. Assume that the multi-band data submit to multi-data Gaussian distribution, the histogram of single-band data is Gaussian distribution, two-dimensional distribution scatter diagram of two relevant bands is in elliptical shape, three-dimensional distribution scatter diagram of three relevant bands is in ellipsoid shape, and high-dimensional distribution scatter diagram of n bands is in ultra-ellipsoid shape. Combining with previous research and analysis, it is not hard to deduce that ultra-ellipsoid of n relevant bands in high-dimensional distribution scatter diagram is actually similar to hyperplane geometry, and the main body of the hyperplane is the space extended by background member, corresponding to background information region of remote sensing image, and those dissociate out of hyperplane geometry are anomalous information and noise. In other words, high-dimensional space lattice of multi-data aggregation of remote sensing image can be divided into two signal subspaces of background and anomaly.
3 Relationship among background, interference and alteration anomaly
Compared with alteration anomaly, background and interference can usually be defined as follows. Background refers to comprehensive information reflected by spectral characteristics of one or a variety of major ground objects in an image. Pixels aggregation within 2-3 times standard deviation on the left and right sides of the plural (or average value) corresponds to background, which is the object needed to be separated. Interference refers to distinctive anomalous information that influences the detection of target information i.e. alteration anomaly, and does not belong to target information. Pixels aggregation over 2-3 times standard deviation on the left and right sides of the plural (or average value) usually corresponds to interference and alteration anomaly. Interference and alteration information belong to anomalous information, and the differences are that alteration information is the target information needed to be extracted, and interference information is the non-target information needed to be eliminated.
In order to better guide the direction of remote sensing alteration anomaly, according to the above analyzed results of geometric structure of multi-(hyper-) spectral data space, a more meaningful definition of background and interference is given. Background refers to superellipsoid (in fact similar to hyperplane) in data point aggregation space of remote sensing multi-band image, and small category data point aggregations dissociated out of super-ellipsoid are interference and alteration anomalous targets. As shown in Fig.1, pixel aggregation is the background information and belongs to large category objects, usually with a clear ellipse shape and border, so it is not too difficult to separate from background. Interference and alteration anomalous target often fall on the outside of ellipse border and belong to small category, without good regular form and border and mixing mutually. So it is not easy to eliminate interference.
The above-mentioned definition and analysis show that the main task for the detection of alteration anomalous information is to study the spectral differences among alteration anomaly, background and interference and their distributive characteristics in geometric space of multi-band data point aggregation. It should be emphasized that the relationship between background and interference is not absolute but relative. Point aggregation space of different band combinations may appear as different backgrounds and interferences. Therefore, it is very important for the selection of band combination in the extraction of alteration information.
It is found in practical work that distribution scatter diagrams generated by random two or three bands basically occur in terms of linear distribution (single-ellipse pattern) if remote sensing multi-band images of one area are not influenced by large category interference ground objects, as shown in Fig.1. Once there exists one major interference ground object, such as snow, clouds, and vegetation, the distortion two- dimensional scattergram with non-linear distribution is obtained (Fig.2), in which the main ellipse is background ellipse, and the secondary ellipse is interference ellipse. In addition to these two kinds of scattergrams, the more complex scattergrams are rare. These phenomena show that the essential spectral character of remote sensing image that appears to be variable is not complicated and can be boiled down to the above-mentioned two types [16-17]. Their spectral mixing characteristics are as follows.
(1) Linear distribution pattern (single-ellipse pattern)
For various types of ground objects that constitute a kind of image, their spectral characteristics are similar, their spectral curve patterns are also similar and only their amplitudes of spectra have some differences. The image can be seen as a linear mixture of a type of dark ground object and a type of bright ground object. These ground objects constitute the background of image and correspond to pixel aggregation in ellipse in distribution scatter diagram. Interference and alteration anomalies occur in terms of small category point aggregation out of the border of ellipse (Fig.1).
(2) Non-linear distribution pattern (double-ellipse pattern)
The first case and the case in which the form of some spectral curves is significantly different from large category interference ground objects of background (such as vegetation), constitute the linear mixture of spectra of three types of ground objects. The form of scattergram generates one interference ellipse on background ellipse to form two-ellipse shape, which is also similar to quasi-triangular shape (Fig.2).
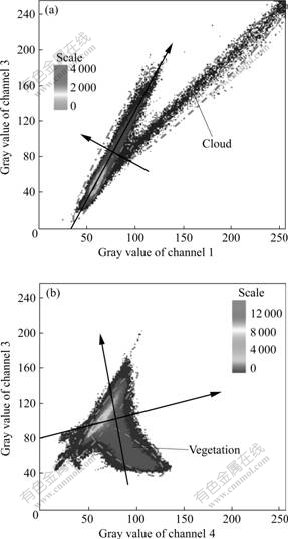
Fig.2 Two-dimensional scattergrams influenced by interference factor: (a) Scattergram of TM3 and TM1 (r(correlation coefficient)=0.95, Jiawuxiang area, Qinghai Province, China); (b) Scattergram of TM3 and TM4 (r=0.66, Jiegangri area, Qinghai Province, China)
In the above-mentioned two forms of scattergrams, the small category with different spectral characteristics such as alteration anomaly, interference and noise generally influences the flatness degree of ellipse of two-dimensional scattergram or the size and the form of meta-triangle. Most of these small category ground objects fall on both sides of short axis of ellipse (mainly referring to background ellipse), and the probability on both sides of major axis is very small. Therefore, the hybrid process of these small category objects spectra to background ground object makes two-dimensional scattergram a protruding polygonal geometry (similar to ellipse), and the background is the pixel aggregation in inner-met ellipse of geometry (Fig.3).
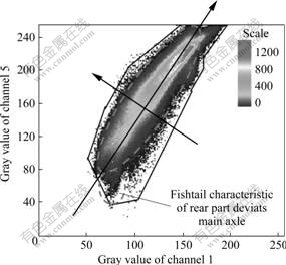
Fig.3 Two-dimensional scattergram of TM5 and TM1 (r=0.95, Bayinshan area, Qinghai Province, China)
4 Division of type of interference factors
Interference factors in different natural landscape areas are not always the same, which can be summarized as vegetation, soil, water, shadow, Gobi desert, clouds (including shadow), snow and fog. These factors have a great influence on the extraction of alteration information. Classifying reasonably these interference factors is propitious to sort out the relationship and differences among interference, background and alteration information and to extract alteration information.
(1) Classify interference factors according to characteristics of spectral band of interference ground object (the intensity of reflection peak or absorption valley): interference ground objects with strong reflection or absorption, such as vegetation, snow, clouds and shadow; interference ground objects with medium reflection or absorption, such as water systems; interference ground objects with weak reflection or absorption, such as pixel aggregation mixed by the spectra of water system or shadow with that of background ground objects.
This classification is a general classification in physical sense. When interference ground objects have strong reflection or absorption characteristics of spectral band, the other interference ellipse will be produced on the side branch of background ellipse in two-dimensional scattergram of corresponding band combination (Fig.2(a)); when interference ground objects have medium or weak reflection or absorption characteristics of spectral band, the pixel points will fall at the boundary of ellipse in two-dimensional scattergram of corresponding band combination in terms of small category, and turn the scattergram into protruding polygon (Fig.3).
(2) Classify interference factors according to distributive form of interference ground objects in remote sensing image: scattering form such as shadow and dendritic drainage pattern; gathering form, such as snow and clouds. From the theory of spectral mixing model, interference factors with scattering form influence numerous adjacent image pixels in spectrum, and interference factors with gathering form such as snow area only have mixing influences on some peripheral image pixels. Therefore, the influences of interference factors with scattering form are far greater than those of interference factors with gathering form.
An important advantage of this classification is the spatial location of different interference factors in two-dimensional scattergram. In most cases, interference factors with scattering form essentially fall on both ends of long axis of background ellipse and interference factors with gathering form fall at the boundary of ellipse on both sides of transversal axis.
(3) Classify interference factors according to the source of interference ground objects. Exogenous interference means that the interference ground objects are from or belong to outer spherical layer of earth (referring to three layers of atmosphere, hydrosphere and biosphere), mainly including snow, clouds (containing shadow), fog, water and vegetation. Intrinsic interference refers to the interference ground objects belonging to or derived from lithosphere (inner spherical layer of earth), mainly including Gobi desert area, soil and shadow.
Exogenous interference is of characteristics of strong reflection and centralized distribution basically. These interference factors must fall at the boundary of ellipse on both sides of transversal axis in two-dimensional scattergram of corresponding wave bands. Most of them produce another interference ellipse (or small category pint aggregation) based on background ellipse, such as the interference of clouds shown in Fig.2(a). Exogenous interference is unlikely to be changed into background information from interference information. Most intrinsic interference factors are medium or weak reflection (or absorption) and scattering distribution, which will fall on both ends of macro axis of background ellipse in two-dimensional scattergram. Intrinsic interference may be changed from interference information into background information, such as Gobi desert areas and soil.
Vegetation is a special ground object with obvious spectral characteristics [18], and it is much more complex than other interference factors. When it belongs to gathering distribution with relative strong spectral reflection intensity, characteristics of exogenous interference will be obvious and the relevant two-dimensional scattergram will be in dual-elliptical form (Fig.2(b)). When it belongs to scattering distribution with relative strong spectral reflection intensity, the relevant two-dimensional scattergram will be turned from dual-elliptical form to triangle, but the dual-elliptical form will clearly visible. When it belongs to scattering distribution with relative weak spectral reflection intensity, characteristics of intrinsic interference will be obvious. It will be one end in macro axis of ellipse in corresponding two-dimensional scattergram, and clustering form of vegetation can also be seen. If vegetation has relative weak spectral reflection intensity and belongs to broken scattering distribution, it will be completely mixed into background (Fig.4). It should be noted that, the direction of background ellipse is often changed in two-dimensional scattergram with strong interference of vegetation.

Fig.4 Two-dimensional scattergram of TM3 and TM4 (r=0.32, Jidi area in Qinghai Province, vegetation is not well developed and sparse)
5 Conclusions
(1) The spatial geometric structure characteristics of spectral data and distribution of background, interference and alteration information in characteristic space are analyzed.
(2) Higher space of multi-data aggregation of remote sensing images belongs to low-dimensional geometric structure, i.e. hyper-plane form.
(3) The number of anomalous points always accounts for very small proportion in remote sensing data, and the main body of hyper-plane is composed of the space extended by background members.
(4) Spectrum of anomalous member is independent of that of background member, and anomalous point groups including alteration information usually dissociate out of hyper-plane.
(5) Dimensions of hyper-plane are similar to the intrinsic dimension.
References
[1] YAO Feng-liang, SUN Feng-yue. Course of ore deposit [M]. Beijing: Geological Publishing House, 2006. (in Chinese)
[2] L? Feng-jun, XIANG Li-xin, FAN Ji-zhong, RUAN Jian-wu, WU Cheng-wu, DUAN Zhan. Application study of remotely sensed alteration information extraction [J]. Xinjiang Geology, 2004, 22(4): 435-437. (in Chinese)
[3] ZHANG Yu-jun, YANG Jian-min, CHEN Wei. A study of the method for extraction of alteration anomalies from the ETM+(TM) data and its application: Geologic basis and spectral precondition [J]. Remote Sensing for Land and Resources, 2002, 54(4): 30-37. (in Chinese)
[4] ZOU Lin, YANG Zi-an, ZHU Gu-chang, WU De-wen, XIANG An-qin. New method of alteration information extraction from multi-spectrum remote sensing data [J]. Geology and Prospecting, 2006, 42(6): 71-76. (in Chinese)
[5] GEOL P K, PARSHER S O, PATEL R M, LANDRY J A, BONNELL R B, VIAU A A. Classification of hyperspectral data by decision trees and artificial neural networks to identify weed stress and nitrogen status of corn [J]. Computers and Electronics in Agriculture, 2003, 39(12): 67-93.
[6] RAPTIS V S, VAUGHAN R A, WRIGHT G G. The effect of scaling on land cover classification from satellite data [J]. Computers and Geosciences, 2003, 29(6): 705-714.
[7] NARAYANAN R M, DESETTY M K, REICHENBACH S E. Effect of spatial resolution on information content characterization in remote sensing imagery based on classification accuracy [J]. International Journal of Remote Sensing, 2002, 23(3): 537-553.
[8] ZHANG Yuan-fei, WU De-wen, ZHU Gu-chang, YANG Zi-an. The problems of background and interference in remote sensing alteration information detection [J]. Remote Sensing for Land and Resources, 2008, 84(2): 22-26 (in Chinese)
[9] ZHENG Xiu-ren, PAN Jian-jun, LIN Hai, GU Miao. Study on the spectral reflectance of four kinds of the mixed land cover types [J]. Journal of Nanjing Agricultural University, 2004, 27(4): 55-59. (in Chinese)
[10] LI Zhi-yong, YU Wen-xian, KUANG Gang-yao, WU Hao. The research of anomaly detection based on high-dimensional geometric feature in hyperspectral imagery [J]. Remote Sensing Technology and Application, 2003, 18(6): 379-383. (in Chinese)
[11] RANJBAR H, HONARMAND M, MOEZIFAR Z. Application of the Crosta technique for porphyry copper alteration mapping, using ETM+ data in the southern part of the Iranian volcanic sedimentary belt [J]. Journal of Asian Earth Sciences, 2004, 24(2): 237-243.
[12] JUNCHANG J, KOLACZYK E D, SUCHARITA G. Gaussian mixture discriminant analysis and sub-pixel land cover characterization in remote sensing [J]. Remote Sensing of Environment, 2003, 84(2): 550-560.
[13] TAKEUCHI W, TAMURA M, YASUOKA Y. Estimation of methane mission from West Siberian wet land by scaling technique between NOAA AVHRR and SPOT HRV [J]. Remote Sensing of Environment, 2003, 85(1): 21-29.
[14] SUN Ru, LIU Chang-ming, LI Xiao-wen. Evapotranspiration estimation in the Yellow River Basin, China, using integrated NDVI data [J]. International Journal of Remote Sensing, 2004, 25(13): 2523-2534.
[15] CHRISTOPHER S. The landsat ETM+ spectral mixing space [J]. Remote Sensing of Environment, 2004, 93(1/2): 1-17.
[16] MEDLYN B E. Carbon balance of coniferous forests growing in contrasting climates: Model-based analysis [J]. Agricultural and Forest Meteorology, 2005, 97(2): 131-138.
[17] MUTANGA O. Estimating tropical pasture quality at canopy level using band depth analysis with continuum removal in the visible domain [J]. International Journal of Remote Sensing, 2005, 26(3): 1093-1108.
[18] PAN Y D. Importance of foliar nitrogen concentration to predict forest productivity in the Mid-Atlantic region [J]. Forest Science, 2004, 50(4): 279-289.
(Edited by CHEN Wei-ping)
Foundation item: Project(2006BAB01A06) supported by the National Science and Technology Pillar Program Project during the 11th Five-Year Plan Period; Project(1212010761503) supported by Land and Resources Investigation Project
Received date: 2008-11-28; Accepted date: 2008-12-31
Corresponding author: YANG Zi-an, Senior Engineer, PhD; Tel: +86-10-84929540; E-mail: yzaldy88@126.com

