J. Cent. South Univ. (2012) 19: 22-29
DOI: 10.1007/s11771-012-0967-8
Fabrication and characterization of
composite YSZ-La9.33Si6O26 oxygen-ion conductor
LIU Chao-feng(刘超峰), ZHANG Hong(张鸿), ZHANG Zhe(张哲), XIA Jun-xiao(夏俊霄), LI Zhi-cheng(李志成)
1. School of Materials Science and Engineering, Central South University, Changsha 410083, China;
2. State Key Laboratory of Powder Metallurgy, Central South University, Changsha 410083, China
? Central South University Press and Springer-Verlag Berlin Heidelberg 2012
Abstract: To improve the conductivity of Y2O3-stabilized ZrO2 (YSZ) based oxygen-ion conductor, Zr0.85Y0.15O1.925-La9.33Si6O26 (YSZ-LSO) composite ceramics with the mass fraction of La9.33Si6O26 (LSO) of 15% were prepared by using a modified coprecipitation method. The phases, microstructures and conductivities of the YSZ, LSO and YSZ-LSO were investigated by X-ray diffraction, electron microscopy and complex impedance, respectively. The results show that the as-calcined powder of YSZ-LSO composite has the grain size less than 10 nm, and the as-sintered composite ceramics are composed of YSZ and LSO phases. The conductivity can be enhanced obviously by composite method. At 700 °C, the conductivity of the composite ceramic is 0.125 S/cm, which is one order in magnitude higher than that of the YSZ ceramic and two orders in magnitude higher than that of LSO ceramic. By analyzing the impedance spectra and modulus spectra, the interfacial effect on the conductivity improvement was proposed.
Key words: oxygen-ion conductor; composite materials; coprecipitation synthesis; conductivity
1 Introduction
Solid oxide fuel cells (SOFCs) have attracted much attention for the electric power system because of various potential advantages, such as a wide variety of available fuels, good durability, inexpensive technology and high efficiency [1-2]. With the increasing concerns of the global warming and pollution resulted from the exhaust of fossil fuels, tremendous effort has been put into the research and development of SOFCs during the last decade. However, for the requirement of oxygen-ion conductivity higher than 0.1 S/cm, the operating temperatures of the commercial SOFCs with the electrolyte of Y2O3-stabilized ZrO2 (YSZ) are 900- 1 000 °C. At high operating temperature, some harsh terms such as the sealing problem, thermal match between materials, and interface interaction between electrolyte and electrodes, can be met. In order to reduce the operating temperature of SOFCs, the conductivity enhancement of the electrolyte is becoming one of the most interesting topics. Generally, there are two possible ways to make the conductivity high enough for the application in the intermediate temperature (IT) SOFC, i.e., to find a new type of oxygen-ion conductor and to modify the microstructures of the present oxygen-ion conductors. The former is a difficult work because it is not easy to find a new compound with the high conductivity and high stability in the operating atmosphere. Here, the methods by composite process and nano-technology were reported to be the effective ways to improve the conductivity [3-7]. The lateral conductivities of YSZ/SrTiO3 epitaxial heterostructures showed several orders in magnitude higher than those of YSZ at room temperature [4]. The oxygen ionic conductivity of the nano-structured layer-by-layer electrolytes, which are composed of Gd2O3-doped CeO2 and ZrO2, was reported to be increased greatly compared with those of YSZ and Gd2O3-doped CeO2 [5-6]. Another report showed that the conductivities of the composite materials based on the doped CeO2 can be enhanced obviously by nanocomposite process [3, 7-8]. These indicate that the composite- or nanocomposite- technology should be one of the effective ways for the electrolyte development.
The YSZ has high oxygen-ion conductivity and ionic transference number as well as good mechanical properties at elevated temperatures, for example, the conductivities of YSZ with 8% (molar fraction) Y2O3 are 0.16 S/cm at 1 000 °C and 0.027 S/cm at 800 °C [9-10]. Meanwhile, the apatite-type lanthanum silicates such as La9.33Si6O26 (LSO) exhibit high chemical and structural stability at high temperatures and have high oxygen-ion transference number over a wide range of oxygen partial pressures [11-13]. The investigation of the apatite lanthanum silicates has attracted much attention in recent years, although the ionic conductivity needs to be improved further.
Although YSZ and LSO have some novel characteristics, their conductivities are not high enough for the application in IT-SOFCs. To our knowledge, there has not been any report on the composite oxygen-ion conductor consisting of YSZ and LSO so far. In the present work, nanometer powders of Zr0.85Y0.15O1.925 (YSZ) and La9.33Si6O26 (LSO) were synthesized, and the YSZ-LSO composite materials were investigated. Here, the YSZ-LSO composite with 15% (mass fraction) LSO was reported for it shows the highest conductivity.
2 Experimental
2.1 Material preparation
Oxygen-ion conducting composite material of Zr0.85Y0.15O1.925-La9.33Si6O26 (YSZ-LSO) with 15% (mass fraction) LSO was prepared according to a modified coprecipitation process shown in Fig. 1. Stoichiometric amounts of ZrOCl2・8H2O (>98%, Dahao, Shantou, China) and Y2O3 (99.99%, Yuejing, Shanghai, China), according to the formula of Zr0.85Y0.15O1.925 (YSZ), were mixed and dissolved into dilute nitric acid solution. The mixed solution was dropped into a dilute ammonia solution (pH≈8) with vigorous stirring to make Zr4+ and Y3+ ions coprecipitate. The precipitated mixture was added with appropriate amount of citric acid (C6H8O7, Hengxing, Tianjin, China) and then was ultrasonically dispersed. As a result, YSZ precursor was obtained. Meanwhile, according to the formula of La9.33Si6O26 (LSO), appropriate amount of La2O3 (99.9%, Xilong, Guangdong, China) was dissolved into dilute nitric acid solution and tetraethoxysilane (TEOS, AR, Xilong, Guangdong, China) was dissolved into alcohol. Two kinds of solutions were mixed and then dropped into the YSZ precursor by using ammonia solution to adjust the pH value to be about 8. Appropriate amount of polyethylene glycol (PEG-400, Youji, Changsha, China) was added to further modify the surface of precipitated particles. After being aged at 50 °C for 12 h, the mixed precursor was centrifuged with distilled water and alcohol for several times until the chlorine ions were eliminated completely. After being dried, the precursor was calcined at 800 °C for 60 min to obtain composite powders.
Meanwhile, as comparison, the single phase YSZ and LSO powders were prepared by the following processes. Appropriate amounts of ZrOCl2・8H2O and Y2O3 were mixed according to the formula of Zr0.85Y0.15O1.925 and dissolved into dilute nitric acid solution. The mixed solution was dropped into dilute ammonia solution (pH≈8) under vigorous stirring. After being aged at 50 °C for 12 h, the YSZ precursor was repeatedly centrifuged with distilled water and alcohol until the chlorine ions were eliminated completely. After adding appropriate amounts of citric acid and polyethylene glycol, the centrifuged YSZ precursor was ultrasonically dispersed. Then, the dispersed precursor was dried by stirring and heating. The dried precursors were calcined at 800 °C for 60 min to obtain YSZ powders. For the preparation of the LSO powders, appropriate amount of La2O3 was dissolved into dilute nitric acid solution and TEOS was dissolved into alcohol. Then, the two kinds of clear solutions were mixed. This mixed solution was dropped into a dilute ammonia solution (pH≈8) under vigorous stirring. Polyethylene glycol and critic acid were added to modify the surface of the precipitated precursor and then ultrasonically dispersed. After being aged at 50 °C for 12 h, the precursors were dried by stirring and heating. The dried precursors were calcined at 850 °C for 60 min to obtain LSO powders.
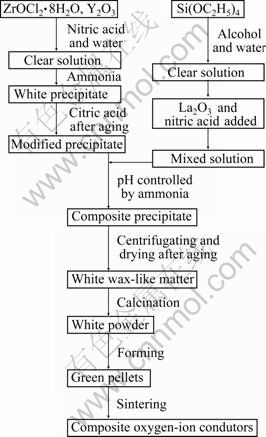
Fig. 1 Flowchart for preparation process of composite oxygen-ion conductors by modified coprecipitation method
All calcined powders were uniaxially pressed under 100 MPa to get green pellets with diameter of 10 mm and thickness of about 4 mm. These green pellets were sintered at 1 500 °C for 120 min with a heating/cooling rate of 5 °C/min.
2.2 Characterization
Phase identification was performed by using X-ray diffraction (XRD) (D/Max 2550PC, Japan) with Cu Kα radiation, at room temperature. The mean crystallite size was determined by using the Scherrer formula (D=kλ/βcosθ, k=0.89). The microstructures of the as-calcined powders and as-sintered pellets were investigated by scanning electron microscopy (SEM) (FEI SIRION200) and transmission electron microscopy (TEM) (FEI Tecnai G2 20). For the SEM observation, the ceramics were ground and polished, and then they were thermally etched at 1 200 °C for 30 min. Gold thin film was evaporated on the etched sample surface for the electronic conduction during SEM investigation. The samples for TEM observation were crushed in an agate mortar, dispersed in ethanol, and deposited onto a holy carbon film microgrid.
Silver electrodes were prepared by brushing silver paste onto both sides of the pellets and heated at 600 °C for 5 min. The conductivities were tested by using AC impedance measurement (Gamry Reference 600, USA) at temperatures from 300 °C to 700 °C, with a frequency range from 1 Hz to 1 MHz. For impedance measurement, a disturbing voltage of 50 mV was applied. The conductivity, σ, can be calculated with σ=L/RA, where L is the sample thickness, A is the electrode area and R is the resistance. The plots of frequency dependence of impedance and the frequency dependence of modulus were carried out using Zview software (Scribner Associates Inc., Southern Pines, NC).
3 Results and discussion
3.1 XRD analysis
Figure 2(a) shows the XRD patterns of the as- calcined powders of samples. By analyzing the XRD patterns with a Jade5+Pdf2003 analysis program, the results show that the YSZ powders have a cubic phase with the lattice parameters of a=0.513 9 nm, and the LSO powders have an apatite structure with the lattice parameters of a=0.971 3 nm and c=0.718 6 nm. According to the XRD pattern of YSZ-LSO composite powder, a cubic phase belonging to YSZ can be detected, but the diffraction peaks from LSO phase cannot be found. This might be the much stronger diffraction intensities of the YSZ phase compared with the one of LSO phase. The average grain size of the as-calcined YSZ-LSO composite powders calculated by Scherrer formula is 6.7 nm.
Figure 2(b) shows the XRD patterns of the as-sintered pellets. The YSZ and LSO samples show cubic structure and hexagonal one, respectively. However, it is not easy to detect the diffraction peaks from the LSO phase in YSZ-LSO composite ceramic in Fig. 2(b). In order to check the XRD patterns from LSO phase, the diffraction pattern at 2θ region from 24° to 52° in the XRD spectrum of the as-sintered composite ceramic is enlarged, as shown in Fig. 2(c). For comparing, the XRD patterns of pure phase YSZ and LSO are also inserted. It can be seen that the diffraction peaks coming from the LSO phase in YSZ-LSO composite can be detected clearly (marked by arrow in Fig. 2(c)). This indicates that the YSZ-LSO composite ceramic consisting of YSZ and LSO phases has been obtained in the present work.
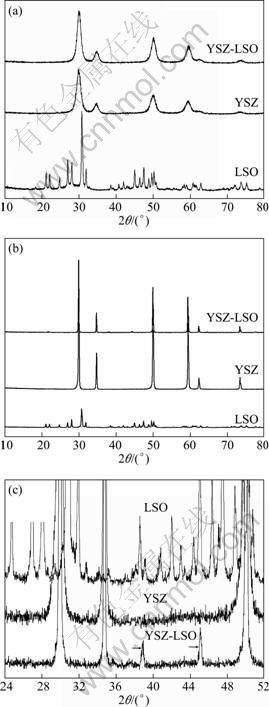
Fig. 2 XRD patterns of samples: (a) As-calcined powders; (b) As-sintered ceramics; (c) Magnified zone of patterns from as-sintered LSO, YSZ and YSZ-LSO
3.2 Electron microscopy observation
Figure 3(a) shows a TEM observation of the as-calcined YSZ-LSO composite powder. It can be seen that the average grain size of powder is around 10 nm, which is in agreement with the one calculated by Scherrer formula from the XRD spectrum shown in Fig. 2(a). For the fine grains, it is not easy to distinguish the YSZ and LSO phases there. Figure 3(b) shows an SEM observation of the as-sintered YSZ-LSO composite ceramic. Second phase, whose surface looks smooth, located at the grain boundaries or inside the grains (as marked by arrows) of the main phase can be observed. By the analysis of energy dispersed spectrum (EDS) (Fig. 3(d)), the second phase has the similar composition as that of LSO ceramic. Combined with the XRD results shown in Fig. 2, the second phase should be the LSO phase. On the other hand, in Fig. 3(b) one can see that most of the grains of the main phase have coarse surface, and they seem to be composed of lots of micro-grains. In order to check the details, a higher magnification SEM image is shown in Fig. 3(c). It can be seen that each grain is composed of lots of plate-like micro-grains with the thickness of about 40 nm. Meanwhile, one can also see that lots of white-color dots, which may belong to the LSO phase, locate at the grain boundaries and the interfaces between the micro-grains.
The fine grains of the as-calcined powders should be resulted from the assistance of the addition of citric acid and PEG during the coprecipitation process. Not only did the citric acid and PEG additive disperse the precipitated colloid by a steric hindrance effect, but also they could act as combustion fuel during the calcination process [14]. During the co-precipitation process, the carboxyl groups of the citric acid might be adsorbed on the surface of the precipitated colloid for the existence of numerous hydroxides ions. The remaining carboxyl groups of citric acid are exposed in the liquid. The steric effect or statistic electric force makes the colloid disperse homogeneously. So, the precipitated precursors are separated from each other and the agglomeration can be reduced obviously. At the same time, the hydroxyl groups of PEG can react with LSO precursors or citric acid. So, the surfaces of precipitated precursors are modified by organic agent. During the calcination stage, the organic agents are combusted. The gases, such as carbon dioxide and nitrogen dioxide, are given off from the combustion reaction. This process can also eliminate the particle agglomeration. As a result, the powders with fine grains and little agglomeration are obtained, and the second phase, LSO, can homogenously distribute in the YSZ powders in the YSZ-LSO composite.
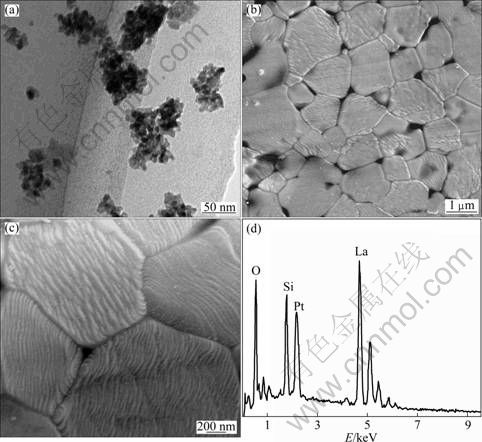
Fig. 3 Microstructures of YSZ-LSO composite materials: (a) TEM image of as-calcined powder; (b) SEM image of as-sintered ceramic; (c) High magnification SEM image of as-sintered composite ceramic; (d) EDS of second phase in (b)
3.3 Conductivity investigation
The AC impedance measurements were performed on the studied ceramics at the temperatures from 300 °C to 700 °C. Generally, the Nyquist plots of an oxygen-ion conductor exhibit three parts: the arc at high frequency range is attributed to bulk effect, the one at intermediate frequency comes from the grain boundary effect, and the low-frequency part relates to electrode behavior. With increasing temperature, the arcs corresponding to grain and grain boundary effect tend to be smaller and even disappear, and only the electrode contribution can be detected at higher temperatures [15]. Figure 4 shows the complex impedance spectra of the samples, YSZ, LSO and YSZ-LSO, measured at 400 °C, 500 °C and 600 °C, respectively. Figure 4(a) shows the Nyquist plots taken at 400 °C. Three parts can be distinguished for the bulk effect, the grain-boundary effect and the electrode effect, respectively. One can get that the total impedance, both bulk and grain-boundary effect, of YSZ-LSO composite is approximate to that of YSZ or LSO single phase ceramics. But for YSZ-LSO composite ceramic, the impedance value from grain-boundary effect is only around half that of YSZ or LSO ceramic. At 500 °C (Fig. 4(b)) and 600 °C (Fig. 4(c)), the complex impedance plots of YSZ-LSO and YSZ ceramics exhibit only two arcs, which correspond to the grain boundary effect and electrode effect, respectively. But the contribution from grain, grain boundary and electrode can still be detected in the LSO ceramic. It is important that the impedance of composite ceramic is much smaller than that of YSZ and LSO ceramics. For the similar size of all the studied samples, one can conclude that the conductivity has been improved by the composite process.
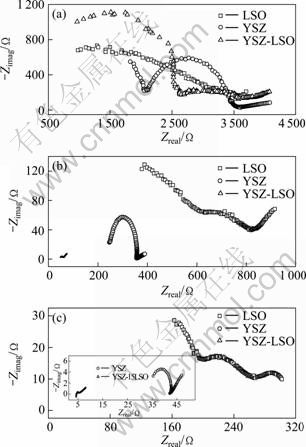
Fig. 4 Complex impedance plots of ceramics measured at various temperatures: (a) 400 °C; (b) 500 °C; (c) 600 °C
Figure 5 shows the temperature dependence of conductivity of YSZ, LSO and YSZ-LSO. It can be seen that the conductivities of YSZ-LSO composite ceramic are higher than those of the YSZ and LSO at the temperatures higher than 400 °C. The conductivity of the YSZ-LSO composite ceramic is 0.125 S/cm at 700 °C, showing about one order in magnitude higher than that of the YSZ ceramic (0.012 9 S/cm) and two orders in magnitude higher than that of the LSO ceramic (0.001 2 S/cm). These indicate that, combined with the results shown in Fig. 4, the conductivity improvement of the composite ceramic is not just resulted from the YSZ and LSO phases themselves, but some factors from the composite effect, for instance, interface effect, should play a key role in the conductivity enhancement.
In order to evaluate the interfacial effect originated from the composite process, the relationships between the impedance and frequency, and between the modulus and frequency, were analyzed. Figure 6 shows the impedance-frequency and modulus-frequency plots for YSZ, LSO and YSZ-LSO samples at 400, 500 and 600 °C, respectively. In order to present the variation tendency of M" and Z" with the increase of frequency, the ratios to its maximum modulus and impedance, M"/M"max and Z"/Z"max, respectively, are used in Fig. 6. Here, M" is the imaginary part of complex electric modulus, Z" is the imaginary part of complex impedance, and f is the frequency. The frequency ranges reflecting the gain effect, the grain boundary (interface) effect and the electrode effect are marked by Electrode, GB and G, respectively.
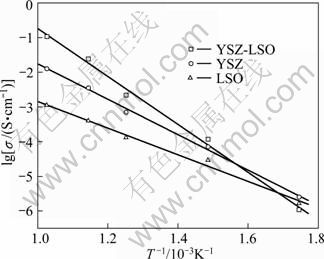
Fig. 5 Temperature dependence of conductivity in Arrhenius plots of all ceramics
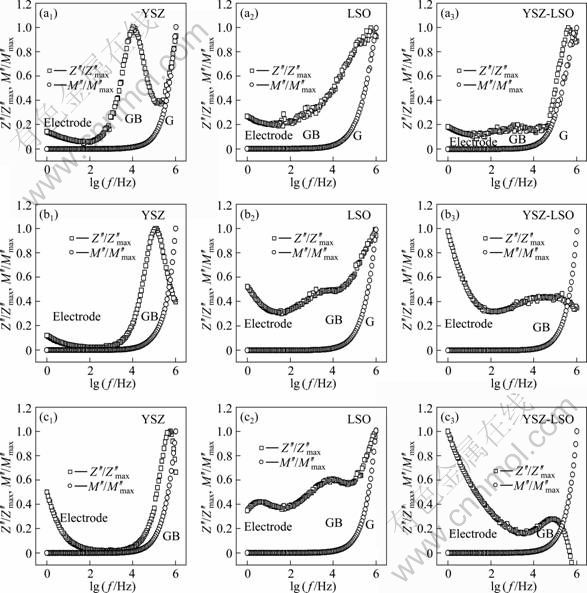
Fig. 6 Z′′/Z′′max and M′′/M′′max as function of logarithmic frequency of ceramics at various temperatures: (a) 400 °C; (b) 500 °C; (c) 600 °C
Figure 6(a) shows the impedance-frequency and modulus-frequency plots, at 400 °C, of the three samples, YSZ, LSO and YSZ-LSO. Two peaks related to the grain effect at high frequency range and the grain-boundary effect at intermediate frequency region can be seen in the impedance-frequency plots for the three samples, and one peak is found in the modulus-frequency plots for all the samples. It can be seen that the Z′′/Z′′max peak positions at higher frequency almost overlap their M′′/M′′max peaks. Generally, the conduction mechanism is considered to be the localized relaxation process if the impedance peak separates from that of the modulus one, and the conduction process changes from the localized relaxation process to a long-range conduction process when the peaks of impedance and modulus coincide or overlap each other [16]. When the temperatures increase, the Z′′/Z′′max peak positions related to grain boundary effect of all samples shift to higher frequency region. However, at higher temperatures, e.g. 500 °C (Fig. 6(b)) and 600 °C (Fig. 6(c)), the grain effect in YSZ and YSZ-LSO composite ceramics could not be detected for the limited measurement frequency. The spectra of the YSZ-LSO composite show different characteristics compared with those of YSZ and LSO. For the YSZ-LSO composite, the electrode polarization increases obviously and the grain boundary impedance decreases with the temperature increasing. The shifting rate toward the higher frequency region of the relaxation frequency of the composite ceramic is higher than that of the YSZ and LSO.
The relaxation frequency (f) of a material is determined by its conductivity and dielectric constant by the following relationship:
 (1)
(1)
where R and C represent the resistance and capacitance; t and A denote sample thickness and plate area; σ, ε0, εr and ε are the conductivity, dielectric constant in vacuum, relative dielectric constant and dielectric constant, respectively. The dielectric constant can be determined by the modulus as ε=M-1. According to the AC impedance measurements, the frequency dependence of dielectric constant of the YSZ and YSZ-LSO at various temperatures are plotted in Figs.7(a) and 7(b), respectively.
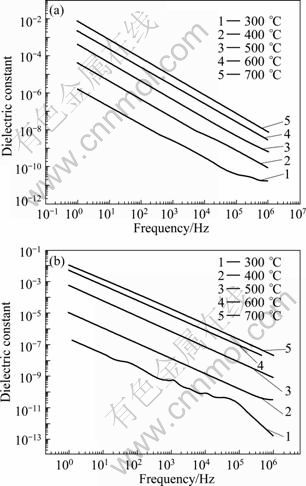
Fig. 7 Frequency dependence of dielectric constant at various temperatures of ceramics: (a) YSZ ceramic; (b) YSZ-LSO composite ceramic
One can see that the dielectric constants of the YSZ and YSZ-LSO ceramics are not a constant at various frequencies and change with temperature. The dielectric constant of each ceramic increases with the temperature increasing, and decreases with the frequency increasing. For the YSZ, the relaxation frequency f and dielectric constant ε are 10 100 Hz and 5.56×10⁻⁹, respectively, at 400 °C, and they change to 501 200 Hz and 8.09×10⁻⁹ at 600 °C, respectively. According to Eq. (4), the conductivity of YSZ increases by less than 2 orders in magnitude from 400 °C to 600 °C. However, for the YSZ-LSO composite ceramic, the f and ε are 1 270 Hz and 1.21×10⁻⁸, respectively, at 400 °C, and they change to 159 000 Hz and 1.31×10⁻⁷ at 600 °C, respectively. The conductivity of YSZ-LSO increases by about three orders in magnitude from 400 °C to 600 °C. Here, these relaxation frequencies are related to the grain boundaries or interfaces. So, one can get that interfacial effect plays an important role in the conductivity improvement by the composite process.
Generally, ionic transport parallel to grain boundaries or phase interfaces is strongly enhanced compared with that in the grains. The interfacial strain at grain boundary and heterophase interfaces is beneficial to ionic transport in the ionic conductors. In term of crystal structures, as analyzed in Fig. 2, the LSO phase has a hexagonal apatite structure, while YSZ has a cubic structure. For the much difference in crystalline structure and lattice parameters, severe crystal distortion and lots of defects can occur at the phase interfaces. On the other hand, the transport rate of an ion along the dislocation regions and/or the high defect-concentration interfaces is much higher than that in an ideal lattice. According to lattice parameters of the LSO and YSZ phases, the distinct mismatch occurs at the phase interfaces. In order to compensate the elastic strain, many misfit dislocations may occur and each misfit dislocation can act as a fast pipe-like transport path. These also indicate that the interfacial effect in the LSO-YSZ composite ceramic is one of the important mechanisms for the conductivity improvement.
4 Conclusions
Zr0.85Y0.15O1.925-La9.33Si6O26 composite powders with 15% (mass fraction) of La9.33Si6O26 were prepared by using a modified coprecipitation method, and dense composite ceramics were obtained after sintering at 1 500 °C for 2 h. At temperatures higher than 400 °C, the composite ceramic shows higher conductivities than those of the single phase Zr0.85Y0.15O1.92 and La9.33Si6O26 ceramics. The conductivity of the composite ceramic is 0.125 S/cm at 700 °C, and is one order in magnitude higher than that of Zr0.85Y0.15O1.92 ceramic and two orders in magnitude higher than that of La9.33Si6O26. The interfacial effect is proposed to play an important role in the conductivity improvement. The present work indicates that the composite technology is an effective way to enhance the conductivity of solid state electrolytes.
References
[1] STEELE B C H. Fuel-cell technology: Running on natural gas [J]. Nature, 1999, 400(6861): 619-621.
[2] MINH N Q. Solid oxide fuel cell technology-features and applications [J]. Solid State Ionics, 2004, 174(1/4): 271-277.
[3] ZHOU Hai-tao, ZHANG Hong, LI Zhi-cheng. Preparation and conductivity of the nano-composite La9.33Si6O26/Ce0.85Bi0.15O1.925 oxygen ionic conductor [J]. Journal of Central South University: Science and Technology, 2009, 40(5): 1265-1269. (in Chinese)
[4] GARCIA-BARRIOCANAL J, RIVERA-CALZADA A, VARELA M, SEFRIOUI Z, IBORRA E, LEON C, PENNYCOOK S J, SABTAMARIA J. Colossal ionic conductivity at interfaces of epitaxial ZrO2:Y2O3/SrTiO3 heterostructures [J]. Science, 2008, 321(5889): 676-680.
[5] AZAD S, MARINA O A, WANG C M, SARAF L, SHUTTHANANDAN V, MCCREADY D E, EL-AZAB A, JAFFE J E, ENGELHARD M H, PEDEN C H F, THEVUTHASAN S. Nanoscale effects on ion conductance of layer-by-layer structures of gadolinia-doped ceria and zirconia [J]. Applied Physics Letters, 2005, 86(13): 131906-8.
[6] WANG C M, ENGELHARD H M, AZAD S, SARAF L V, MCDREADY D E, SHUTTHANANDAN V, YU Z Q, THEVUTHASAN S, WATANABE M, WILLIAMS D B. Distribution of oxygen vacancies and gadolinium dopants in ZrO2-CeO2 multi-layer films grown on α-Al2O3 [J]. Solid State Ionics, 2006, 177(15/16): 1299-1306.
[7] ZHANG Hong, ZHANG Zhe, MA Guo-qiang, ZHANG Yu-xing, LI Zhi-cheng. Coprecipitation synthesis and oxide ionic on ductivities of Ce0.8Sm0.2O1.9-based nanocomposite materials [J]. Journal Inorganic Materials, 2009, 24(2): 353-356. (in Chinese)
[8] XIA Jun-xiao, ZHANG Hong, LI Ya-ling, LIU Chao-feng, LI Zhi-cheng. Preparation and conductivities of Ce0.8Sm0.2O1.9- La0.9Sr0.1Ga0.8Mg0.2O2.85 composite materials [J]. Journal of Central South University: Science and Technology, (accepted). (in Chinese)
[9] MIZUTANI Y, TAMURA M, KAWAI M. Development of high-performance electrolyte in SOFC [J]. Solid State Ionics, 1994, 72(2): 271-275.
[10] WANG Qi-gen, PENG Ran-ran, XIA Chang-rong, ZHU Wei, WANG Huan-ting. Characteristics of YSZ synthesized with a glycine-nitrate process [J]. Ceramics International, 2008, 34(7): 1773-1778.
[11] SHAULA A L, KHARTON V V, WAERENBORGH J C, ROJAS D P, MARQUES F M B. Oxygen ionic and electronic transport in apatite ceramics [J]. Journal of the EuropeanCeramicSociety, 2005, 25(12): 2583-2586.
[12] ZHANG Hong, LI Zhi-cheng, BERGMAN B, ZOU Xiao-dong. Investigation of La9.33Si6O26 oxygen ionic conductor [J]. Journal of MaterialsScience and Technology, 2007, 23(5): 629-632.
[13] BECHADE E, JULIEN I, IWATA T, MASSON O, THOMAS P, CHAMPION E, FUKUDA K. Synthesis of lanthanum silicate oxyapatite materials as a solid oxide fuel cell electrolyte [J]. Journal of the EuropeanCeramicSociety, 2008, 28(14): 2717-2724.
[14] TIAN C G, LIU J L, CAI J, ZENG Y W. Direct synthesis of La9.33Si6O26 ultrafine powder via sol-gel self-combustion method [J]. Journal ofAlloysand Compounds, 2008, 458(1/2): 378-382.
[15] BANERJEE S, DEVI P S, TOPWAL D, MANDAL S, MENON K. Enhanced ionic conductivity in Ce0.8Sm0.2O1.9: Unique effect of calcium co-doping [J]. AdvancedFunctionalMaterials, 2007, 17(15): 2847-2854.
[16] GERHARDT R. Impedance and dielectric spectroscopy revisited: Distinguishing localized relaxation from long-range conductivity [J]. Journal of Physics and Chemistry ofSolids, 1994, 55(12): 1491-1506.
(Edited by YANG Bing)
Foundation item: Project(50872155) supported by the National Natural Science Foundation of China
Received date: 2010-12-24; Accepted date: 2011-05-04
Corresponding author: LI Zhi-cheng, Professor, PhD; Tel: +86-731-88877740; E-mail: zhchli@mail.csu.edu.cn

