Development and evaluation of whole-genome oligonucleotide array for Acidithiobacillus ferrooxidans ATCC 23270
��Դ�ڿ����й���ɫ����ѧ��(Ӣ�İ�)2008���6��
�������ߣ���Ǭ ���� ���� ����Ⱥ ������ ����� ��ѧ��
����ҳ�룺1343 - 1351
Key words��whole-genome oligonucleotide array(WGA); A. ferrooxidans ATCC 23270; specificity; sensitivity; quantification
Abstract: To effectively monitor the characteristic of Acidithiobacillus ferrooxidans ATCC 23270 at the whole-genomic level, a whole-genome 50-mer-based oligonucleotide microarray was developed based on the 3 217 ORFs of A. ferrooxidans ATCC 23270 genome. Based on artificial oligonucleotide probes, the results showed that the optimal hybridization temperature was 45 ��. Specificity tests with the purified PCR amplifications of 5 genes (Sulfide-quinone reductase, Cytochrome C, Iron oxidase, Mercuric resistance protein, Nitrogenase iron protein) of A. ferrooxidans ATCC 23270 indicated that the probes on the arrays appeared to be specific to their corresponding target genes. Based on the WGA hybridization to global transcriptional difference of A. ferrooxidans ATCC 23270 strains cultured with Fe(��) and S(0), the developed 50-mer WGA could be used for global transcriptome analysis of A. ferrooxidans ATCC 23270. The detection limit was estimated to be approximately 5 ng with the genomic DNA, and at 100 ng of the DNA concentration, all of the signals reached the saturation. In addition, strong linear relationships were observed between hybridization signal intensity and the target DNA concentrations (r2=0.977 and 0.992). The results indicated that this technology had potential as a specific, sensitive and quantitative tool for detection and identification of the strain A. ferrooxidans ATCC 23270 at the whole-genome level.
������Ϣ��the National Natural Science Foundation of China
by the National Basic Research Program of China

LI Qian(�� Ǭ), SHEN Li(�� ��), LUO Hai-lang(����), YIN Hua-qun(����Ⱥ),
LIAO Li-qin(������), QIU Guan-zhou(�����), LIU Xue-duan(��ѧ��)
Key Laboratory of Biometallurgy of Ministry of Education,
School of Minerals Processing and Bioengineering, Central South University, Changsha 410083, China
Received 20 September 2008; accepted 5 November 2008
Abstract: To effectively monitor the characteristic of Acidithiobacillus ferrooxidans ATCC 23270 at the whole-genomic level, a whole-genome 50-mer-based oligonucleotide microarray was developed based on the 3 217 ORFs of A. ferrooxidans ATCC 23270 genome. Based on artificial oligonucleotide probes, the results showed that the optimal hybridization temperature was 45 ��. Specificity tests with the purified PCR amplifications of 5 genes (Sulfide-quinone reductase, Cytochrome C, Iron oxidase, Mercuric resistance protein, Nitrogenase iron protein) of A. ferrooxidans ATCC 23270 indicated that the probes on the arrays appeared to be specific to their corresponding target genes. Based on the WGA hybridization to global transcriptional difference of A. ferrooxidans ATCC 23270 strains cultured with Fe(��) and S(0), the developed 50-mer WGA could be used for global transcriptome analysis of A. ferrooxidans ATCC 23270. The detection limit was estimated to be approximately 5 ng with the genomic DNA, and at 100 ng of the DNA concentration, all of the signals reached the saturation. In addition, strong linear relationships were observed between hybridization signal intensity and the target DNA concentrations (r2=0.977 and 0.992). The results indicated that this technology had potential as a specific, sensitive and quantitative tool for detection and identification of the strain A. ferrooxidans ATCC 23270 at the whole-genome level.
Key words: whole-genome oligonucleotide array(WGA); A. ferrooxidans ATCC 23270; specificity; sensitivity; quantification
1 Introduction
Acidithiobacillus ferrooxidans (A. ferrooxidans) is acidophilic, chemolithoautotrophic, and Gram-negative bacterium. It is a well known bioleaching bacterium responsible for solubilizing metals from ores. Now it is widely used as a valuable tool in the biomining industry [1].
In order to improve the bioleaching efficiency of A. ferrooxidans, and to rapidly screen A. ferrooxidans strains with high oxidation capacity, understanding the global biological processes of A. ferrooxidans strains at the whole-genome level and analyzing their global transcriptome are of the utmost importance. The development and application of nuclear acid-based techniques, such as small subunit(SSU) rRNA gene- based cloning methods, denatured gradient gel electrophoresis(DGGE), terminal restriction fragment length polymorphism(T-RFLP), quantitative PCR, in-situ hybridization and PCR amplification, can provide detailed descriptions of some genes in microorganisms [2-3]. These techniques, however, lack the high- through-put capacity and global resolution to biological processes.
In the recent years, microarray technology has been reasonably well established for studies of microbial pure cultures in well-defined laboratory settings[4-5]. With its advantages of high-through-put, high sensitivity and low cost, the application of microarray to investigate the whole genome of microbial strains has received much attention[6]. Several types of microarray, such as phylogenetic oligonucleotide arrays(POAs), functional gene arrays(FGAs) and community genome arrays (CGAs), have been developed[3,6-9]. Recently, the whole-genome oligonucleotide microarray(WGA) emerged in a novel way, showing tremendous potential. It provided a large capacity and comprehensive analysis for global genome, served as a powerful tool for global genomic analysis, and monitored the activities of functional genes and process both in basic and applied environmental sciences[10]. For example, it has already been used to characterize the global transcriptomes of bacteria under different growth conditions and environmental stresses[11-16]. Also, it has been employed to analyze the interactions among different microbial species and their host organisms[17-20].
In this work, A. ferrooxidans ATCC 23270 was selected as the model microbe of A. ferrooxidans strains, and the whole-genome oligonucleotide array was constructed based on 3 217 ORFs of A. ferrooxidans ATCC 23270 genome, and 20 ORFs of human and plant as negative control.
2 Experimental
2.1 Bacterial strains, cultivation and samples collec- tion
A. ferrooxidans ATCC 23270 was obtained from American Type Culture Collection (ATCC), and cultivated with S(0) (10.0 g/L) or FeSO4 (44.7 g/L) in the culture medium (0.5 g/L MgSO4��7H2O, 3.0 g/L (NH4)2SO4, 0.5 g/L K2HPO4, 0.1 g/L KCl and 0.01g/L Ca(NO3)2, sterilized at 120 �� for 20 min) under the oxic condition at 170 r/min (in the rotary platform), pH 2.3 and 30 ��.
The cells in the middle growth phase (48 h) were harvested by centrifugation at speed of 10 000 r/min, 4 �� with 5804R centrifuge (Eppendorf, Wesbury, NY, USA), then frozen quickly, stored at -70 �� before simultaneous extraction of RNA and DNA.
2.2 Nucleic acid extraction and quantification
Genomic DNA was extracted using a TIANamp Bacteria DNA kit (Tiangen, Beijing, China), and total RNA was extracted using TRIzol reagent (Invitrogen, Carlsbad, USA) and then treated with RNase-free DNase I(QIAGEN, Carlsbad, USA) to digest residual chromosomal DNA and subsequently purified with an RNeasy kit (Qiagen, Valencia, USA).
DNA from pure culture was quantified at OD260 and OD280 with a NanoDrop ND-1000 spectrophoto- meter (NanoDrop Technologies, Wilmington, USA). The quality of RNA extracted from pure culture was checked using agarose gel electrophoresis. Intactness of 16S and 28S rRNA bands on the gel was used as the indicator of RNA quality.
2.3 Oligonucleotide probe (50-mer) design
The genome sequences of A. ferrooxidans ATCC 23270 were downloaded from Comprehensive Microbial Resource(CMR) of TIGR (http://www.tigr.org/). The 50-mer oligonucleotide probes were designed using the software PRIMEGENS[21] with modified parameters. To design 50-mer oligonucleotide probes, each individual gene sequence was compared with the entire downloaded sequence database using pairwise BLAST and aligned with the other sequences using dynamic programming. Based on these global optimal alignments, segments of 50-mer with ��85% nucleotide identity to the corresponding aligned regions of any of BLAST hit sequences were selected as potential probes. In this process, stretches of matches between aligned regions were considered. Probes with ��15 bp matching stretches were removed from the potential probes[22]. Among the identified potential probes, one was finally selected by considering melting point and self-complementarity. About 10% of the probes selected were searched against the GenBank database and proved to be unique in the database.
To use the above-mentioned method, a total of 3 237 oligonucleotide probes were designed according to the whole 3 217 genes of A. ferrooxidans ATCC 23270 and 20 genes of human and plant (as negative control).
2.4 Microarray construction
The designed oligonucleotide probes were synthesized without modification by Sangon Biotech, Co., Ltd (Shanghai, China), in 96-well plate format. The oligonucleotides were diluted to final concentration of 50 pmol/��L with 50% dimethyl sulfoxide (Sigma, St. Louis, USA). Ten microliters of each probe were transferred to 384-well microplate for printing. The probes were arrayed in OmniGrid Accent Arraying System (Genomic Solutions, Inc., USA) with eight pins (Chipmaker 3; Telechem International, Inc., Sunnyvale, USA) at a spacing of 250 ��m onto 25 mm��75 mm amino silane-coated UltraGAPS glass slides (Corning, USA) at 55%-58% relative humidity. Each probe was set to be printed three times on different part of slide. Then these slides were air dried overnight at room temperature, cross-linked using an ultraviolet(UV) Stratalinker 1800 (Stratagene, USA) by exposing the slides to 60 mJ doses of UV irradiation, and stored in a clean slide box at room temperature.
2.5 Fluorescent labeling of target DNA and RNA
Two methods were used to fluorescently label DNA. For genomic DNA labeling, BioPrime DNA Labeling kit (Invitrogen) was used as the following steps: genomic DNA was mixed with 15 ��g of random primer, denatured by boiled water for 2 min, and immediately chilled on ice. The denatured genomic-DNA solution was mixed with 15 mL labeling reaction solution (5 mmol/L (each) dATP, dTTP, and dGTP; 2.5 mmol/L dCTP (New England Biolabs, Beverly, Mass); 1 mmol/L Cy3 dUTP (Amersham Pharmacia Biotech, Piscataway, USA); and 40 U of Klenow fragment (Invitrogen)), then incubated at 37 �� for 3 h. The labeled target DNA was purified using a QIAquick PCR purification column (Qiagen), concentrated in speedvac at 45 �� for 30 min, and resuspended in an appropriate volume of distilled water.
For PCR product labeling, each gene was amplified using gene-specific primers. The PCR amplification conditions were as follows: 94 �� for 5 min for 1 cycle; 94 �� for 45 s, 55 �� for 45 s, and 72 �� for 90 s for 30 cycles; then 72 �� for 10 min for 1 cycle. After purification with a QIAquick PCR purification column (Qiagen), 1 ng of PCR product was labeled using random primer.
Labeled DNA template was produced from RNA with Cy3 or Cy5 using reverse transcription. First, 5 ��g of total RNA was mixed with 10 ��g of random primer in a 16.5 ��L volume, incubated at 70 �� for 5 min, and chilled on ice. RNA was labeled by mixing with 13.5 ��L of labeling solution (10 mmol/L (each) dATP, dGTP, and dCTP; 0.5 mmol/L dTTP; 3 ��L of 0.1 mol/L dithiothreitol; 40 U of RNase inhibitor (Gibco BRL and Invitrogen); 1 mmol/L Cy3-dUTP or Cy5 dUTP (Perkin- Elmer/NEN Life Science Products, Boston, Mass); and 200 U of Superscript RNase H- reverse transcriptase in 1��First Strand buffer). Two different dyes (Cy3-dUTP and Cy5-dUTP) were used for labeling RNAs from treated and controlled samples, respectively.
2.6 Hybridization
All hybridizations were carried out in triplicate. Each hybridization solution (total standard volume 30 ��L) contained denatured fluorescently labeled genomic DNA, 50% (volume fraction) formamide, 3��SSC (1��SSC contained 150 mmol/L NaCl and 15 mmol/L sodium citrate), 2 ��g of unlabeled herring sperm DNA (Promega, USA), and 0.3% sodium dodecyl sulfate (SDS). The hybridization solution was denatured at 95 �� for 5 min. After heat denaturation, the hybridization solution was kept at 60 �� before hybridization. The hybridization mixture was deposited directly onto the slides, which were preheated to 60 ��, covered with a coverslip, and dispensed with 17.5 ��L of 3��SSC into the hydration wells on each side of the micro-array slide. And then the microarrays were placed into a hybridization chamber (Corning, USA), and plunged into the preheated water bath immediately for 10-12 h hybridization. Each microarray slide was taken out, and the coverslip was immediately removed in preheated washing buffer (1��SSC-0.2% SDS) and then washed sequentially for 5 min in 1��SSC-0.2% SDS, for 10 min in 0.1��SSC-0.2% SDS and for 30 s in 0.1��SSC at ambient temperature before being dried. At last the slides were dried using centrifugation.
2.7 Image processing and data analysis
The microarrays were scanned with a ScanArray 4100 Microarray Analysis system (AXON instruments, Inc, USA) at a resolution of 10 ��m. The emitted fluorescent signal was detected by a photomultiplier tube (PMT) at 532 nm (Cy3) or 635 nm (Cy5). For detection sensitivity experiments, the laser power and photomultiplier tube (PMT) gain were both 100%. For all other experiments, the laser power and PMT gain were adjusted to avoid saturation of spots.
The scanned images were saved as 16-bit TIFF files, and each spot was quantified by the software of GenePix Pro version 6.0 (AXON instruments, Inc, USA). A grid of individual circles defining the location of each DNA spot on the array was superimposed on the image to designate each fluorescent spot to be quantified. The mean signal intensity was determined for each spot. The poor quality spots were flagged and removed, the data sheet from GenePix Pro was then exported to Excel for further processing. The local background signal was subtracted automatically from the hybridization signal for each spot. The signal-to-noise ratio(SNR) was also calculated based on the following formula[23]:
R=(Is-Ib)/Db
where Is and Ib are intensities of signal and local spot background, respectively; and Db is the standard deviation of background.
The standard deviation of background was calculated across all pixels measured by the GenePix Pro software. The SNRs from nine replicate data sets were then averaged to represent the SNR for a particular probe. Spots that appeared to be lower than the threshold value were also removed from the data set for further analysis. A commonly accepted criterion for the minimum signal (threshold) that can be accurately quantified is an SNR of ��3[23].
For the hybridizations in which two fluorescent dyes (Cy3 and Cy5) were used simultaneously in hybridization, the signal intensity for each spot was normalized based on the signal intensity of the human control genes (1 ng) spiked equally prior to labeling. The signal ratios of Cy5 to Cy3 for the three human genes were calculated and averaged. The signal intensity for each spot from the Cy5 channel was then multiplied by the averaged Cy3/Cy5 signal ratio for human genes to obtain corrected Cy5 signals for individual hybridization spot.
3 Results and discussion
3.1 Effect of hybridization temperature on signal intensity
In order to figure out the optimal hybridization temperature, it is important to understand how the hybridization temperature affects hybridization signal. Therefore, microarray hybridizations were conducted at 40, 45, 50, 55, 60, and 65 �� by using Cy3 labeled genomic DNA from pure culture of A. ferrooxidans ATCC 23270 as the target template. The relationship of signal intensity with temperature was fitted with nonlinear statistical models, and the calculated hybridization intensities based on the fitted nonlinear models were then plotted against hybridization temperatures (Fig.1(b)). All of the experimental data fit the nonlinear models, as an evidence from the determination coefficient values (r2=0.882). As shown in Fig.1(b), signal intensity decreased as the hybridization temperature increased. At 40 ��, the signal intensity was the highest but an obvious negative control hybridization was observed (Fig.1(a)). At 45 ��, all of the oligonucleotide probes hybridized well with the labeled target template (ATCC 23270T), and no negative control hybridization was observed. In contrast, at 50 ��, the signal intensity of several plots was very weak (R��3). At 60 or 65 ��, the number of the hybridization plots with SNR less than 3 was increased dramatically, and the signal intensity decreased rapidly. Therefore, the temperature in the hybridization solution clearly had an obvious impact on hybridization specificity and sensitivity, and the optimal hybridization temperature was 45 ��. Based on these results, the hybridization temperature of 45 �� was used in the later experiments.
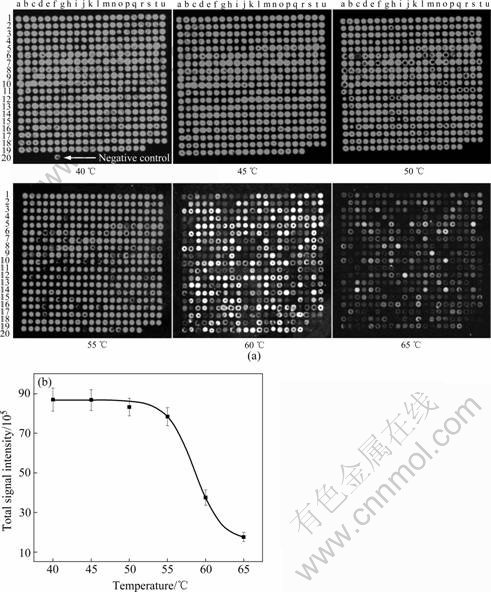
Fig.1 Effect of temperature on signal intensity for genomic DNA of A. ferrooxidans ATCC 23270: (a) Fluorescence images showing improvement in array hybridization effect with increasing temperature (Signal in first image for negative control hybridization is indicated by white arrow); (b) Correlation between signal intensity and temperature
3.2 Specificity of WGA Hybridization
Specificity is one of the most crucial and valuable parameters in the whole-genome oligonucleotide array assays. To obtain more accurate results, the probe must be highly specific to the target genes. First, because oligonucleotide-based microarrays have the advantage of minimizing the potentially confounding effects of cross-hybridization[24], short oligonucleotide probes generally offer greater specificity than cDNA or PCR products to distinguish single-nucleotide-polymorphism (SNP). However, it is noted that short oligonucleotide probes often have poor hybridization properties and much lower resulting signal intensities than long oligonucleotides (��30 nt) [25-27]. On the contrary, as the length of oligonucleotide probes increase, specificity is lost[28]. Therefore, in this work, the 50-mer olionucleotide probes was used to construct the microarray. Second, since probes having continuous sequence stretches longer than 15-mer identical to the nontarget sequences may cause cross-hybridization problems[29], such probes were removed after being designed. Also, high stringent hybridization conditions permit the detection of more specific genes and minimize potential cross-hybridization, so it is important for hybridization under the optimal condition. Results showed that the optimal condition for hybridization on WGA was at 45 �� in the presence of 50% formamide. Finally, nonspecific hybridization could be significant when the microarray slides were not warmed or the hybridization mixture was remained at room temperature for several minutes after hybridization and before washing[30]. To minimize potential nonspecific hybridization, the slides should be preheated and the hybridization mixture should be kept above the hybridization temperature through all hybridization steps prior to washing.
To determine the specificity of microarray hybridization, the purified PCR amplifications of 5 genes (Sulfide-quinone reductase, Cytochrome C, Iron oxidase, Mercuric resistance protein, Nitrogenase iron protein) of A. ferrooxidans ATCC 23270 were mixed and employed as target templates, then randomly labeled with Cy3 and hybridized to the WGA at 45�� in triplicate. As expected, strong hybridization signals were obtained for the corresponding probes to the labeled target (Fig.2). Little or no cross-hybridization was observed for non-target genes as well as for negative controls, indicating that specific hybridizations can be achieved with the WGA under the optimized conditions.

Fig.2 Hybridization specificity of whole-genome oligonucleotide array of A. ferrooxidans ATCC 23270
Specificity of the WGA hybridized with diverse genes showed only little cross-hybridization, and it would be interesting to investigate genomic difference between A. ferrooxidans strains and their global transcriptional profile.
3.3 Transcriptional difference of A. ferrooxidans ATCC 23270 strains cultured with Fe(��) and S(0) by WGA hybridization
To determine whether the whole-genome 50-mer- oligonucleotide array can be used to monitor the functional activities of the genes interest, mRNA-based gene expression was examined with difference in A. ferrooxidans ATCC 23270 strains cultured with Fe(��) and elementary substance S(0). The mRNA from strain A. ferrooxidans ATCC 23270 incubated with Fe(��) was randomly labeled by Cy5, and the mRNA from the strain cultured with S(0) was randomly labeled by Cy3, and then mixed and hybridized with the WGA at 45 �� as described above. As expected, for the strain incubated in the presence of Fe(��), strong hybridization signals were obtained for the known genes involved in iron metabolism but not for sulfur metabolism (Fig.3). At the same time, for the strain cultured in the presence of S(0), strong hybridization signals were observed for the known genes involved in sulfur metabolism but not for iron metabolism. Also, some strong hybridization signals were obtained for some genes (e.g.16S rRNA gene) highly expressed under both growth conditions. However, additional genes detected were not expressed under both conditions (Fig.3). These results indicated that the developed 50-mer WGA could be used to monitor mRNA-based functional activities of A. ferrooxidans ATCC 23270 at the whole-genome level, then to monitor quickly and reliably high-active functional genes for biomining, and further to screen out the efficient strains for bioleaching.

Fig.3 Detection of transcriptome in A. ferrooxidans ATCC 23270 strains cultured with Fe(��) and S(0) by WGA hybridization
3.4 Detection sensitivity and quantification potential of WGA hybridization
Sensitivity is another critical parameter that affects the effectiveness of WGA-based approach for detecting genes. The capacity of the WGA hybridization serving as a quantitative tool was explored and its detection sensitivity was determined by using genomic DNA extracted from pure culture of A. ferrooxidans ATCC 23270. Genomic DNA (at concentrations of 0.5, 1, 5, 10, 25, 50, 100, 250, 500, 1 000, 1 500, and 2 000 ng) was randomly labeled by Cy3 and hybridized with the WGA at 45 �� for 10-12 h. From Fig.4, it can be seen that strong hybridization signals were observed with 100-2000 ng of genomic DNA and there was little difference among them, while hybridization signals became gradually less and weaker with 5-50 ng of genomic DNA, and at concentration of 1 ng, only 3 hybridization signals could be detected. Hybridization signals using 0.5 ng of genomic DNA, however, were barely detectable above background levels. Therefore, the detection limit with randomly labeled pure A. ferrooxidans ATCC 23270 DNA under these hybridization conditions was estimated to be approximately 5 ng. With 100 ng of genomic DNA, the signal intensity was close to saturation.
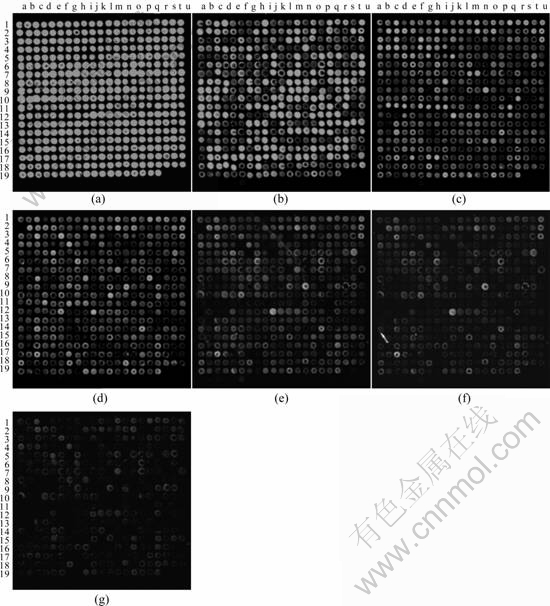
Fig.4 Detection sensitivity of whole-genome oligonucleotide array hybridization to A. ferrooxidans ATCC 23270: (a) 100 ng; (b) 50 ng; (c) 25 ng; (d) 10 ng; (e) 5 ng; (f) 1 ng; (g) 0.5 ng
The fluorescence intensities obtained at each DNA concentration for nine data points (three independent microarrays with three replicates on each slide) were averaged. By comparing the logarithmic value of the concentration with the corresponding logarithmic value of the mean fluorescence intensity (data not shown), strong linear relationships were observed for signal intensity and DNA concentrations ranging from 0.5 to 100 ng, such as a significant linear relationship for Cytochrome C gene (r2=0.977, P��0.01�� (Fig.5(a)). Strong linear relationships were also observed between the total signal intensity and DNA concentrations from 0.5 to 100 ng (r2=0.992, P��0.01) (Fig.5(b)). In addition, little change of signal intensity was observed for DNA concentrations from 100 to 2 000 ng. These results indicated that the WGA hybridization was quantitative for pure culture of A. ferrooxidans ATCC 23270 within a certain range of DNA concentration.

Fig.5 Evaluation of quantitative potential of whole-genome oligonucleotide array of A. ferrooxidans ATCC 23270: (a) Quantitative relationship between signal intensity of Cytochrome C gene hybridization and genomic DNA concentration; (b) Correlation of total signal intensity and genomic DNA concentration
However, it is uncertain that the relationship between the signal intensity where the WGA was hybridized with the genomic DNA from other A. ferrooxidans strains and target DNA concentration is whether or not so strongly linear. Moreover, the accuracy of microarray-based quantitative assessments is uncertain due to inherent variations associated with array fabrica- tion, labeling, target concentration, and scanning[31]. Also, like the 50-mer-based FGA hybridization [32-33], the quantitative accuracy of the whole-genome 50-mer oligonucleotide array hybridization will depend on probe specificity. To obtain more accurate results, the probe must be highly specific to the target genes. Any cross-hybridization from other genes could distort quantification. Because very low cross-hybridization was observed among different genes examined with the WGA, it is expected that WGA-based hybridization will be quantitative for genes at the whole-genome level.
4 Conclusions
1) To effectively monitor the characteristic of Acidithiobacillus ferrooxidans ATCC 23270 at the whole-genomic level, a whole-genome 50-mer-based oligonucleotide microarray was developed based on the 3 217 ORFs of A. ferrooxidans ATCC 23270 genome. Based on artificial oligonucleotide probes, results showed that the optimal hybridization temperature was 45 ��.
2) Specificity tests with purified PCR amplifications of 5 genes (Sulfide-quinone reductase, Cytochrome C, Iron oxidase, Mercuric resistance protein, Nitrogenase iron protein) of A. ferrooxidans ATCC 23270 indicated that the probes on the arrays appeared to be specific to their corresponding target genes.
3) Based on the WGA hybridization to global transcriptional difference in A. ferrooxidans ATCC 23270 strains cultured with Fe(��) and S(0), the results indicated the developed 50-mer WGA could be used for global transcriptome analysis of A. ferrooxidans ATCC 23270.
4) The detection limit was estimated to be approximately 5 ng with the genomic DNA, and at 100 ng of the DNA concentration, all of the signals reached saturation. In addition, strong linear relationships were observed between hybridization signal intensity and the target DNA concentrations (r2=0.977 and 0.992).
5) The results indicated that this technology had potential as a specific, sensitive and quantitative tool for detection and identification of the global genomic and transcriptional identification to the strain A. ferrooxidans ATCC 23270.
References
[1] Yarzabal A, Duquesne K, Bonnefoy V. Rusticyanin gene expression of Acidithiobacillus ferrooxidans ATCC 33020 in sulfur- and in ferrous iron media [J]. Hydrometallurgy, 2003, 71(1/2): 107-114.
[2] DEDYSH S N, PANKRATOV T A, BELOVA S E, KULICHEVSKAYA S, LIESACK W. Phylogenetic analysis and in situ identification of Bacteria community composition in an acidic Sphagnum peat bog [J]. Applied and Environmental Microbiology, 2006, 72(3): 2110-2117.
[3] WU Li-you, THOMPSON D K, LIU Xue-duan, FIELDS M W, BAGWELL C E , TIEDJE J M, ZHOU Ji-zhong. Development and evaluation of microarray-based whole-genome hybridization for detection of microorganisms within the context of environmental applications [J]. Environmental Science and Technology, 2004, 38(24): 6775-6782.
[4] Ye R W, Wang Tao, Bedzyk L, Croker K M. Applications of DNA microarrays in microbial systems [J]. Journal of Microbiological Methods, 2001, 47(3): 257-272.
[5] Draghici S, Khatri P, Eklund A C, Szallasi Z. Reliability and reproducibility issues in DNA microarray measurements [J]. Trends in Genetics, 2006, 22(2): 101-109.
[6] ZHOU Ji-zhong, THOMPSON D K. Challenges in applying microarrays to environmental studies [J]. Current Opinion in Biotechnology, 2002, 13(3): 204-207.
[7] Wu Li-you, Thompson D K, Li Guang-shan, Hurt R A, Tiedje J M, Zhou Ji-zhong. Development and evaluation of functional gene arrays for detection of selected genes in the environment [J]. Applied and Environmental Microbiology, 2001, 67(12): 5780-5790.
[8] Rhee S K, Liu Xue-duan, Wu Li-you, Chong S C, Wan Xiu-feng, Zhou Ji-zhong. Detection of genes involved in biodegradation and biotransformation in microbial communities by using 50-mer oligonucleotide microarrays [J]. Applied and Environmental Microbiology, 2004, 70(7): 4303-4317.
[9] Gentry T J, Wickham G S, Schadt C W, He Z L, Zhou J Z. Microarray applications in microbial ecology research [J]. Microbial Ecology, 2006, 52(2): 159-175.
[10] Mockler T C, Ecker J R. Applications of DNA tiling arrays for whole-genome analysis [J]. Genomics, 2005, 85(1): 1-15.
[11] Mendes-Ferreira A, Olmo M D, Garcia-Martinez J, Jim��nez-Mart�� E, Mendes-Faia A, Perez-Ortin J, Le?o C. Transcriptional response of Saccharomyces cerevisiae to different nitrogen concentrations during alcoholic fermentation [J]. Applied and Environmental Microbiology, 2007, 73(16): 3049-3060.
[12] Gao Hai-chun, Wang Yue, Liu Xue-duan, Yan Ting-fen, Wu Li-you, Alm E, Arkin A, Thompson D K, Zhou Ji-zhong. Global transcriptome analysis of the heat shock response of Shewanella oneidensis [J]. Journal of Bacteriology, 2004, 186(22): 7796-7803.
[13] Fisher M. A., Plikaytis B B, Shinnick T M. Microarray analysis of the Mycobacterium tuberculosis transcriptional response to the acidic conditions found in phagosomes [J]. Journal of Bacteriology, 2002, 184(14): 4025-4032.
[14] Helmann J D, Wu Ming-fang, Kobel P A, Gamo F J, Wilson M, Morshedi M M, Navre M, Paddon C. Global transcriptional response of Bacillus subtilis to heat shock [J]. Journal of Bacteriology, 2001, 183(24): 7318-7328.
[15] Reichert K, Menzel R. Expression profiling of five different xenobiotics using a Caenorhabditis elegans whole genome microarray [J]. Chemosphere, 2005, 61(2): 229-237.
[16] Smoot L M, Smoot J C, Graham M R, Somerville G A, Sturdevant D E, Migliaccio C A, Sylva G L, Musser J M. Global differential gene expression in response to growth temperature alteration in group A Streptococcus [J]. PNAS, 2001, 98(18): 10416-10421.
[17] BARNETT M J, TOMAN C J, FISHER R F, LONG S R. A dual-genome Symbiosis Chip for coordinate study of signal exchange and development in a prokaryote�Chost interaction [J]. PNAS, 2004, 101(47): 16636-16641.
[18] Marathe R, Guan Zhong, Anandalakshmi R, ZHAO Hong-yu, DINESH-KUMAR S P. Study of Arabidopsis thaliana resistome in response to cucumber mosaic virus infection using whole genome microarray [J]. Plant Molecular Biology, 2004, 55(4): 501-520.
[19] Holzer T R, McMaster W R, Forney J D. Expression profiling by whole-genome interspecies microarray hybridization reveals differential gene expression in procyclic promastigotes, lesion-derived amastigotes, and axenic amastigotes in Leishmania mexicana [J]. Molecular and Biochemical Parasitology, 2006, 146(2): 198-218.
[20] Scholten J C M, Culley D E, Nie L, Munn K J, Chow L, Brockman F J, Zhang Weiwen. Development and assessment of whole-genome oligonucleotide microarrays to analyze an anaerobic microbial community and its responses to oxidative stress [J]. Biochemical and Biophysical Research Communications, 2007, 358(2): 571-577.
[21] Xu Dong, Li G.ary, Wu Li-you, Zhou Ji-zhong, Xu Ying. PRIMEGENS: A computer program for robust and efficient design of gene-specific targets on microarrays [J]. Bioinformatics, 2002, 18(11): 1432-1437.
[22] Kane M D, Jatkoe T A, Stumpt C R, Liu Jia, Thomas J D, Madore S J. Assessment of the sensitivity and specificity of oligonucleotide (50mer) microarrays [J]. Nucleic Acid Research, 2000, 28(22): 4552-4557.
[23] Verdick D, Handran S, Pickett S. DNA array image analysis: Nuts and bolts [M]. Salem, MA: DNA Press LLC, 2002: 83-98.
[24] Wodicka L, Dong He-lin, Mittmann M, Ho M H, Lockhart D J. Genome-wide expression monitoring in Saccharomyces cerevisiae [J]. Nature Biotechnology, 1997, 15(13): 1359-1367.
[25] LI E S Y,LIU W T. DNA microarray technology in microbial ecology studies��principle, applications and current limitations [J]. Microbes and Environments, 2003, 18(4): 175-187.
[26] Zhen Guo, Guilfoyle R A, Thiel A J, Wang Ren-feng, Smith L M. Direct fluorescent analysis of genetic polymorphisms by hybridization with oligonucleotide arrays on glass supports [J]. Nucleic Acids Research, 1994, 22(24): 5456-5465.
[27] Relogio A, Schwager C, Richter A, Ansorge W, Varcarsel J. Optimization of oligonucleotide-based DNA microarray [J]. Nucleic Acids Research, 2002, 30(11): e51.
[28] YIN Hua-qun, CAO Lin-hui, QIU Guan-zhou, WANG Dian-zuo, LAURIE K, ZHOU Ji-zhong, DAI Zhi-min, LIU Xue-duan. Development and evaluation of 50-mer oligonucleotide arrays for detecting microbial populations in Acid Mine Drainages and bioleaching systems [J]. Journal of Microbiological Methods, 2007, 70(1): 165-178.
[29] Relogio A, Schwager C, Richter A, Ansorge W, Valcarcel J. Optimization of oligonucleotide-based DNA microarrays [J]. Nucleic Acids Research, 2002, 30(11): e51.
[30] Rhee S K, Liu Xue-duan, Wu Li-you, Chong S C, Wan Xiu-feng, Zhou Ji-zhong. Detection of genes involved in biodegradation and biotransformation in microbial communities by using 50-mer oligonucleotide microarrays [J]. Applied and Environmental Microbiology, 2004, 70(7): 4303-4317.
[31] Wu Li-you, Thompson D K, Li G.ary, Hurt R A, Tiedje J M, Zhou Ji-zhong. Development and evaluation of functional gene arrays for detection of selected genes in the environment [J]. Applied and Environmental Microbiology, 2001, 67(12): 5780-5790.
[32] TIQUIA S M, CHONG S C, FIELDS M W, ZHOU J Z. Oligonucleotide-based functional gene arrays for analysis of microbial communities in the environment, Molecular Microbial Ecology Manual, Second Edition 1.8.11 [M]. Netherlands: Kluwer Academic Publishers, 2004: 1-19.
[33] Jaing C, Gardner S, McLoughlin K, Mulakken N, Alegria-Hartman M, Banda P, Williams P, Gu P, Wagner M, Manohar C, Slezak T. A functional gene array for detection of bacterial virulence elements [EB/OL]. PLoS ONE, http://www.plosone.org/article/info%3Adoi%2F1.0.1371%2Fjournal.pone.0002163.
Foundation item: Project(50621063) supported by the National Natural Science Foundation of China; Project(2004CB619201) supported by the National Basic Research Program of China
Corresponding authors: QIU Guan-zhou; LIU Xue-duan; Tel: +86-731-8830546; Fax: +86-731-8710804; E-mail: qgz@mail.csu.edu.cn (QIU Guan-zhou)
xueduanliu@yahoo.com (LIU Xue-duan)
(Edited by YANG Bing)

