
J. Cent. South Univ. (2020) 27: 2959-2970
DOI: https://doi.org/10.1007/s11771-020-4521-9

In-site core disking phenomenon and break mechanism of hard marble: Investigation in 2400 m deep-buried underground laboratory
ZHONG Shan(钟山)1, 2, JIANG Quan(江权)1, LIU Chang(刘畅)1, 3, LI Shao-jun(李邵军)1,
QIN Wei-min(覃卫民)1, ZHOU Ji-fang(周济芳)4, SUN Wen-liang(孙文良)4
1. State Key Laboratory of Geomechanics and Geotechnical Engineering, Institute of Rock and Soil Mechanics, Chinese Academy of Sciences, Wuhan 430071, China;
2. College of Engineering, Swansea University, Swansea SA18EP, UK;
3. University of Chinese Acadamy of Science, Beijing 100049, China;
4. Yalong River Hydropower Development Company, Ltd., Chengdu 610051, China
 Central South University Press and Springer-Verlag GmbH Germany, part of Springer Nature 2020
Abstract: The core-disk phenomenon has been observed generally in the drilling process under high-stress conditions. This paper presents the in-situ experimental study of the coring-disking failure mechanism of marble in an underground cavens with 2400 m depth. Based on the disk samples in several boreholes with different diameters, both macro- and micro-morphological characteristics of core-disks’ break surface were analysis, using 3D optical scanning and electron microscope scanning. Moreover, the numerical back analysis was also used to simulate the drilling process for demonstrating the development of core disking. The in-situ experiment results showed that the failure types of core disking consisted of tensile break and shear break, i.e., the shear break usually appears in the edge part of break surface, and tensile break appears in the central part. What’s more, the ration of core-disks thickness to borehole diameter is in a relatively stable range. Numerical back analysis indicated this micro asynchronous break of hard marble is induced by high geostress and unloading drill.
Key words: rock mechanics; deep engineering; shear break; tensile break; high geostress
Cite this article as: ZHONG Shan, JIANG Quan, LIU Chang, LI Shao-jun, QIN Wei-min, ZHOU Ji-fang, SUN Wen-liang. In-site core disking phenomenon and break mechanism of hard marble: Investigation in 2400 m deep-buried underground laboratory [J]. Journal of Central South University, 2020, 27(10): 2959-2970. DOI: https://doi.org/ 10.1007/s11771-020-4521-9.
1 Introduction
Under the high geostress condition, the hard rock in deep engineering often performs stress-induced failure, such as cracking, spalling, core-disking, or even rockburst [1-4]. What’s more, these failures of hard rock have caused many stability problems and safety issues, and resulted in some personal injury and equipment damage [5-10]. Thus, understating the inhere failure modes of on-site hard rock under high geostress, i.e., tensile break or shear break, is a crucial issue for disaster prevention in deep engineering [11-14].
Core disking is a typical stress-induced damage phenomenon of hard rock and have been generally observed in boreholes under high-stress condition. Many scholars have tried to explain this phenomenon through in situ observations [15, 16], laboratory experiments [17], and numerical simulation methods [18]. To explore the mechanical mechanism of core-disking, JAEGER et al [19] proposed that the maximum principal stress required for core disking is lower than the uniaxial compressive strength of the rock; OBERT et al [20] established a linear critical relationship between radial stress and axial stress for core failure. These fruitful researches showed that the tensile failure dominated the core-disking. By observing the different types of core-disking failure, LIM et al [21] believed that tensile stress magnitude and direction had a specific effect on the thickness of the core-disks; KAGA et al [22] established a relationship between core length and critical tensile stress; MATSUKI et al [6] also claimed a way to determine the in situ three-dimensional stress of rock mass based on the principal tensile stress analysis of core-disks.
These studies focused on the mechanical principles of core break and the corresponding stress magnitude. Yet, a few studies were based on the field cores and some uncertainties in these studies may arise from the lack of on-site experimental data of the core-disks under actual in-situ stress condition [23, 24]. For example, the relationship between the disks and the magnitude of stress obtained by laboratory experiments is always questionable, because the diameter of the borehole used in the laboratory is always less than 25 mm, and it is well known that the characteristics of rock masses are affected by the size effect [25-27]. However, the understanding of the mechanism behind the disk phenomenon is not very clear yet. Thus, detailed in-site experiment and investigation of core-disking are essential for further understanding of the brittle damage mechanism of hard rock induced by high geostress.
This work aims to explore the mechanism of stress-induced core-disks phenomenon under high stress conditions. These marble cores were drilled in the Chinese Jinping Underground Laboratory with the buried depth of 2400 m. The core-disks were counted according to on-site disk thickness and borehole diameters, then both macro- and micro-morphological characteristics of core-disks’ break surface were analyzed. Moreover, a numerical simulation was also used to reconstruct the process of core-disking and to expose the shear break and tensile break mechanism of disk induced by the unloading drill.
2 In-situ experiment preparation
Chinese Jinping Underground Laboratory Phase II, with the overburden depth of 2400 m and location at the Sichuan province in China, is the largest underground physical laboratory in the world. This laboratory has four tunnels and nine experimental rooms, and the cross-section of each room is a gate shape with 14 m×14 m in size, except for No. 9 testing room [28]. The rock is typical Triassic marble (T2b). According to the on-site stress test, the maximum initial principal stress in the zone is about 70 MPa [29]. During the excavation of the underground laboratories, many stress-induced failures, such as rock spalling and rock burst, had been recorded, which also indicated the high geostress condition on this site.
The experiment site of core drilling was on the head face of the No. 7 test room. Considering the rock mass in this zone was intact marble with high stress-induced cracking and spalling, it is of high probability to observe the core disking. The boreholes distributed on the head face of the No. 7 laboratory, 1-2 m away from the floor (Figure 1). The diameters of boreholes were designed as 75 mm, 110 mm, 130 mm, 150 mm and 220 mm. Thus, the boreholes were labeled as QX-110, QX-130, QX-150, QX-220 according to the holes’ diameters. The depth of these boreholes was 15 m.
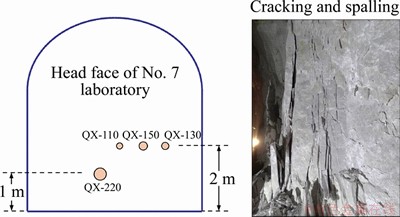
Figure 1 Layout of borehole for core drilling
In order to investigate the mechanical properties of the core rock, uniaxial tensile and triaxial compression tests were performed to obtain the relevant rock mechanics parameters. The results showed that the tensile strength was around 6 MPa, the ultimate tensile strain was 6‰ in maximum, the uniaxial compressive strength reached 170 MPa, and elastic modulus was approximately 43 GPa, with a Poisson ratio of 0.25.
3 Macro regulation of core-disks
3.1 Geometrical morphology of core-disks
Based on the overall observation of the in-site drilling core, the failure surface on core-disks is often perpendicular to the drilling direction, and the fracture shape is relatively regular. According to the thickness of the core-disk, the core-disks have four break types: cracked disk, pan disk, regular disk, and columnar core (Table 1).
Different types of disks are the result of the combination of stress conditions and integrity of rock mass. Here we define the core-disk density as the number of core-disks in a 20 cm area for analyzing the factors contributing to core-disking, thus it has been counted every 20 cm. For the QX-130 borehole, the statistical results indicated that (Figure 2):
1) Within the depth of the borehole less than 2 m, the core-disk density was between 0 and 5, which indicated that the rock core in this range was mostly short columnar core. This result was consistent with the rock mass acoustic wave test results, which indicates that the first 2 m depth was a stress-relaxation zone with low stress.
2) Within the range of 2-5 m depth in the borehole, the core-disk density was meager, but the cracked disk was observed (Figure 2(a) “①”). This section corresponds to the stress concentration zone formed by the excavation of laboratory room.
3) Within the range of 5-7 m depth in the borehole, the core-disks density was between 10 and 30, which means pan disks and regular disk appeared in the area (Figure 2(a) “②”). The maximum principal stress of the redistributed stress field in the rock mass was more than 90 MPa in this zone, so the concentrated high stress resulted in sufficient fractures during the drilling process.
4) Exceeding the depth of 12 m, long columnar core appeared and the disking phenomenon subsided (Figure 2(a) “③”), which maybe means the rock stress condition with little disturbance.
Comparing with the digital camera results in borehole (Figure 3), the regular core-disks was more likely to occur in the intact rock mass with concentrated high stress, i.e., the depth in 5.13-7.70 m in Figure 2(a). That means the high stress and intact rock mass are the two key factors to induce the core disking phenomenon.
3.2 Thickness distribution of core-disks in different boreholes
The thicknesses of core-disks from QX-110, QX-130, QX-150, QX-220 drilled holes were counted with 1 cm interval, (the thickness in 0.5- 1.5 cm was recorded as 1 cm). Thus, the number of core-disks with different thickness can be calculated, as shown in Figure 4. The figures showed that the thickness of the disks concentrated in the range from 1 to 5 cm, and the thickness of core-disks generally decreases with increasing borehole diameter in general:
Table 1 Description and photos of different types of core-disks
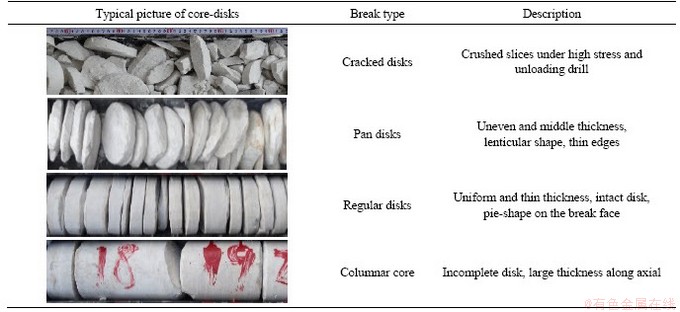
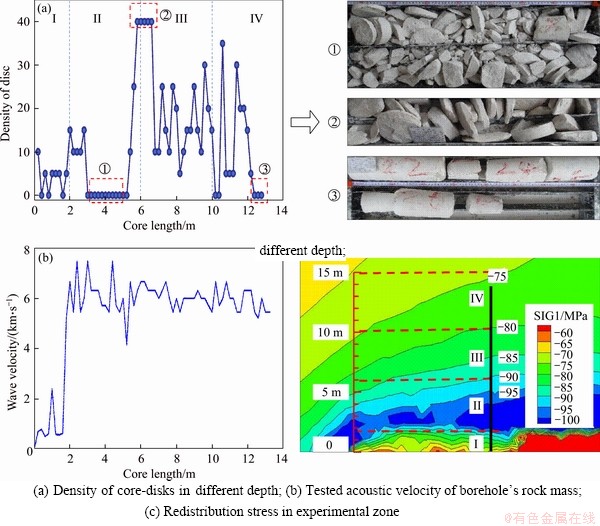
Figure 2 Core number distribution and the result of acoustic test along borehole QX-130:
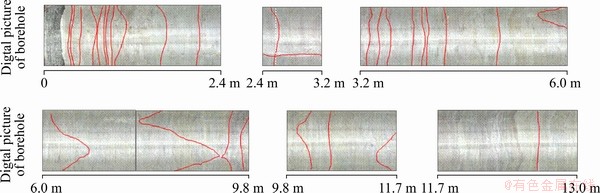
Figure 3 Fractures on QX-150 borehole observed by digital camera
1) The thickness of the core-disks from QX-110 borehole concentrated around 2 cm. The number of 2 cm core-disks accounted for 41% of the total core-disks, and the number of core-disks with a thickness of less than 5.0 cm accounted for the 67% (Figure 4(a)).
2) The thickness of the core-disks from QX-130 borehole concentrated in 2-5 cm, and the number of core-disks in this range accounted for 64% of the total core-disks (Figure 4(b)).
3) The thickness of the core-disks from QX-150 borehole concentrated in 2-3 cm, and the number of core-disks in this range accounted for 79% of the total core-disks (Figure 4(c)).
4) When the borehole diameter was 220 mm, the typical core-disks from QX220 borehole was about 5 cm, and the number of such core-disks accounted for 23% of the total number of core-disks (Figure 4(d)).
Especially, the thickness of the core-disks in QX-220 was 2-5 cm in general, and the ratio of thickness to diameter was 0.1-0.25. If only the typical core-disks of 4 cm thickness was counted, its ratio was in the range of 0.2-0.25. At the same time, the statistical results core-disks from QX-90, QX-110 and QX-130 boreholes also showed that the ratio of disk thickness to diameter was between 0.1 and 0.25. If only the typical core-disks with thickness of 2-3 cm from QX-90, QX-110 and QX-130 boreholes were counted, the ratio of thickness to diameter was still between 0.2 and 0.25. That means the ratio of core-disks thickness to borehole diameter may be in a relatively stable range. After the thickness of core-disks has been calculated, the relationship between the number of core-disks and its thickness was obtained (Eq. (1) and Eq. (2)), as shown in Figure 5.
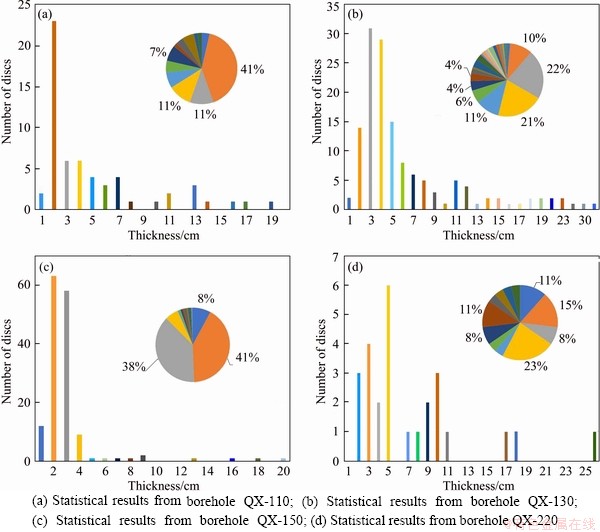
Figure 4 Number of disking core with different thickness and percentage in total number:
 (1)
(1)
n=1262.9exp(1.512T) (2)
where n is the number of core-disks and T is the thickness.
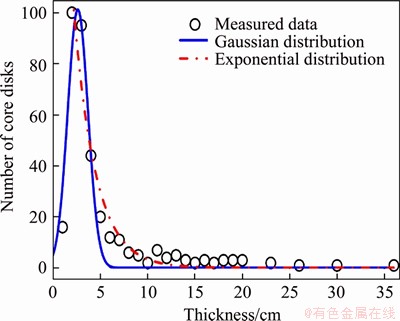
Figure 5 Statistical distribution of disking cores’thickness
Here, Eq. (1) is a Gaussian distribution, considering the low number of the thickness of 1 cm and partly ignoring the core-dicks whose thickness is larger than 5 cm. Equation (2) is an exponential distribution, since the fitted curve regards the number of thickness of 1 cm as incorrect. Although the failure core with around 1 cm thickness has a high probability of becoming broken which cannot be counted as core-disk, it was apparent that the number of core-disk reduced with the increase of thickness.
4 Topography characteristics of core- disks’ surface
4.1 3D morphology of core-disks’ surface
Use the Artec 3D Spider hand-held scanner to scan the whole core-disk to obtain the upper and lower surface data. Figure 6 shows some reconstructed 3D surfaces of core-disks, which is summarized as the following forms:
1) Lamp-shape fracture. The surface of the core-disk was concave in the middle and the edges line were wave shape, with two crests and two troughs (Figure 6(a));
2) Center-pull mark fracture. There was a stagger in the middle or near the center of the core-disk (Figure 6(b));
3) Edge stepped fracture. There were step-like fractures around the core-disk, and the steps only occurred asymmetrically on one side of fracture surface (Figure 6(c));
4) Inclined pie fracture. The thickness of one side of the core-disks was higher than the thickness of its other side (Figure 6(d)). On the thinner side, the piece of core-disking may have multiple appearances such as thinning, staggering, and steps, which agrees with LU’s results [30].
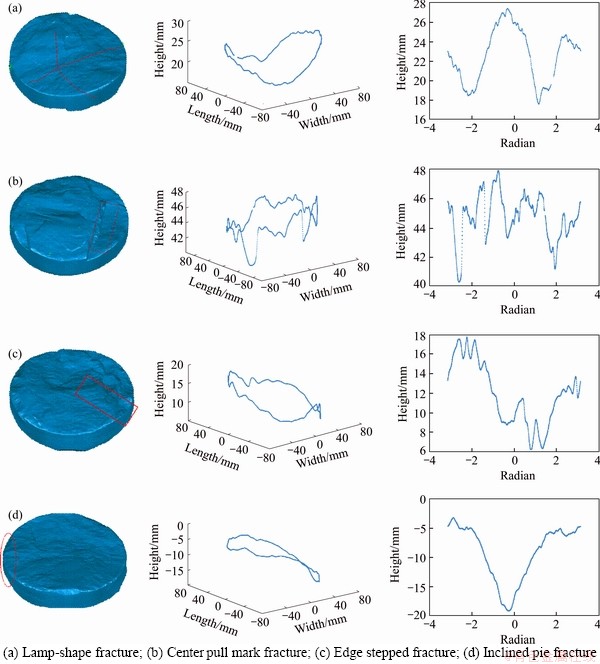
Figure 6 Reconstructed 3D disking core and 2D edge curves with different failure:
This process of core-disking was typically due to unloading drill. Therefore, the undulating heights of the edge lines of the two faces of the core- disking, especially the core-disks of lamp-shape, also conformed to the curve form of the trigonometric function in one cycle. As can be seen from Figure 8, the edge line was composed of two crests and two troughs when the edge staggers did not significantly damage the edge line. The relative properties of the peaks and troughs changed with the inclination of the core-disks’surface (one side was thinner than the other side).
4.2 Micro break characteristics of core-disks’surface
The current experimental study has indicated that there may be three types of mechanisms in the process of core-disking, i.e., tensile dominated break, shear dominated break, and coupled tensile-shear break. For investigating the break mechanisms of this marble’s core-disks in a micro viewpoint, the spices from different parts of marble core-disk’s surface had been observed by scanning electron microscope (SEM). The spices have two categories, i.e., spices from center part and edge part. Here, four samples from the edge part and two samples from center part of core-disk had been collected.
The SEM results of the samples located in the center of the core-disks showed that the microscopic morphology was complex. The surface of samples from the center part was parallel slip-like stripes and thousand-layer disk-like stripes, which were more focused on tensile break (Figure 7). For the samples located at the edge of the core-disking, the scanning results were mirror- like and step-like, with large step spacing, which was a mixed failure of compressive shear break (Figure 8).
5 Numerical back analysis for core- disking process
5.1 Numerical model for core-disking
In order to further analyze the core-disking process, a numerical software was used to build a 3D borehole model and to simulate the process of core drilling. Considering the geometrical and mechanical symmetry of object, one-quarter of borehole and surrounding rock was taken to establish the element model. The overall element model was 85 cm in length, 85 cm in width and 100 cm in height. The radius of the central core was 65 mm, and the thickness of the drill bit was 2 cm. The core and drill part was divided into 0.5 cm element along the radial direction, and 20 elements in circumferential direction. Thus, each drilling depth was 5 mm in height.
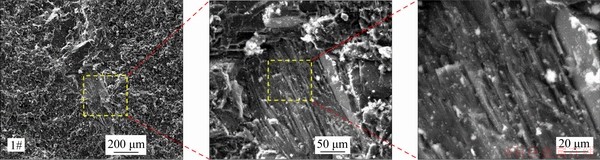
Figure 7 SEM result of pieces on central of disk
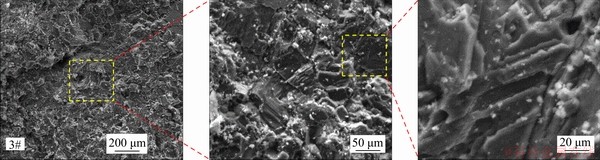
Figure 8 SEM results of spices on edge of disks
The rock deterioration model (RDM) model was applied in the core-disking simulation (Eq. (3)), because the RDM model can describe the stress- induced deterioration and damage accumulation by normalizing dynamic evolution rules for the defined elastic modulus, cohesion, friction angle and tensile strength based on the plastic internal variable (Eq. (4)) [31]. By changing the mechanical parameters after yielding, this model can simulate the brittle and ductile behavior of the material. Figure 9 shows the simulated elastic-brittle-plastic failure curves of this marble under uniaxial compressive condition. The residual tensile strength was set as 0.01 MPa considering non-zero value allows the numerical model to converge faster. In this simulation for core disking, the basic input mechanical parameters were gained from the experiments and the applied stress boundary considered the tested geostress results on-site. The vertical stress is 30 MPa and the horizontal confining stress is 80 MPa considering the in-situ redistribution stress state.
 (3)
(3)
 (4)
(4)
where is the equivalent plastic strain; ε1, ε2, ε3 are the principal strains in the three principal stress directions respectively; E0 is the initial elastic modulus; C0 is the initial cohesive strength; φ0 is the initial internal friction angle; T0 is the initial tensile strength;

 and
and are the current elastic modulus, current cohesive strength, current internal friction angle and current tensile strength, respectively.
5.2 Numerical disking process of core
Before the first step of drilling, the initial drilling process was simulated by removing the upper core, so that the core was unloaded and not constrained by vertical stress during the drilling process. In the following simulation of drilling process, one unit was released in each “unloading drill” operation. The simulation performed 40 step of the drilling, and the drilling depth was 20 cm. The final simulation result showed that 7 disk fracture surfaces appeared and the thickness of each disk was about 2.56 cm (Figure 10). What’s more, the ratio of the thickness to the diameter was 23.8%. This result was consistent with the statistical results above.
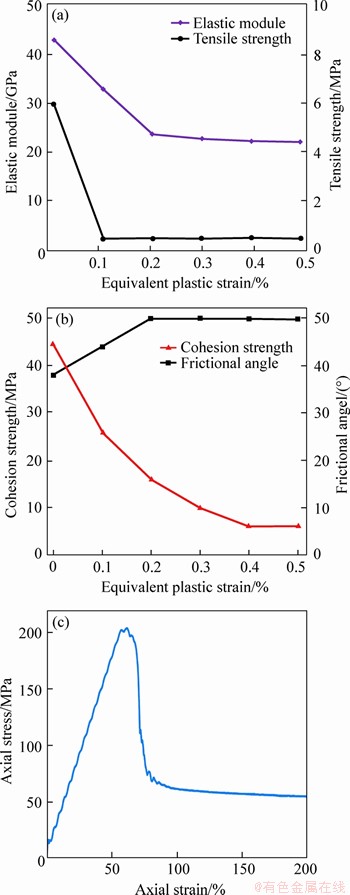
Figure 9 Parameters evolution vs plastic strain and simulated of marble’s uniaxial compressive test
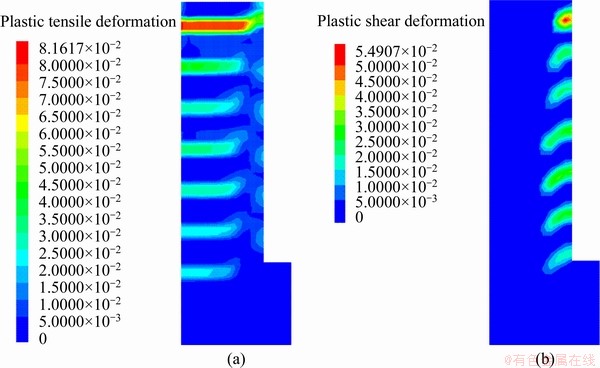
Figure 10 Result of the numerical modeling of core disking
The plastic shear deformation always appears on the edge of the fracture surface, while the plastic tensile deformation appears on the center of fracture surface (see Figure 10). Thus, this numerical simulation indicated that the cracking mechanism of the disk under this stress condition is coupled with tensile-shear damage. That is, the failure starts from the edge as shear damage and then extends to the middle driven by the tensile damage. Of course, the tensile strain value is of little significance in practice. When the strain exceeds a given value 0.006 according to above laboratorial experiment, the core will break. In addition, it can be found that the value of plastic tensile deformation on each fracture surface continues to decrease with the increase of drilling depth, when the value of plastic shear deformation remains unchanged. This can explain the phenomenon of circumferential cracks on the surface of the core samples.
In order to analyze the mechanical process of the core-disk phenomenon, the tensile stress, shear stress, plastic shear deformation, and plastic tensile deformation of the element are monitored in the numerical simulation. Figure 11 shows the development process of these mechanical indices during the drilling of the first six steps.
In the 40-step simulation of core disking, the elements with plastic strain in the red color are extracted as Figure 12. The inclined shear break surface is predominant at the edge of the disk and the horizontal tensile break surface is predominant at the middle. The whole fracture surface is in the shape of a bowl.
6 Conclusions
The marble core-disking phenomenon of multiple boreholes in a deep engineering was statistically analyzed, and the relationships between core-disk’s thickness and borehole’s diameters were also analyzed. The numerical back method was carried out to simulate the stress/strain evolution process and to demonstrate fracture development during unloading drill. The following conclusions have been drawn:
The core-disking phenomenon often occurs in the intact rock mass with high initial geostress, and the thickness of the core-disks decreases accordingly as the geostress increase. Under the same geostress conditions, the thickness of the core-disking increases with the rise up of the borehole’s diameter, which showed a noticeable size effect. At the same time, the statistical ratio between the thickness of the core-disking and the diameter of the core-disking is about 0.25.
The morphology of the fracture surface of the core-disks is controlled by the cracks and stress conditions in the core. In the intact part of the rock, the fracture surface is influenced by radial stress to form a lamp. The micro morphology exposed that the cracking mechanism of the core-disking is generally mixed tensile and shear break, and the shear break mainly appears at the edge of the core but tensile break appears at the middle of the core.
Further back analyzing the core-disking process by numerical simulation indicates that the disking failure starts from the edge as shear break and then extends to the middle driving by the tensile break during the unloading drill process. The analysis of the plastic shear deformation and plastic tensile deformation show that the shear break previously appears to the tensile break during the disking process, which can reasonably explain the phenomenon of annular cracks on the outside of the marble core during the in-situ drilling process.
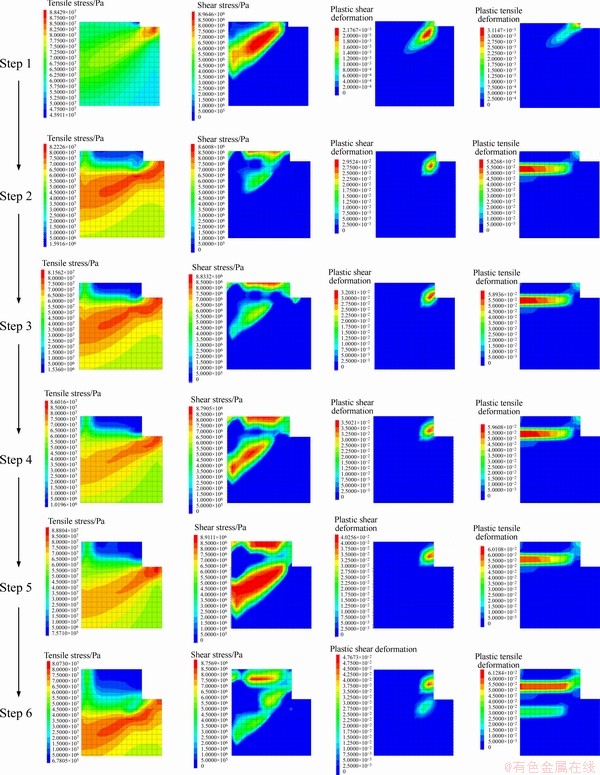
Figure 11 Numerical simulation results of mechanical failure in first six drilling
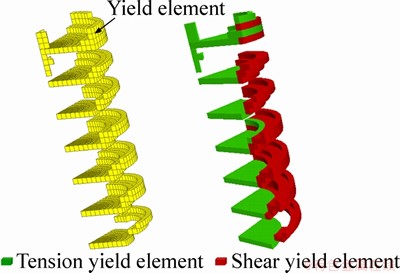
Figure 12 Zones of yield element and corresponding break modes
Contributors statement
ZHONG Shan carried out the onsite experiment and wrote the content. JIANG Quan designed and organized the study and modified the content. LIU Chang, LI Shao-jun and QIN Wei-min took part in the experiment study. ZHOU Ji-fang and SUN Wen-liang provided the experimental site and equipment. All authors have read and approved the final manuscript.
Conflict of interest
ZHONG Shan, JIANG Quan, LIU Chang, LI Shao-jun, QIN Wei-min, ZHOU Ji-fang, and SUN Wen-liang declared that they have no conflicts of interest to this work.
References
[1] FAIRHURST C, COOK N G W. The phenomenon of rock Splitting parallel to the direction of maximum compression in the neighbourhood of a surface [C]// 1st ISRM Congress 1966. Lishon: ISRM, 1966.
[2] ORTLEPP W D, STACEY T R. Rockburst mechanisms in tunnels and shafts [J].Tunnelling and Underground Space Technology, 1994, 9(1): 59-65. DOI: 10.1016/0886-7798(94) 90010-8.
[3] JIANG Q, FENG X T, LI S J, SU G S, XIAO Y X. Cracking-restraint design method for large underground caverns with hard rock under high geostress condition and its practical application [J]. Chinese Journal of Rock Mechanics and Engineering, 2019, 38(6): 1081-1100. DOI: 10.13722/ j.cnki.jrme.2018.1147. (in Chinese)
[4] LUO Yong, GONG Feng-qiang, LI Xi-bing, WANG Shan-yong. Experimental simulation investigation of influence of depth on spalling characteristics in circular hard rock tunnel [J]. Journal of Central South University, 2020, 27(3): 891-910. DOI: 10.1007/s11771-020- 4339-5
[5] BRADY B H G, BROWN E T. Monitoring rock mass performance [M]// Rock Mechanics. Dordrecht: Springer Netherlands, 1999: 491-517.
[6] MATSUKI K, KAGA N, YOKOYAMA T, TSUDA N. Determination of three dimensionalin situstress from core discing based on analysis of principal tensile stress [J]. International Journal of Rock Mechanics and Mining Sciences, 2004, 41(7): 1167-1190. DOI: 10.1016/j.ijrmms. 2004. 05.002.
[7] FENG Guang-liang, FENG Xia-ting, CHEN Bing-rui, XIAO Ya-xun, ZHAO Zhou-neng. Effects of structural planes on the microseismicity associated with rockburst development processes in deep tunnels of the Jinping-II Hydropower Station, China [J]. Tunnelling and Underground Space Technology, 2019, 84: 273-280. DOI: 10.1016/j.tust.2018. 11.008.
[8] JIANGQuan, SU Guo-shao, FENG Xia-ting, CHEN Guo-qing, ZHANG Mei-zhu, LIU Chang. Excavation optimization and stability analysis for large underground Caverns under high geostress: A case study of the Chinese laxiwa project [J]. Rock Mechanics and Rock Engineering, 2019, 52(3): 895-915. DOI: 10.1007/s00603-018-1605-z.
[9] ZHAOGuo-qing, YANGYu-you, MENGSu-yun. Failure of circular shaft subjected to hydraulic uplift: Field and numerical investigation [J]. Journal of Central South University, 2020, 27(1): 256-266. DOI: 10.1007/s11771- 020-4293-2.
[10] JIANG Quan, YANG Bing, YAN Fei, LIU Chang, SHI Yin-gen, LI Li-fu. New method for characterizing the shear damage of natural rock joint based on 3D engraving and 3D scanning [J].InternationalJournalof Geomechanics, 2020, 20(2): 06019022. DOI: 10.1061/(ASCE)GM.1943-5622.000 1575.
[11] CUNDALL P, POTYONDY D, LEE C. Micromechanics- based models for fracture and breakout around the mine-by tunnel [C]// Proceedings, International Conference on Deep Geological Disposal of Radioactive Waste, Winnipeg. Edited by MARTINO J B and MARTIN C D. Toronto: Canadian Nuclear Society, 1996: 113-122.
[12] MARTINI C D, READ R S, MARTINO J B. Observations of brittle failure around a circular test tunnel [J]. International Journal of Rock Mechanics and Mining Sciences, 1997, 34(7): 1065-1073. DOI: 10.1016/S1365- 1609(97)90200-8.
[13] JIANG Quan, LIU Xiao-pei, YAN Fei, YANG Yao, XU Ding-ping, FENG Guang-liang. Failure performance of 3DP physical twin-tunnel model and corresponding safety factor evaluation [J]. Rock Mechanics and Rock Engineering, 2020 (Online). DOI:10.1007/s00603-020-02244-7.
[14] GONG Feng-qiang. Experimental simulation and investigation of spalling failure of rectangular tunnel under different three-dimensional stress states [J]. International Journal of Rock Mechanics and Mining Sciences, 2019, 122: 104081. DOI:10.1016/j.ijrmms.2019.104081.
[15] LEMPP C H, MUHLHAUS H B. Splitting and core disking in deep boreholes [C]// 2nd Int Symp on Observation of the Continental Crust through Drilling. 1985: 94.
[16] LIYong-yi, SCHMITT D R. Drilling-induced core fractures andin situstress [J]. Journal of Geophysical Research: Solid Earth, 1998, 103(B3): 5225-5239. DOI: 10.1029/97JB023 33.
[17] BAUCH E, LEMPP C. Rock splitting in the surrounds of underground openings:An experimental approach using triaxial extension tests [M]. Engineering Geology for Infrastructure Planning in Europe, 2004: 244-254. DOI: 0.1007/978-3-540-39918-6_29.
[18] CORTHESY R, LEITE M H. A strain-softening numerical model of core discing and damage [J]. International Journal of Rock Mechanics and Mining Sciences, 2008, 45(3): 329-350. DOI: 10.1016 /j.ijrmms.2007.05.005.
[19] JAEGER J C, COOK N G W. Pinching-off and disking of rocks [J]. Journal of Geophysical ResearchAtmospheres, 1963, 68(6): 1759-1765. DOI: 10.1029/JZ068i006p01759.
[20] OBERT L, STEPHENSON D. Stress condition under which core discing occurs [J]. Society of Mining Engineers of AIME Transactions, 1965, 232(3): 227-235.
[21] LIM S S, MARTIN C D. Core disking and its relationship with stress magnitude for Lac du Bonnet granite [J]. International Journal of Rock Mechanics and Mining Sciences, 2010, 47(2): 254-264. DOI: 10.1016/j.ijrmms. 2009.11.007.
[22] KAGA N, MATSUKI K, SAKAGUCHI K. Thein situstress states associated with core discing estimated by analysis of principal tensile stress [J]. International Journal of Rock Mechanics and Mining Sciences, 2003, 40(5): 653-665. DOI: 10.1016/ S1365-1609(03) 00057-1.
[23] LI Z H, FENG X T, LI S J, ZHOU H, CHEN B D, ZHANG C Q. Characteristics and formation mechanism of core discing in deep rock mass [J]. Chinese Journal of Rock Mechanics & Engineering, 2011, 30(11): 2254-2266. http:// www.rockmech.org/CN/Y2011/ V30/I11/2254. (in Chinese)
[24] YANPeng, LUWen-bo, HEYan-li,ZHOUWei, CHEN Ming, WANG Gao-hui. Coring damage mechanism of the Yan-Tang group marble:combined effect of stress redistribution and rock structure [J]. Bulletin of Engineering Geology and the Environment, 2016, 75(4): 1701-1716. DOI: 10.1007/s10064-015-0842-6.
[25] FAKHIMI A, TAROKH A. Process zone and size effect in fracture testing of rock [J]. International Journal of Rock Mechanics and Mining Sciences, 2013, 60: 95-102. DOI: 10.1016/j.ijrmms. 2012.12.044.
[26] DARLINGTON W J, RANJITH P G, CHOI S K. The effect of specimen size on strength and other properties in laboratory testing of rock and rock-like cementitious brittle materials [J]. Rock Mechanics and Rock Engineering, 2011, 44(5): 513-529. DOI: 10.1007/s00603-011-0161-6.
[27] CUNDALL P, PIERCE M, MASIVARSD. Quantifying the size effect of rock mass strength [C]// Proceedings of the First Southern Hemisphere International Rock Mechanics Symposium.Australian Centre for Geomechanics, Perth, 2008: 16-19. DOI: 10.36487/ACG_repo/808_31.
[28] FENG X J, WU S Y, LI S J, QIU S L, XIAO Y X, FENG G L, SHENG M B, ZENG X H. Comprehensive field monitoring of deep tunnels at Jinping underground laboratory (CJPL-II) in China [J]. Chinese Journal of Rock Mechanics and Engineering, 2016, 35(4): 649-657. DOI: 10.13722/j.cnki. jrme.2016.0048. (in Chinese)
[29] ZHONG S, JIANG Q, FENG X T, LIU J G, LI S J, QIU S L, WU S Y. A case of in-situ stress measurement in Chinese Jinping underground laboratory [J]. Rock Soil Mech, 2018, 39: 356?366. DOI: 10.16285/j.rsm.2017.0336. (in Chinese)
[30] LUTong, GAOMing-zhong, ZHANGRu,XIEJing, TAN Qiang, LU Yi-qiang, HE Zhi-qiang, WANG Wen-yong, PENG Gao-you. Exploration on stress mechanism of deep disked core [J]. Advanced Engineering Sciences, 2018,50(5): 47-54. DOI: 10.15961/j.jsuese. 201800445. (in Chinese)
[31] JIANGQuan, FENGXia-ting, XIANGTian-bing, SU Guo-shao. Rockburst characteristics and numerical simulation based on a new energy index:acase study of a tunnel at2500m depth [J]. Bulletin of Engineering Geology and the Environment, 2010, 69(3): 381-388. DOI: 10.1007/s10064-010-0275-1.
(Edited by HE Yun-bin)
中文导读
大理岩岩芯饼化现象与破坏机理:2400 m深埋地下实验室现场试验研究
摘要:高应力条件下钻孔过程中,岩芯饼化体现了深部岩体一种典型的破裂模式。本文依托埋设达2400 m的中国锦屏深部地下实验室,通过现场试验揭示了锦屏大理岩饼化的原位规律和破裂机制。首先基于现场不同孔径钻孔的饼化岩芯,通过宏观饼厚统计、细观3D激光扫描和微观电镜观察,揭示了饼化岩芯破坏面的多尺度宏细观形貌特征;进而通过数值方法模拟钻进过程中岩芯的局部应力应变演化特征和饼化动态发展过程。分析揭示岩芯饼化破裂同时包含了张拉破裂和剪切破裂,剪切破裂多出现于岩饼的边缘部位而张拉破裂多出现于岩饼的中心部位;而且不同直径钻孔岩饼统计表明饼化岩芯厚度与直径的比值基本不变。综合研究表明外部高应力环境和钻进过程中岩芯自身局部卸荷与应力集中是导致大理岩微观上异步饼化破裂的关键驱动因素。
关键词:岩石力学;深部工程;剪切破裂;拉伸破裂;高地应力
Foundation item: Projects(U1965205, 51779251, 41672314) supported by the National Natural Science Foundation of China
Received date: 2020-08-07; Accepted date: 2020-08-24
Corresponding author: JIANG Quan, PhD, Professor; Tel: +86-27-87198805; E-mail: qjiang@whrsm.ac.cn; ORCID: https://orcid.org/ 0000-0001-6039-9429

