
Effect of potential on characteristics of
surface film on natural chalcopyrite
YU Juan1, YANG Hong-ying1, FAN You-jing2
1. School of Materials and Metallurgy, Northeastern University, Shenyang 110004, China;
2. School of Sciences, Northeastern University, Shenyang 110004, China
Received 30 October 2010; accepted 27 May 2011
Abstract: Electrochemical behavior of natural chalcopyrite in electrolyte solution containing 5��10-4 mol/L ethyl xanthate, and the effect of potential on the composition and characteristics of surface film were studied by cyclic voltammetry (CV), scanning electron microscopy (SEM) and electrochemical impedance spectroscopy (EIS). The adsorption of xanthate (X-) occurred on the mineral surface at open-circuit potential (OCP). In the potential range from -0.11 to 0.2 V, the electrochemical reaction related to the formation of the hydrophobic film of dixanthogen (X2) occurred on natural chalcopyrite surface. This surface film had high coverage and large thickness at the potential of 0 V, but it had low coverage and small thickness at the potentials of 0.1 V and 0.2 V. Electrochemical activation started to occur when the potential was higher than 0.2 V, and the film of X2 transformed to plenty of Cu(��) and Fe(��) oxygen-containing species which had the porous and loose characteristics.
Key words: potential; chalcopyrite; surface film; xanthate
1 Introduction
Recently, potential control flotation technology developed rapidly due to the trend of high difficulty of separation of polymetallic sulphide ore at home and abroad [1]. This technology goes a step further compared with traditional flotation technology which is characterized by the matching of collector and pH value, and it can realize the high selective separation of sulphide ore and low dosage consumption of reagent [2].
Chalcopyrite is an important industrial copper- bearing mineral. Single xanthate or the mixture of xanthate and dithiophosphate acts as collector during the flotation process. The adsorption of xanthate on the surface of mineral is assisted by electron transfer process and it results in the fact that xanthate would be adsorbed when the anode current flows through the mineral [3]. Thus, the adsorption of xanthate on mineral surface can be controlled by adjusting potential. Correspondingly, the floatability of this mineral is increased due to the formation of a hydrophobic film on the surface of mineral. Recently, numerous studies were done on electrochemistry of collectorless flotation and xanthate induced flotation of chalcopyrite [4-8]. However, most of studies focused on the determination of redox reactions occurred on the surface of chalcopyrite and chemical composition of the surface film formed on chalcopyrite surface, and contact angle measurement of chalcopyrite surface. VELASQUEZ et al [9] researched the electrochemical process on the surface of natural chalcopyrite as well as enargite in collectorless solutions using in-situ technology of electrochemical impedance spectroscopy (EIS). However, the current knowledge is insufficient to understand the morphologies and impedance characteristics of the surface species on chalcopyrite during the xanthate induced flotation at different potentials, which is essential to accurately determine the potential values for obtaining a good hydrophobic film.
In this work, EIS, CV and scanning electron microscopy (SEM) are used to study the influence of potential on the composition of surface film and the properties of surface film on chalcopyrite surface. The potential range in which a hydrophobic film could exist stably is determined to provide an evidence for the optimization of potential control flotation. Moreover, it could provide a base for the next step to study the influence of potential on the adsorption of the single dithiophosphate and the mixture of xanthate and dithiophosphate during potential control flotation process.
2 Experimental
2.1 Solution preparation
The natural chalcopyrite samples were from Anhui Province, China, with the composition of 98% (mass fraction) chalcopyrite and 2% impurities. The electrolyte solution containing 0.1 mol/L KNO3 was firstly prepared using distilled deoxygenated water and then Na2B4O7 was added into the solution to keep the pH value at 9 [10]. Finally, ethyl xanthate was added into the solution with a concentration of 5��10-4 mol/L.
2.2 Electrochemical experiments
The samples used in electrochemical experiments were connected with copper wire, and then encapsulated with epoxy resin with 1 cm2 area exposed for each sample. The surface of working electrodes was ground to 2000 grit using silicon carbide paper before experiments.
EIS tests were performed using EG&G potentiostat model 273 equipped with a model 5210 locked-in amplifier. A conventional three-electrode cell system was used in electrochemical experiments. A piece of platinum and a saturated calomel electrode (SCE) were employed as auxiliary electrode and reference electrode, respectively. All the potential values in this work were referred to SCE. The scanning frequency was from 100 kHz to 10 mHz with a perturbation amplitude of 5 mV. The data of impedance spectra were fitted using the Zimpwin3.20 Software.
CV measurements were conducted using EG&G potentiostat model 273. The scanning potential initiated at open-circuit potential (OCP) in positive direction with a scanning rate of 50 mV/s. The scanning potential region was from -0.945 V to 0.655 V. An initial retard of 300 s for all the electrochemical tests was set to obtain a stable testing system.
2.3 SEM observation
The samples used for SEM observation were polished using 1 ��m diamond paste, and then ultrasonically cleaned in acetone, and dried in nitrogen gas finally. Each sample was polarized to different potentials respectively in electrolyte solution, and then the potential was kept constant for 600 s. After this treatment, the sample was taken out from the electrolyte solution and washed with distilled deoxygenated water at least four times before it was transferred into the SEM chamber. Surface morphologies of the samples were observed using SSX-550 scanning electron microscope equipped with an energy dispersive X-ray spectroscope (EDS).
3 Results and discussion
3.1 CV tests
Figure 1 shows the typical CV curve for natural chalcopyrite in electrolyte solution. In the anodic scanning direction, an anodic peak (peak A) was observed in the potential between -0.11 V and 0.30 V. The reversible potential of the reduction of dixanthogen (X2) to xanthate (X-) is -0.11 V, and it was higher than the rest potential value of chalcopyrite in electrolyte solution (-0.166 V). Therefore, this anodic peak corresponded to the electrochemical reaction of the formation of dixanthogen [11], and this reaction is shown as:


 (1)
(1)

Fig. 1 Cyclic voltammogram of natural chalcopyrite in electrolyte solution
In this potential range, there was a small potential zone (0.1-0.3 V) in which the anodic current density nearly kept constant (0.092 mA/cm2). It was attributed to the passive film formed on the electrode surface with the precipitate of dixanthogen, which inhibited the charge transferring on the electrode. However, once the potential was higher than 0.3 V, the current density increased dramatically. It was indicated that the passive film could not exist stably on the sample surface and electrochemical activation of the electrode occurred on the electrode. In the cathodic scanning direction, a peak (peak B) was detected at the potential about 0.12 V and it might be associated to the reduction of dixanthogen formed in the positive scanning. However, the size of peak B was much smaller than that of anodic peak (peak A), which suggested that the oxidation reaction occurred in the positive scanning may not be fully reversible.
The whole scanning time of CV measurement was less than 30 s. As a result, there was few oxidation products formed on the surface of electrode. Hence, it was difficult to determine the composition of these oxidation products combined with the characteristics of surface film just by CV. Thus, in the following tests, the chalcopyrite electrode was polarized to some given potentials and then these potentials were kept constant for 600 s to form more quantity of oxidation products. These given potentials were OCP, 0, 0.1, 0.2, 0.3 and 0.4 V, and these potentials were related to the potential range of peak A in Fig. 1.
3.2 Morphology characteristics of surface film formed at various potentials
Figure 2 shows SEM micrographs of natural chalcopyrite surface after being polarized to given potentials in electrolyte solution, and the EDS analysis result is shown in Fig. 3.
The chalcopyrite crystal is soft. Some small holes and scratch lines were left on the sample surface after being polished as shown in Fig. 2. Meanwhile, there were some bright spots as marked by arrow on the surface. It was revealed from the analysis of the EDS results that these bright spots were sphalerite that were encrusted in the sample (Fig. 4). The surface of sample after being polarized to OCP in electrolyte solution was uniform compared with that of polished sample, and the scratch lines left on the surface of sample after being polished could not be seen in Fig. 2(b). The EDS result revealed the carbon content on the sample surface increased (Fig. 3). It could be seen in Fig. 1 that this OCP is lower than the potential corresponding to the oxidization of xanthate (X-) to dixanthogen (X2). Thus, the surface film formed on sample surface should not be X2. It might be related to the adsorption of xanthate (X-) on sample surface. The surface of sample after being polarized to 0 V presented no obvious difference. However, the content of carbon increased greatly. It was suggested that X2 formed on the sample surface. When the sample was polarized to 0.1 V, the structure of this surface film changed greatly and it presented flake shape. The dark and bright regions were marked as A and B, respectively, as shown in Fig. 2(d). It could be seen from the analysis of EDS result that the carbon content in the dark region was higher than that in the bright region, and the oxygen content was less than that in the bright region. Thus, it could be concluded that the dark region is mainly composed of the X2 film, and the light area B is mainly composed of Cu(II) and Fe(III) oxygen- containing species. These results provided evidence that the surface film of X2 could not stably exist on the sample surface when the potential exceeded 0.1 V. When the sample was polarized to the potentials of 0.3 V (Fig. 2(e)), the surface film of X2 almost disappeared. More irregular with the wide spreading of small bright protuberances appeared on sample surface. The analysis of EDS result revealed that the content of oxygen in these protuberances was up to 5.1% (mass fraction). It was evident that a mass of oxygen-containing species formed on the sample surface at higher potentials due to electrochemical activation behavior of electrode.
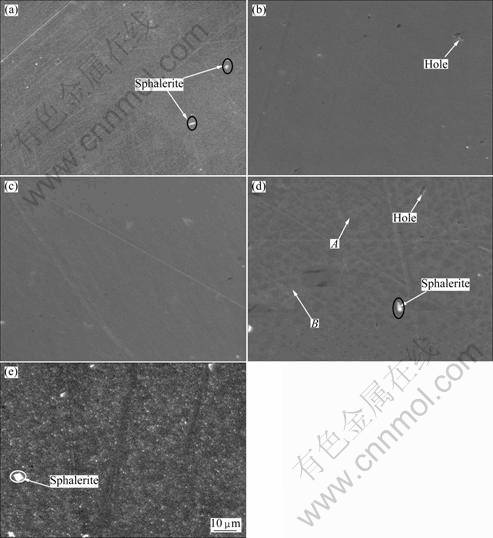
Fig. 2 SEM micrographs of natural chalcopyrite surface after being polarized to various potentials in electrolyte solution: (a) Polished; (b) OCP; (c) 0 V; (d) 0.1 V; (e) 0.3 V
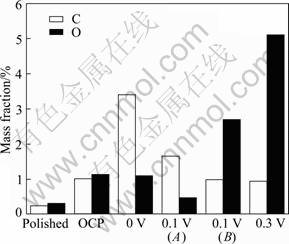
Fig. 3 Elemental composition of natural chalcopyrite surface after being polarized to different potentials in electrolyte solution
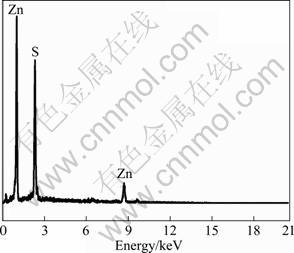
Fig. 4 EDS spectrum for bright spot on chalcopyrite surface
3.3 EIS analysis
In order to investigate the impedance characteristics of the surface film formed at various potentials, the sample was firstly polarized to OCP, 0, 0.1, 0.2, 0.3 and 0.4 V, respectively, and these potentials were kept constant for 600 s. Finally, the EIS measurements were carried out at OCP. Figure 5 shows the EIS spectra in the forms of Nquist, Bod phase and Bobe |Z| diagrams. It could be seen that Nquist plot at each potential was composed of one high-frequency capacitive loop and one low-frequency capacitive loop. These two loops represented electric double layer and surface film on the electrode. The equivalent circuit model corresponding to the EIS spectrum was proposed as shown in Fig. 6. The fitted curves obtained using the equivalent circuit of Fig. 6 was also presented in the EIS diagrams. It could be seen that the fitted results were in agreement with the experimental results, which suggested that this model satisfactorily described the properties of surface film. In the equivalent circuit; Re was the solution resistance; Rct referred to the charge transfer resistance occurring within the pores of the surface film; Rf was the pore resistance of the surface film; W was the diffusion impedance. CPEdl and CPEf described the double-layer capacitance and the capacitance of the surface film, respectively. The constant phase element (CPE) was used to compensate for the non-homogeneity in the system, including porosity, fractal geometry, and the distribution of interfacial capacitances [12-14]. The CPE (Y) was related to capacitance C as [15]:
 (2)
(2)
where  is the frequency at which the imaginary part of the impedance (Z��) has a maximum value; CPE(Y) can be obtained from the fitting results; n is a dimensionless number (0��n��1). The fitting parameters for equivalent electric circuit are listed in Table 1, and the calculation results of the double-layer capacity Cdl are shown in Fig. 7. for the calculation of Cdl was 1 000 Hz at OCP, 1 580 mHz in the potential range of 0-0.2 V, and 2510 mHz when the potential was higher than 0.2 V, respectively. The value of Cdl at OCP was 110 ��F/cm2, and it reduced to 78.8 ��F/cm2 at 0 V. It related to the formation of surface film of X2 at the potential of 0 V, and the coverage rate of this film was high. When the potential increased to 0.1 V, the value of Cdl increased slightly. SEM observation showed that the structure of X2 film presented flake shape, and the carbon content decreased greatly. It revealed that the coverage rate of the X2 film decreased dramatically compared with the sample treated at 0 V. When the polarization potential was 0.3 V, the capacitance value Cdl decreased sharply. It was evident that a significant surface film had formed on the sample surface which was distinctive from the X2 layer. The EDS result showed that X2 film transformed to the Cu(II) and Fe(III) oxygen-containing species when the polarization potential was higher than 0.2 V. Therefore, it was confirmed that plenty of the Cu(II) and Fe(III) oxygen-containing species had formed on the surface.
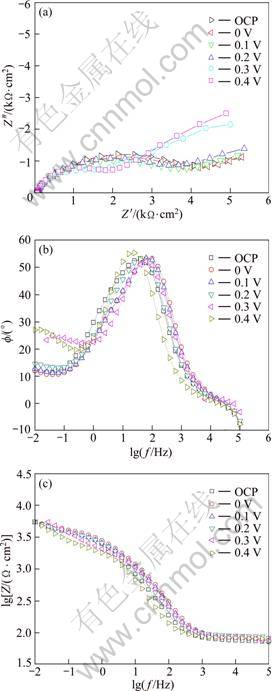
Fig. 5 EIS plots for natural chalcopyrite after being polarized to different potentials for 600 s in electrolyte solution: (a) Nquist; (b) Bode; (c) Bode |Z|
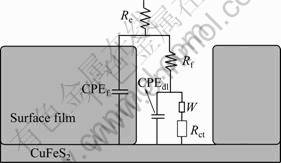
Fig. 6 Equivalent electric circuit model of impendence for surface film on natural chalcopyrite surface
Due to the partial coverage of the surface film, the passage of Faradaic current would be blocked. Thus, this surface film is assumed to be a perfect insulator, and can be considered to be a capacitor. It can be related to the permittivity and thickness of the surface layer [16]:
 (3)
(3)
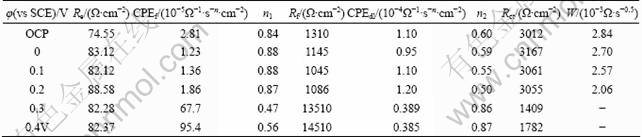
where �� is the film dielectric constant; ��0 is the permittivity of free space; A is the geometrical interface area (coverage rate); �� is the film thickness. The variation of Cf (represented here by a pseudo capacitance CPEf) results from the variation of film thickness ��, film dielectric constant �� and coverage rate A. The film dielectric constant �� depends on the dielectric constant of the solution, the number and size of pores in the film. That is to say, the value of film dielectric constant �� increases with increasing the film porosity. Additionally, �� is a constant when the composition of film is fixed in given solution [17]. From Table 1, the value of the film capacitance CPEf was 2.81��10-5 ��-1��s-n��cm-2 at OCP, and it decreased greatly to 1.23��10-5 ��-1��s-n��cm-2 at 0 V. The coverage rate of film was high at the potential of 0 V. Therefore, according to Eq. (3), the decreasing of capacitance value Cf related to the increasing of thickness of surface film of X2 at the potential of 0 V. The value of Cf increased slightly when the potential increased to 0.1 V. It resulted from both the decreased coverage rate and thickness of surface film of X2 with the increase of potential. When the polarization potential was 0.3 V, the capacitance value Cf increased dramatically. Moreover, the charge transfer resistance Rct decreased by more than 2 times compared with the sample treated at lower potentials. It resulted from the high coverage rate of the Cu(II) and Fe(III) oxygen-containing species and the greatly increased porosity of the film.
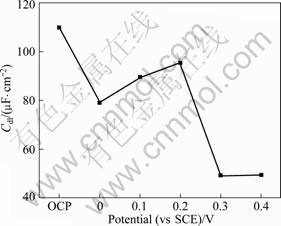
Fig. 7 Variation of Cdl related to potentials
Table 1 Fitting results for parameters in equivalent circuit model
Thus, EIS results proved that the surface film of X2 had good hydrophobicity at the potential of 0 V, and the hydrophobicity decreased when the potentials increased to 0.1 V and 0.2 V. When the potential was higher than 0.2 V, the hydrophobicity of the surface film decreased sharply due to the formation of plenty of the Cu(II) and Fe(III) oxygen-containing species with porous and loose structure on sample surface.
4 Conclusions
1) Under different potential conditions, the film with different properties formed on the natural chalcopyrite surface in electrolyte solution containing 5��10-4 mol/L ethyl xanthate. In the potential range from -0.11 to 0.2 V (vs SCE), the electrochemical reaction corresponding to the formation of the X2 film occurred on chalcopyrite surface. The hydrophobic film of X2 had high coverage rate and large thickness at the potential of 0 V. The coverage rate and thicknesses of surface film of X2 decreased with increasing the potential. When the potential increased to 0.3 V, electrochemical activation started to occur on the chalcopyrite surface, and the surface film transformed to plenty of Cu(II) and Fe(III) oxygen-containing species with good hydrophilicity. The surface film presented the porous and loose characteristics.
2) Surface film of X2 had good hydrophobicity at the potential of 0 V, and the hydrophobicity decreased when the potentials increased to 0.1 V and 0.2 V.
References
[1] HU Yue-hua, SUN Wei, WANG Dian-zuo. Electrochemistry of flotation of sulphide minerals [M]. Beijing: Tsinghua University Press, 2009. (in Chinese)
[2] SUN S Y, WANG D Z, LI B Y. Study of electrochemical control flotation of sulfide ores [J]. Nonferrous Mining and Metallurgy, 1993(2): 15�C20. (in Chinese)
[3] GULER T, HICYILMAZ C. Hydrophobicity of chalcopyrite with dithiophosphate and dithiophosphinate in electrochemically controlled condition [J]. Colloids and Surfaces A: Physicochemical and Engineering Aspects, 2004, 235(1-3): 11�C15.
[4] KELEBEK S, YORUK S. Bubble contact angle variation of sulphide minerals in relation to their self-induced flotation [J]. Colloids and Surfaces A: Physicochemical and Engineering Aspects, 2002, 196(2-3): 111�C119.
[5] CNANDER S. Electrochemistry of sulfide flotation: Growth characteristics of surface coatings and their properties, with special reference to chalcopyrite and pyrite [J]. International Journal of Mineral Processing, 1991, 33(1-4): 121�C134.
[6] EKMEKCI Z. Role of galvanic interaction on the collectorless flotation of chalcopyrite�Cpyrite [D]. Ankara: Hacettepe University, 1995: 40�C49.
[7] PERSSON P, MALMENSTEN B. Interactions between sulfide minerals and alkylxanthate ions (Part 5): A vibration spectroscopic study of the interactions between chalcocite, synthetic copper(I) sulfide, acanthite and synthetic silver(I) sulfide, and ethylxanthate ions in aqueous and acetone solutions [J]. Colloids and Surface, 1991, 59: 279�C292.
[8] WOODS R, KIM D S, BASILIO C I, YOON R H. A spectroscopic study of chemisorption of ethyl xanthate on gold [J]. Colloids and Surface A: Physicochemical and Engineering Aspects, 1995, 94(1-2): 67�C74.
[9] VELASQUEZ P, LEINEN D, PASCUAL J, RAMOS-BARRADO J R, CORDOVA R, GOMEZ H, SCHREBLER R. SEM, EDX and EIS study of an electrochemically modified electrode surface of natural enargite (Cu3AsS4) [J]. Journal of Electroanalytical Chemistry, 2000, 494(2): 87-95.
[10] GULER T, HICYILMAZ C, GOKAGAC G, EKMEKCI Z. Electrochemical behaviour of chalcopyrite in the absence and presence of dithiophosphate [J]. International Journal of Mineral Processing, 2005, 75(3-4): 217�C228.
[11] GONG Ming-guang. Froth flotation[M]. Beijing: Metallurgical Industry Press, 2008. (in Chinese)
[12] PAJKOSSY T, NYIKOS L. Diffusion to fractal surfaces (II): Verification of theory [J].Electrochimica Acta, 1989, 34(2): 171�C179.
[13] PAJKOSSY T. Capacitance dispersion on solid electrodes: anion adsorption studies on gold single crystal electrodes [J]. Solid State lonics, 1997, 94(1-4): 123�C129.
[14] KERNER Z, PAJKOSSY T. Impedance of rough capacitive electrodes: The role of surface disorder [J].Journal of Electroanalytical Chemistry, 1998, 448(1): 139�C142.
[15] SONG Y W, SHAN D Y, CHEN R S, HAN E H. Investigation of surface oxide film on magnesium lithium alloy [J]. Journal of Alloys and Compounds, 2009, 484(1): 585�C590.
[16] SOUZA M E P, BALLESTER M, FREIRE C M A. EIS characterisation of Ti anodic oxide porous films formed using modulated potential [J]. Surface and Coatings Technology, 2007, 201(18): 7775�C7780.
[17] CHEN J, WANG J Q, HAN E H, DONG J H, KE W. AC impedance spectroscopy study of the corrosion behavior of an AZ91 magnesium alloy in 0.1 M sodium sulfate solution [J]. Electrochimica Acta, 2007, 52(31): 3299�C3309.
��λ����Ȼ��ͭ�����Ĥ�����ʵ�Ӱ��
�� ��1, ���Ӣ1, ���о�2
1. ������ѧ ������ұ��ѧԺ������ 110004;
2. ������ѧ ��ѧԺ������ 110004
ժ Ҫ������ѭ������(CV)��ɨ���������(SEM)�͵绯ѧ�迹��(EIS)�о���ͭ���ں���5��10-4 mol/L�һ�ҩ��Һ�еĵ绯ѧ��Ϊ�Լ���λ�Ի�ͭ�����Ĥ��ɷֺ����ʵ�Ӱ�졣����������ڿ�·��λ(OCP)�£���Ȼ��ͭ����淢����ҩ�����ӵ��������̣���������λ��Χ-0.11��0.2 V�ڣ���Ҫ������ҩ�����������γ���ˮ˫��ҩĤ��ĵ绯ѧ���̡��γɵ�˫��ҩĤ���ڵ�λΪ0 Vʱ���нϸ߸��ǶȺͽϴ�ĺ�ȣ����ŵ�λ�����ӱ���˫��ҩĤ��ĸ��ǶȺͺ�ȼ�С������λ����0.2 Vʱ����ͭ����淢����������ܽ�Ϊ���ĵ绯ѧ���̣���ͭ�������˫��ҩĤ��ת����Ϊ�������ж�����ɽṹ�ĺ���Cu(��) ��Fe(��)�������
�ؼ��ʣ���λ����ͭ����Ĥ�㣻��ҩ
(Edited by YUAN Sai-qian)
Foundation item: Project (50874030) supported by the National Natural Science Foundation of China; Project (N090602011) supported by the Fundamental Research Funds for the Central Universities, China; Project (2009AA06Z104) supported by the National High-Tech Research and Development Program of China
Corresponding author: YANG Hong-ying; Tel: +86-24-83680373; E-mail: yanghy@smm.neu.edu.cn
DOI: 10.1016/S1003-6326(11)60945-X

