
Ageing process of pre-precipitation phase in Ni0.75Al0.05Fe0.2 alloy based on phase field method
DONG Wei-ping1, WANG Yong-xin1, CHEN Zheng1, 2, YANG Kun1
1. College of Materials Science and Engineering, Northwestern Polytechnical University, Xi��an 710072, China;
2. State Key Laboratory of Solidification Processing, Northwestern Polytechnical University, Xi��an 710072, China
Received 10 May 2010; accepted 9 September 2010
Abstract: By utilizing phase field method combined with analysis on free energy and interatomic potentials, pre-precipitation phase formation and transformation process of Ni0.75Al0.05Fe0.2 alloy in early precipitation stage during the ageing process under 1 000 K were studied. And free energy, microstructures, compositions and volume fractions of pre-precipitation phase and equilibrium phase were analyzed. The simulation results indicate that nonstoichiometric L10 pre-precipitation phase formed first, and then would gradually transform into L12 equilibrium phase. It is discovered that the phase transformation process was closely related to free energy and interatomic potentials. Additionally, it is revealed that free energy of L10 pre-precipitation phase was higher and interatomic potential was smaller than that of L12 equilibrium phase. Therefore, it is concluded that L10 phase was unstable, and phase transformation would occur to L12 which was more stable.
Key words: pre-precipitation phase; equilibrium phase; interatomic potentials; free energy; phase field method
1 Introduction
The precipitate transformation in precipitation process is regulated by atomic diffusion. Therefore, a series of metastable phases could probably be formed in this process[1]. To date, the diffusive phase transitions only include equilibrium phases. But some physical changes that preceded the formation of equilibrium phases determine the structures and properties to a certain extent, which is also instructive to practical production. Thereby, investigations on them have attracted attention for many years[2-3]. Al-Cu alloy series had been studied most extensively[4-5]. Metastable or transitional nonequilibrium phases precipitate first when alloys quickly cool off from single-phase region to double-phase region[6]. And these nonequilibrium phases are called ��pre-precipitation phase��. However, this process is so transient that it can be finished instantaneously. Therefore, it is difficult to conduct an investigation by conventional experimental methods. LI et al[7] prepared Cu-1.56Cr alloy powder by utilizing fog test and implemented ageing at 500 ��C. And it was found that there were two modulated metastable structures which could offer structural transition from FCC oversaturation solid solution to BCC precipitated phase. TAWANCY and ABOELFOTOH[8] discovered that there are D022 and D1a super-structure as a transitional metastable phase in Ni2(Cr, Mo) evolving with time during ageing process using TEM images. In relation to the temporal and spatial scales of alloy in early precipitation stage, the temporal one is in time-scale of seconds and the spatial one stays in volume-scale of ten to hundred atoms. Therefore, it forms nano-scale dispersion strengthening phase. It is necessary to employ computer simulations to analyze patterns in early precipitation stage of alloys because existing measurements are insufficient and incapable of examining them thoroughly. In terms of computer simulations, CHEN and KHACHATURYAN[9] utilized microscopic phase field method to simulate alloys and discovered the probable existence of virtual ordered phase during the transformation process from evenly disordered phase to double equilibrium phase. REINHARD and TURCHI[10] found that B32 transitional ordered phase would appear when the quenched solid solution was dissolved into Ti-and V- rich disordered phase with Monte-Carlo method. SOISSON and MARTIN[11] studied the decomposition of the instantaneous nucleation and the steady-state nucleation dynamics of metastable solution with Monte Carlo method. NI et al[12-14] found that nonequilibrium phase of quenched alloy turned to equilibrium ordered phase during the ordering process with microscopic master equation. TSAO et al[15] made quantitative analysis on natural ageing of Al-Mg-Si alloy with continuous heating and reciprocal transformation between metastable phase �¡� and �¡� during the subsequent isothermal aging process by integrating SAXS, TEM and the numerical simulation of the classical theory.
The microscopic phase field adopted in this study is a type of deterministic phase field method which is capable of describing all diffusion processes, including atomic clustering, ordering, crystal boundary migration, growing up and coarsening of new phase, and formation of transient phase. In addition, this model can reproduce microstructures, compositions and order degree changes of the system in early precipitation stage thoroughly. So it has shown a great advantage in the study of pre-precipitation phase. MIAO et al[16] and ZHAO et al[17] found that pre-precipitation phase L10 would separate out during ageing process of Ni80Al13Cr7 and Ni75Al17Zn8 alloys by this model. Free energy is based on continuous medium. And many previous investigations used it to discuss and explain the various phenomena of micro-organizational processes, but it had been proven to be very limited in atomic simulation. Since the interatomic potentials are the basis of computer simulation on properties and processes of atomic condensed matters, it is quite reasonable to study the process of precipitation by combining free energy and interatomic potentials.
2 Theoretical models
2.1 Microscopic phase field model
The phase field dynamic equation is based on the Onsager and Ginzburg-Landau theories, which describe atomic configuration and the precipitation pattern of the ordered phases by the occupation probability P(r, t) at the crystal lattice site r and the time t, whose change rate is proportional to the variation of free energy. The kinetic equation is written as
 (1)
(1)
For ternary system, atomic occupation probabilities satisfy
 (2)
(2)
where the subscripts A, B and C designate three kinds of atoms. In this simulation, it puts the simplification for crystalline defects, but just considers the integrated lattice to response atomic diffusion. Therefore the equations can be obtained by
 (3)
(3)
where ��(r, t) is the random noise term; L(r-r��) is the proportionality constant.
In the mean-field approximation, the free energy for ternary system is given by
 (4)
(4)
where kB is the Boltzmann constant; VAB(r-r��) is the effective interactive energy given as
 (5)
(5)
where WAA, WBB, WAB are pairwise potentials between A and A, B and B, and A and B. In order to keep reliabilities of simulations, the fourth nearest-neighbor interaction is adopted. VAB1, VAB2, VAB3, VAB4 stand for the first-nearest, second-nearest, third-nearest and fourth-nearest interactive energies, respectively. Then substitute them into the FCC, reciprocal space:
 (6)
(6)
For
 (7)
(7)
where k, h and, l are reciprocal lattice sites; a1*, a2* and a3* are the unit reciprocal lattice vectors of the FCC structure along three directions.
2.2 Interatomic potentials equations
The evaluation equations of interatomic potentials were initially proposed by KHACHATURYAN[18]. Based on concentration wave equations, the relational equations between occupation probability of solute atoms (B atoms) and free energy were deduced out:
 (8)
(8)
where c is atomic concentration of solute atoms (B atoms); ��s corresponds to long range order parameter; Es(r) denotes a function associated with lattice symmetry; �� means chemical potential between atoms; t-1 indicates the number of non-zero vector ks in superlattice structure, with kB being the Boltzmann constant; T is temperature; V(0) is potential energy of disordered atoms.
There are two occupations of L12 phase: c(1+3��) and c(1-��). The equation between the first nearest neighbor interatomic potential VAB1 of L12 phase and long range order parameter can be gained according to Eq.(8):
 (9)
(9)
And L10 phase also has two occupations: c(1+��) and c(1-��). The equation between the first nearest neighbor interatomic potential VAB1 of L10 phase and long range order parameter also can be gained according to Eq.(8):
 (10)
(10)
The first nearest neighbor interatomic potential VAB1 of L12 phase and L10 phase under varying temperature and atomic concentrations can be computed out by considering Eqs.(9) and (10). This study initiates simulations on Ni0.75AlxFe0.25-x alloy based on the aforementioned equations. They can overcome the deficiencies of conventional model ignoring the impact of temperature and concentrations, as well as using fixed interaction potential values in simulation computation.
3 Results
Due to the close connection between free energy and interatomic potentials of alloy in precipitation process, here we use atomic evolution maps, occupation probabilities and volume fractions to study this type of connection. Using the calculated interatomic potentials at 1 000 K, the atomic evolution maps of Ni0.75Al0.05Fe0.2 alloy with varying time step are illustrated in Fig.1, in which the black parts indicate Ni basal body and white parts correspond to Al(Fe) atoms. The L10(Ni-Al(Fe)) phases and L12(Ni-Al(Fe)) phases gained during the precipitation process of alloy are marked in the maps. The map is totally gray when the time step is 10, which indicates the basal body is in complete disorder, as shown in Fig.1(a). As time goes by, many ordered phases separate out. When time step increases to 1 200, a few L10(Ni-Al(Fe)) phases while only a small amount of L12(Ni-Al(Fe)) phases appear. And Fig.1(c) demonstrates that L10(Ni-Al(Fe)) phases start to transform into L12(Ni-Al(Fe)) phases when time step is 1 500, which testifies the fact that pre-precipitation phases L10 are quite unstable and their existences are very transient. In Fig.1(d), L12(Ni-Al(Fe)) phases have already occupied the whole evolution map when time step is 2 000. And most ordered L12(Ni-Al(Fe)) phases are interconnected, which means that L10(Ni-Al(Fe)) phases have already transformed into L12(Ni-Al(Fe)) phases completely. When time step reaches 10 000, as illustrated in Fig.1(e), the previous ordered phases gradually grow up and form into the stoichiometric order phase of L12 phases. With time step of 200 000, Fig.1(f) shows that occupation probabilities of atoms in corresponding lattice have ultimately arrived at their equilibrium values, and L12 phases coarsen. The above results are consistent with the precipitation process, which fully indicates that corresponding phase transformation outcomes could be gained by employing interatomic potentials obtained from equation calculations to model the microscopic phase field. And the L12 phases in Fig.1(e) match well with the experimental results by HIMURO et al[19].
From the evolution maps, we know that there are pre-precipitation phases L10 in the precipitation process of Ni0.75Al0.05Fe0.2 alloy. In order to further clarify the early precipitation effects and the transformation process of equilibrium phase, we analyzed the two-dimensional atomic structure and the evolution maps changing with time step shown in Fig.2 and the occupation probability curves shown in Fig.3. Among them, Fig.2(a) shows L10 atomic structure and related atomic evolution map of phase, in which the indices (lattice positions) ��, �� and �� in atomic structure correspond to the same indices in the evolution map. Similarly, Fig.2(b) means the atomic structure and related atomic evolution map of L12 phase. Specifically, the indices in Fig.2(a) and Fig.2(b) indicate the same lattice position. As seen from the Fig.2(a) and Fig.2(b), the element in lattice position �� is black Ni all the time; the element of lattice position �� in Fig.2(a) is white Al(Fe), but it is replaced by black Ni in Fig.2(b); white Al(Fe) occupies lattice position �� all along, but it whitens more and transforms from equilibrium phase to stoichiometric structure as time step increases. These correspond to atomic structures of pre-precipitation phase L10 (Ni-Al (Fe)) and equilibrium phase L12 (Ni- Al(Fe)).
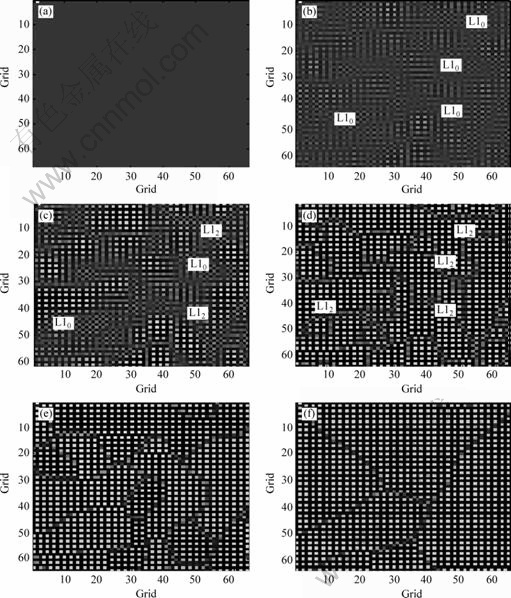
Fig.1 Temporal atomic evolution maps of Ni0.75Al0.05Fe0.2 alloy at 1 000 K: (a) t=10 step; (b) t=1 200 step; (c) t=1 500 step; (d) t= 2 000 step; (e) t=10 000 step; (f) t=200 000 step
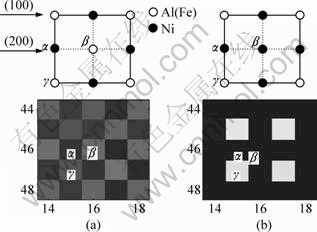
Fig.2 Atomic structure and simulated evolution maps: (a) t= 1 200 step, L10 phase; (b) t=2 000 step, L12 phase
The atomic structure transformation processes demonstrated by Fig.2 is inadequate to further specifically study the transformation status of occupation probabilities at each lattice position. The atomic occupation probability (concentration) variation curves shown in Fig.3 must be incorporated, in which the solid line corresponds to occupation of Ni atoms, the long-dashed line means occupation of Fe atoms and the dashed line denotes occupation of Al atoms. Fig.3(a) indicates the atomic occupation probability changes with time step variance at lattice position �� in Fig.2. It is obvious that Ni atomic occupation probability increases up to near 1 while both Fe and Al decrease to around 0. Thus it is consistent with the fact that Ni atoms occupy lattice position �� all the time. Figure 3(b) shows the atomic occupation probability at lattice position �� in Fig.2. It is indicated that occupation probability of Ni atoms first goes down to near 0.5 and then increases to around 1, but Fe and Al first increase to near 0.5 and then decrease to around 0. Therefore, L10 phase does not arrive at stoichiometric structure. This is in line with the change in lattice position �� from Fig.2(a) and Fig.2(b), which signifies that Al(Fe) atoms will be replaced by Ni atoms. That is, the transitional pre-precipitation phases L10(Ni-Al(Fe)) exist. Similarly, Fig.3(c) corresponds to the atomic occupation probability at lattice position �� in Fig.2. It is represented that occupation probabilities of Ni atoms keep getting down to near 0, while occupation probabilities of Fe and Al atoms maintain increasing till around 1, which is corresponding to changes at lattice position �� from Fig.2(a) and Fig.2(b). They could explain the fact that Al(Fe) atoms occupy lattice position �� all the time until they reach equilibrium phase L12.
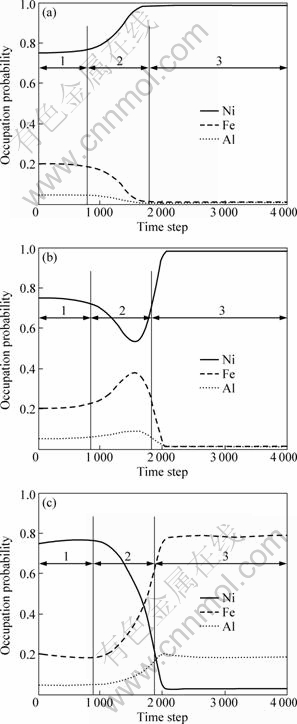
Fig.3 Occupation probability changes with time step: (a) �� lattice; (b) �� lattice; (c) �� lattice (1��Gestation of disordered basal body; 2��Migration process of disordered phase to pre-precipitation L10 phase, and L10 phase migrates into equilibrium L12 phase; 3��Coarsening and growing-up process of L12 phase)
Before lattice positions �� and �� come to equilibrium phases, reduction occupation probabilities of Al(Fe) atoms corresponds to the increase of lattice position ��. This denotes the migration of Al(Fe) atoms during the precipitation process; the increase of occupation probabilities of Ni atoms before lattice �� and �� reaches equilibrium phases and means the reduction of lattice position ��, which indicates that migration of Ni atoms could also occur in precipitation process. Moreover, the migration process is in correspondence with such procedure: disordered phase��pre-precipitation phase L10(Ni-Al(Fe))��equilibrium phase L12(Ni-Al(Fe)). This procedure is illustrated by sections 1, 2 and 3 in the curve in Fig.3, respectively.
The alloy volume fraction curves of precipitation phases are shown in Fig.4. Obviously, between the 1 000th and 2 000th step L10 phase increases rapidly, which also shows the existence of pre-precipitation phase L10. And a sharp reduction after that indicates that L10 phase changes to equilibrium phase L12. The curve of L12 phase increases after the step 2 000, which means the L12 phase forms until the step 2 000.
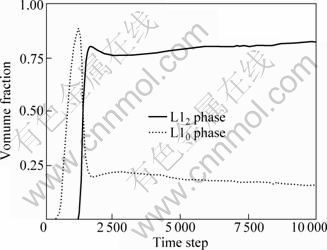
Fig.4 Volume fractions of different phases with time steps
4 Discussion
Studies found that parent phase usually could not transform into the lowest free energy equilibrium phase directly during the phase transition process. It turned into pre-precipitation phase of which the free energy was lower than parent phase but higher than equilibrium phase. This pre-precipitation phase is approximately comparable to crystal structures and chemical compositions with parent phase. In order to lower the interfacial energy between basal body and precipitant, pre-precipitation phase tends to possess similar structures with basal body. In the Ni0.75Al0.05Fe0.2 alloy, the structure of L10 phase is more close to the structure of disordered basal body. Therefore, prior to the formation of L12 phase, L10 phase will be formed first. The curve of free energy calculated by Eq.(4) changes with the molar fraction shown in Fig.5(a). From Fig.5(a), free energy continues to lower from the disordered phase to the L12 phase, which means the pre-precipitation phase L10 is served as the transitional phase during the decreasing process of free energy, so the unstable L10 phase will transform to the L12 phase. Figure 5(b) demonstrates the interatomic potentials calculated by Eqs.(9) and (10) for different phases with varying long-range order parameters. They all could increase with the augmentation of long-range order parameter. It is obviously shown that, for each curve, the interatomic potentials first go up gradually with increasing long-range order parameter, and then skyrocket when the parameter approaches to 1. More specifically, the potential curve of L10 phase is in the bottom, which means that its potentials are the least in the alloy. All potential curves of L12 phase are higher than those of L10 phase, and with L12(Ni-Al(Fe)) on the top. The size relations of these potentials would affect the stability of pre-precipitation phase and equilibrium phase of alloy during the precipitation process. However, as seen from interatomic potentials curves in Fig.5(b), interatomic potentials of L10 are less than those of L12, which means that L10 phase is not as stable as L12 phase, and the pre-precipitation phase L10 will transform into equilibrium phase L12 that is more stable.
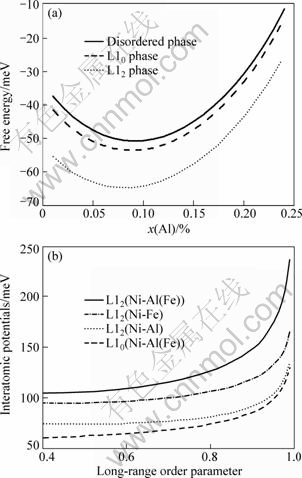
Fig.5 Free energy and interatomic potentials curves of different phases: (a) Free energy; (b) Interatomic potentials
5 Conclusions
1) Pre-precipitation phase L10 separates out before stable equilibrium phase L12 in Ni0.75Al0.05Fe0.2 alloy. And as time goes by, this unstable transitional phase L10 will transform into equilibrium phase L12 that is more stable.
2) Due to the unstable property of transitional phase, pre-precipitation phase L10 cannot reach stoichiometric structure. However, equilibrium phase L12 is stable and can coarsen and grow up as time goes by. Therefore, it could arrive at stoichiometric structure.
3) Free energy lowers from the disordered phase to L10 phase to L12 phase. And the interatomic potentials of L12 phase are larger than those of L10 phase. Therefore, L10 phase is unstable, and will transform into L12 phase as time increases.
4) The precipitation sequence of Ni0.75Al0.05Fe0.2 alloy is:

References
[1] BODEGA J, GARC?S G, LEARDINI F, ARES J R, FERN?NDEZ J F, ADEVA P, S?NCHEZ C. A new metastable crystalline phase in the Cr-Zr system [J]. Intermetallics, 2010, 18: 1099-1101.
[2] SHI Hong-ting, NI Jun. Ordering and metastable state during the growth of fcc alloy monolayers [J]. Physical Review B, 2002, 65: 115422.
[3] MU Si-guo, CAO Xing-min, TANG Yu-qiong, XIANG Chao-jian, YANG Chun-xiu, GUO Fu-an, TANG Mo-tang. Microstructure and properties of aging Cu-Cr-Zr-Mg-RE alloy [J]. The Chinese Journal of Nonferrous Metals, 2007, 17(7): 1112-1118. (in Chinese)
[4] HUANG L P, CHEN K H, LI S, SONG M. Influence of high-temperature pre-precipitation on local corrosion behaviors of Al-Zn-Mg alloy [J]. Scripta Materialia, 2007, 56: 305-308.
[5] CHEN Hui, LUO Ji-man, HAN Ze-guang, XU Xi-sha. Study on milling induced structural transformation in Al-Zn-Cu alloys[J]. Journal of Shenyang Jianzhu University: Natural Science, 2007, 23(4): 672-675. (in Chinese)
[6] WANG Zhen-ling, WANG Hong-wei, WEI Zun-jie, CAO Lei. High pressure solidification microstructure and stability of Al-9.6%Mg alloy [J]. The Chinese Journal of Nonferrous Metals, 2007, 17(3): 384-389. (in Chinese)
[7] LI Qiang, CHEN Jing-chao, SUN Jia-lin. The meta-stable structure of aging Cu-Cr alloy [J]. Rare Metals and Cemented Carbides, 2006, 34(4): 1-5. (in Chinese)
[8] TAWANCY H M, ABOELFOTOH M O. Application of long-range ordering in the synthesis of a nanoscale Ni2(Cr,Mo) superlattice with high strength and high ductility [J]. Materials Science and Engineering A, 2009, 500: 188-195.
[9] CHEN Long-qing, KHACHATURYAN A G. Formation of virtual ordered states along a phase-decomposition path [J]. Physical Review B, 1991, 44(9): 4681-4684.
[10] REINHARD L, TURCHI P E A. Transient ordered states in phase-separating alloys [J]. Physical Review Letters, 1994, 72(1): 120-123.
[11] SOISSON F, MARTIN G. Monte Carlo simulations of the decomposition of metastable solid solutions: Transient and steady-state nucleation kinetics [J]. Physical Review B, 2000, 62(1): 203-214.
[12] NI Jun, GU Bing-lin. Transient ordered states during relaxation from a quenched disordered state to an equilibrium disordered state [J]. Physical Review Letters, 1997, 79(20): 3922-3925.
[13] NI Jun, SHI Hong-ting, GU Bing-li. Kinetics of ordering for a ternary system on square lattice [J]. Physica A, 2002, 303: 397-409.
[14] NI Jun, GU Bing-lin. Kinetics of ordering in fcc alloys during codeposition [J]. Surface Science, 2002, 499: 174-182.
[15] TSAO C S, CHEN C Y, JENG U S, KUO T Y. Precipitation kinetics and transformation of metastable phases in Al-Mg-Si alloys [J]. Acta Materialia, 2006, 54: 4621-4631.
[16] MIAO Shu-fang, CHEN Zheng, WANG Yong-xin, XU Cong, MA Rui, ZHANG Ming-yi. Microscopic phase-field method simulation for the in situ transformation of L10 phase and L12 phase structure [J]. Acta Metallurgica Sinica, 2009, 45(5): 630-634. (in Chinese)
[17] ZHAO Yan, CHEN Zheng, LU Yan-li, ZHANG Li-peng. Microscopic phase-field study on aging behavior of Ni75Al17Zn8 alloy [J]. Transactions of Nonferrous Metals Society of China, 2010, 20: 675-681.
[18] KHACHATURYAN A G. Theory of structural transformation in solids [M]. New York: Wiley, 1983.
[19] HIMURO Y, TANAKA Y, KAMIYA N, OHNUMA I, KAINUMA R, ISHIDA K. Stability of ordered L12 phase in Ni3Fe-Ni3X (X:Si and Al) pseudobinary alloys [J]. Intermetallics, 2004, 12(6): 635-643.
�����ೡ����Ni0.75Al0.05Fe0.2�Ͻ�Ԥ������ʱЧ����
����ƽ1��������1���� �1, 2���� ��1
1. ������ҵ��ѧ ����ѧԺ������ 710072��
2. ������ҵ��ѧ ���̼��������ص�ʵ���ң����� 710072
ժҪ�������ೡ����������ܺ�ԭ�Ӽ��������о���Ni0.75Al0.05Fe0.2�Ͻ���1 000 KʱЧ�г���ǰ�ڵ�Ԥ��������γɺ�ת����̣������˳���ǰ��Ԥ�������ƽ����������ܡ��ṹ���ɷֺ������������ʱ��ı仯���о����������ڽṹ�ӽ���ԭ�����������γɷǻ�ѧ������Ԥ������L10������ʱ����ӳ���Ԥ������L10����L12��ת�䣬���ﵽ��ѧ������ƽ����L12���ҷ��ִ�ת������������ܺ�ԭ�Ӽ��������йأ�Ԥ������L10��ƽ����L12�������ܸ���ԭ�Ӽ�������С����L10��ȶ���ת��Ϊ�ȶ���L12�ࡣ
�ؼ��ʣ�Ԥ�����ࣻƽ���ࣻԭ�Ӽ������ƣ������ܣ��ೡ��
(Edited by YANG Hua)
Foundation item: Projects(10902086, 50941020, 50875217) supported by the National Natural Science Foundation of China; Projects(JC201005) supported by Basic Research Fund of Northwestern Polytechnical University, China; Project supported by Graduate Starting Seed Fund and Doctoral Foundation of Northwestern Polytechnical University, China
Corresponding author: DONG Wei-ping; Tel: +86-29-88486023; E-mail: penny1688@gmail.com
DOI: 10.1016/S1003-6326(11)60828-5

