
Trans. Nonferrous Met. Soc. China 24(2014) 1819-1829
Simulated and experimental investigation on discontinuous dynamic recrystallization of a near-a TA15 titanium alloy during isothermal hot compression in b single-phase field
Chuan WU, He YANG, Hong-wei LI
State Key Laboratory of Solidification Processing, School of Materials Science and Engineering, Northwestern Polytechnical University, Xi��an 710072, China
Received 28 June 2013; accepted 9 August 2013
Abstract:
A cellular automaton (CA) modeling of discontinuous dynamic recrystallization (DDRX) of a near-�� Ti-6Al-2Zr-1Mo-1V (TA15) isothermally compressed in the b single phase field was presented. In the CA model, nucleation of the b-DDRX and the growth of recrystallized grains (re-grains) were considered and visibly simulated by the CA model. The driving force of re-grain growth was provided by dislocation density accumulating around the grain boundaries. To verify the CA model, the predicted flow stress by the CA model was compared with the experimental data. The comparison showed that the average relative errors were 10.2%, 10.1% and 6%, respectively, at 1.0, 0.1 and 0.01 s-1 of 1020 ��C, and were 10.2%, 11.35% and 7.5%, respectively, at 1.0, 0.1 and 0.01 s-1 of 1050 ��C. The CA model was further applied to predicting the average growth rate, average re-grain size and recrystallization kinetics. The simulated results showed that the average growth rate increases with the increasing strain rate or temperature, while the re-grain size increases with the decreasing strain rate; the volume fraction of recrystallization decreases with the increasing strain rate or decreasing temperature.
Key words:
discontinuous dynamic recrystallization; cellular automaton; dislocation density evolution; recrystallization kinetics; TA15 titanium alloy;
1 Introduction
The Ti-6Al-2Zr-1Mo-1V alloy (TA15) is a type of near-a titanium alloy that possesses a unique combination of properties such as high strength and toughness, low density, good corrosion resistance and excellent high-temperature properties [1,2]. Therefore, the TA15 alloy has been widely used in the aviation and aerospace industry to produce the compressor blades and compressor disks of gas turbine engines, as well as the large front fans of modern jet engines. Hot working, including isothermal processing, is the most applicable forming process for the alloy [3]. During this process, complex microstructural evolution takes place and, in turn, significantly influences the deformation behavior of the material as well as the mechanical properties [4]. Discontinuous dynamic recrystallization (DDRX) is a common microstructural phenomenon for the alloy deformed in the b single phase field. According to the DDRX model proposed by  and ORTNER [5], the occurrence of DDRX is closely related to the dislocation density in the matrix grains. A new recrystallized nucleus appears once the dislocation density in the matrix reaches a critical value. As the deformation continues, the nucleus takes place growing.
The DDRX is sensitive to temperature, strain and strain rate, and is easily affected by the non-uniform deformation at the grain level. Furthermore, the DDRX has an important effect on the grain size and morphology evolution. Therefore, it is significant to investigate the DDRX of titanium alloys deformed at high temperatures.
During the past years, many researchers have carried out experimental investigations on the DDRX of titanium alloys. OUYANG et al [1] investigated the DDRX of the TA15 alloy at deformation temperature of 1050-1100 ��C and strain rate of 10-3-1 s-1. They determined the critical condition for the onset of DDRX during deformation of �� single-phase field by computation of the work hardening rate and inflection point from the experimental stress-stain data. They also investigated the nucleation of DDRX of the TA15 alloy in the b single-phase field by hot compression and EBSD (electron backscatter diffraction) technique [6]. DING and GUO [7] investigated the microstructural evolution of the Ti-6Al-4V titanium alloy during the thermo-mechanical processing. The researchers�� experimental results indicated that the DDRX occurred when the alloy was processed in the b single-phase field. WANJARA et al [8] and VO et al [9] investigated the effect of deformation conditions on the microstructural evolution of the IMI834 alloy at different temperatures. They found that some small b recrystallized grains (re-grains) were formed at previously existing b grain boundaries in the b single-phase field.
Apart from the aforementioned experimental investigation on the DDRX of titanium alloys, various numerical models have been proposed to investigate the DDRX. SUN et al [10] developed an internal-state- variable model to simulate the DDRX of the TA15 alloy in the ��+�� two-phase field to investigate the softening mechanism. FAN and YANG [11] established an internal-state-variable-based self-consistent constitutive model to predict the flow stress and the DDRX in the b single-phase field during hot deformation. WANG et al [12] investigated the DDRX of the Ti-6.5Al-3.5Mo-1.5Zr-0.3Si alloy in the b single-phase field using finite element simulation and compared the predicted results, including the volume fraction of recrystallization and the grain size, with the experimental measurements. DING and GUO [7] modeled the DDRX of the Ti-6Al-4V titanium alloy deformed in the b single-phase field by a cellular automaton (CA) method. They used the CA model to predict the flow stress of the alloy during deformation. Moreover, they simulated quantitatively and topographically the microstructural evolution. Some other authors [13,14] also adopted the CA method to simulate the DDRX of carbon steel or pure Cu by the CA method.
However, there have been few studies conducted on a numerical simulation of the DDRX of TA15 titanium alloy at the mesoscale, such as using a CA modeling. Especially, there is little information concerning the CA modeling of re-grained growth, dislocation density evolution, recrystallization kinetics and the effects of processing parameters on them.
Therefore, the objective of this study is to investigate the DDRX of the TA15 alloy using the CA modeling and physical experiment. First, a CA model considering the nucleation, re-grains growth and the dislocation density evolution was developed. Second, the CA model was used to predict the growth rate of re-grains, re-grain size, dislocation density and recrystallization kinetics, and discuss the effects of strain, strain rate and temperature on them. To verify the predicted results, they were compared with the experimental data.
2 CA model of DDRX
In this study, the Kocks-Mecking equation (K-M model) [15] was employed to describe the dislocation evolution. The dislocation multiplication term is given by
 (1)
(1)
where  is the increasing rate of the dislocation density; k1 is a constant representing the work hardening effect; �� is the dislocation density;
  is the strain rate. The dislocation annihilation term, which is realized either by the glide of dislocations of opposite sign on the same glide plane or by the combination of dislocation glide, climb or cross slip on different glide planes, is given by
 (2)
(2)
where  is the decreasing rate of the dislocation density and k2 is a function depending on the strain rate and temperature that describes the thermally activated process performed by dislocation glide, climb or cross-slip. k2 is expressed as [11]
 (3)
(3)
where k20 and �� are fitting constants;  is the initial strain rate; Qact is the activation energy of deformation; R and T are the gas constant and thermodynamic temperature, respectively. ��-DDRX occurs in titanium alloys when a critical condition, such as critical dislocation density or strain, is met. The critical dislocation density is usually considered to be an effective index that indicates the occurrence of ��-DDRX at the grain level. Namely, ��-DDRX occurs once the dislocation density of a grain reaches a critical value ��c, which is given by [16]
 (4)
(4)
where �� is the grain boundary energy; b is the Burgers vector; l is the average free distance of dislocation; M is the boundary mobility; �� is the shear modulus. ��-DDRX usually takes place via a nucleation and growth process. The nuclei usually originate at zones comprising second-phase particles, grain boundaries or shear bands [17]. The nucleation rate,  , i.e., the number of nuclei formed in the deformed matrix per unit time per unit volume, is a function of both temperature and strain rate, and is expressed as [16]
 (5)
(5)
where C1 is fitting constant. It is assumed that the DDRX grain is spherical. During the growth process, the driving force P can be expressed as
 (6)
(6)
where  is the change of volume energy;
  is the change in the grain boundary energy. The value of , which provides the driving force, is given by
 (7)
(7)
where ��m and ��r are the dislocation densities of the matrix grain and the re-grains, respectively. The value of as a retarding force is given by
 (8)
(8)
where r is the grain radius. �� is the material shear modulus and is taken to be [18]
 (9)
(9)
The grain boundary energy, ��, is a function of the misorientation of adjacent subgrains; it can be calculated by the Read�CShockley equation [19]:
 (10)
(10)
where ��m is the grain boundary energy of the high-angle boundary, which can be directly calculated as follows [19]:
 (11)
(11)
where ��m is the misorientation angle when the grain boundary becomes a high-angle boundary (set to be 15�� in this study) and �� is the Poisson ratio. It is assumed that the driving force P is evenly distributed within the grains; thus the driving pressure p is given by
 (12)
(12)
The growth of re-grains is achieved by the migration of grain boundaries. The migration rate is a function of the grain boundary mobility M and the driving pressure p. M is defined by the following equation:
 (13)
(13)
where �� is the thickness of the characteristic boundary; D0b is the diffusion coefficient at 0 K; kB is Boltzmann constant; Qdiffu is the self-diffusion activation energy per mole. The migration rate v is expressed by
v=Mp (14)
The macroscopic flow stress during isothermal hot compression is related to the average dislocation density, which can be expressed by [16]
 (15)
(15)
The average dislocation density is equal to the average value over all the grains, which is expressed as
 (16)
(16)
where ��i and Vi are the dislocation density and volume of the ith grain, respectively; Vtotal and N are the the total volume and number of grains.
3 Experimental
A type of near-�� titanium alloy, TA15, was used for this study. The measured chemical compositions (mass fraction, %) were 6.8Al, 1.7Mo, 2.2V, 2.0Zr, 0.25Fe, 0.38 others and Ti for the balance, as listed in Table 1. The corresponding �� to �� transus temperature was 990 ��C. The cylindrical specimens have dimensions of 12 mm in height and 8 mm in diameter and were electro-discharged from the received machined material (forged billet).
The isothermal compression experiments were performed in a temperature range of 1020-1050 ��C and in a strain rate range of 0.01-1.0 s-1 on a Gleeble-3800D simulator. Prior to the deformation, each specimen was held at the tested temperature for 10-15 min to ensure a uniform temperature distribution throughout the specimen. The deformation temperature was measured by a thermocouple that was spot-welded to the center of the specimen surface. To reduce the die friction and ensure uniform deformation, two thin pieces of thallium were affixed to the flat dies. All of the compression tests were performed in an argon atmosphere. To preserve the microstructure at high temperatures, the compressed samples were water-quenched immediately after the compression tests.
Following the hot compression experiments, each sample was sectioned along the diameter direction at the mid-length location and prepared metallographically using a standard polishing and etching technique. The optical micrographs were shot at the magnification of 100 times near the mid-diameter position. At least five to seven micrographs at each deformation condition were used to estimate the average re-grain size and the recrystallization volume fraction. The re-grains were identified by classifying the grain aspect ratio and size. In general, a grain with an aspect ratio less than 2.5 and size less than that of the matrix was considered a new re-grain. Assuming a spherical shape of each re-grain, the radius ri of the ith re-grain was calculated by  , where Ai is the equivalent area of the ith grain. The average grain size (radius) <R> at each time step could be obtained by
  , where N is total number of the grains. The volume fraction of the recrystallization was calculated by fre=Are/At, where fre is the volume fraction, Are is the total area of all re-grains in a micrograph and At is the corresponding area of the micrograph.
4 Parameter determination
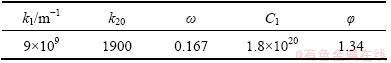
There are several parameters that must be determined in the model. Several of these parameters are physically meaningful and independent of strain, strain rate or temperature, such as the Burgers vector b (�� or b phase), grain boundary energy of the high-angle ��m, activation energy Qact for nucleation, thickness of the characteristic boundary ��, diffusion coefficient D0b at 0 K and self-diffusion activation energy, Qdiffu. These values were directly obtained and are listed in Table 1.
Other constants that must be determined by fitting experimental data include the constant k1 in Eq. (1), which represents work hardening, constants k20 and �� in Eq. (3), which represent the softening effect, and the nucleation constants C1 and �� in Eq. (5).
The value of �� was directly obtained from FAN and YANG [11]. Constant k1 in Eq. (1) represents the increasing rate of dislocation density due to dislocation multiplication, and constant k2 in Eq. (2) represents the dislocation annihilation induced by dislocation glide in the same system or either dislocation climb or cross slip between different systems. The values of k1 and k20 (in Eq. (3)) can be determined by fitting the experimental flow stress. In general, the dislocation generation can be gradually balanced by the dislocation annihilation after peak strain, which results in a steady stage. During this stage, the flow stress does not change with strain and is assumed to be equal to the peak stress. According to Eq. (15), the order of magnitude of the dislocation density in the matrix during steady state may be estimated. Hence, the ratio of k1 to k20 for the b phase can be determined from the equivalence of Eqs. (1), (2) and (3). Then, the specific values of k1 and k20 can be estimated using an optimization approach, such as a genetic algorithm (GA)-based objective optimization technique [20]. The GA is used as a stochastic search method based on evolution and genetics to search for the effective solution. For the GA optimization method, an objective function must be defined. In this study, the objective function is defined as
 (17)
(17)
where  represents the average dislocation density at a specific deformation condition j;
  is the corresponding predictive value of flow stress; �� is a constant (�� =0.5); n is the total number of all deformation conditions; �� j is the corresponding measured value in experiment. can be obtained by the K-M equation and can be rewritten as

 (18)
(18)
where  is the dislocation density of the ith grain at strain n���� and deformation condition j; ���� is the strain increment; N corresponds to the total number of steps until the strain reaches its peak value; Z represents
  . The values of k1 and k20 for the b phase are listed in Table 2.
Based on the assumption of a spheroidal grain, the volume fraction of recrystallization is approximately equal to [16]
 (19)
(19)
where fre and r are the volume fraction of recrystallization and the average re-grain size measured in experiments, respectively. Therefore, the value of n at different deformation conditions can be determined. According to Eq. (5), the values of C1 and �� can be obtained. The temperature-dependent shear modulus can be described by Eq. (9).
Table 1 Material constants used in the present study

Table 2 Fitting constants
5 Results and discussion
5.1 Morphological evolution
Figure 1 shows the morphological evolution of b-DDRX of the TA15 alloy predicted by the CA modeling, and its comparison with the experimental observation. The comparisons show good agreement. From Fig. 1, it can be seen that several new re-grains (denoted by red boundaries) are preferably formed around the b phase boundaries, although the b phase boundaries are not apparent in the experimental images, which may be due to the samples quenched with water immediately after compression. From these figures, it can also be observed that the re-grains nearly remain equiaxed during deformation and that the average re-grain size and the volume fraction of recrystallization are sensitive to strain. The average re-grain size and the volume fraction increases with the strain. The predicted average diameter increases from 20 ��m to 100 ��m and the volume fraction increases from 10% to 40% when the reduction increases from 20% to 60%. The re-grain size and the volume fraction are also sensitive to strain rate and temperature, which is discussed in sections 5.3 and 5.4.
5.2 Comparison of predicted with experimental flow stresses
In order to verify the CA model, the predicted stress-strain curves at different temperatures and strain rates are compared with the experimental data, as shown in Fig. 2. From Fig. 2(a), it can be seen that the predicted flow stresses agree better with the experimental values at strain rates of 1.0, 0.1 and 0.01 s-1, the average relative errors are 10.2%, 10.1% and 6%, respectively. However, there is a large difference between the predicted and experimental results during the initial stages. Especially, the difference increases with the increasing strain rate. The difference may be caused by the following reasons. First, the CA simulated process cannot make sure one to one with the real deformation process during the initial stage. Second, the experimental errors may be large in the initial stage. Therefore, the differences between the predicted and the experimental data are large.

Fig. 1 Comparison of experimental (a, b, c) and predicted (d, e, f) microstructures of TA15 alloy under 1050 ��C, 0.1 s-1 with different reduction amounts
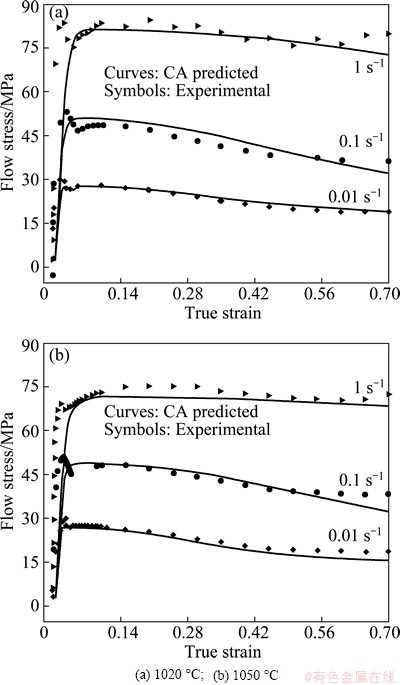
Fig. 2 Comparison of predicted and experimental flow stress of TA15 alloy under different deformation conditions
The predicted stress also exhibits a stronger dependence on temperature and strain rate, which indicates that the predicted stress increases with the increasing strain rate or decreasing temperature. It is also clear that the predicted stress-strain curves consist of two parts: work hardening and dynamic softening. For a small strain (less than 0.03), the flow stress rapidly increases to its peak value. After the peak stress, the stress begins to decrease due to a softening effect caused by the b-DDRX. The degree of the softening effect varies with strain rate and temperature. In the b single-phase field, the extent of softening increases with the increasing strain rate or decreasing temperature, which results from a higher volume fraction of recrystallization at higher strain rates or lower temperatures.
Similarly, from Fig. 2(b), it can be seen that the predicted flow stresses at 1050 ��C and strain rate of 0.01, 0.1 and 1.0 s-1 agree better with the experimental values and the average relative errors are 7.5%, 11.35% and 10.2%, respectively. During the initial deformation stages, the difference in flow stress between the predicted and the experimental data is larger than that at the steady stage.
5.3 Predicted recrystallization kinetics
The recrystallization kinetics of the TA15 alloy at different temperatures and strain rates is predicted and compared with the experimental results, as shown in Figs. 3(a) and (b). From these figures, it can be seen that the predicted volume fraction of recrystallization (fre) increases with time (strain). The fre increases slowly during the initial deformation stages while it rapidly increases with a further deformation, and finally tends to be steady. The developing tendency of fre is determined by the difference in the dislocation density between the matrix and the re-grains, and the nucleation areas. At the initial stages of recrystallization, the dislocation density in the matrix grains does not reach a saturated value, and the difference in the dislocation density between the recrystallized and matrix grains is smaller. Therefore, the driving force and the growth rate of re-grains are smaller, which results in a slower increase of fre. As the strain continues, the dislocation density in the matrix grains is gradually close to a saturated value; the driving force and the growth rate of re-grains gradually increase, which results in a rapid increase of fre. As the strain further continues, the dislocation density in the re-grains increases while the driving force decreases. Thus the growth rate of re-grains or the increasing rate of fre decreases. It is also clear that the effect of strain rate or temperature on fre is significant. The value of fre increases with increasing temperature or decreasing strain rate.
The predicted recrystallization kinetics of the TA15 alloy at 1020 ��C is shown Fig. 3(a). It can be seen that the predicted values agree better with the experimental values at 0.1 and 1.0 s-1, while the difference becomes much larger when the strain rate reduces to 0.01 s-1. The similar phenomenon can be observed at 1050 ��C, as shown in Fig. 3(b). This phenomenon can be explained as follows. For the TA15 alloy deformed in the b single-phase field, the fre increases with the decreasing strain rate. However, in this study, the sample was water-quenched immediately after deformation. This caused that the re-grain boundaries became blurred and were difficult to be distinguished. Thus, the fre measured in experiments was much smaller than the real value, and the difference between the predictions and the experimental measurements became large.

Fig. 3 Comparison of predicted recrystallization kinetics with experimental measurements at different temperatures
5.4 Predicted growth rate and size of re-grains
The average growth rate of re-grains at different temperatures and strain rates is shown in Fig. 4. During the initial deformation stages (strain less than 0.03), the dislocation density in the matrix grains is less than the critical value; there are no new nuclei on the grain boundaries, and the growth rate is close to zero. As the deformation continues, the dislocation density in the matrix grains is larger than the critical value, and new nuclei begin to form. Due to the difference in dislocation density between the recrystallized and matrix grains, the re-grains begin to grow. At the strain peak (strain in a range of 0.05-0.15), the driving force and the growth rate of re-grain reach their maximum values. As the deformation further continues, the dislocation density in the re-grains continually increases while the dislocation density in the matrix grains has reached a saturated value and nearly remains unchangeable. Thus the growth rate of re-grains decreases.
At the same temperature, the average growth rate of re-grains increases with the increasing strain rate. This is because the higher the strain rate is, the larger the saturated dislocation density in the matrix grains is and the larger the difference in the dislocation density between the recrystallized and matrix grains becomes, which results in a larger growth rate of the re-grains. At the same strain rate, the average growth rate of re-grains increases with the increasing temperature. Although the driving force for re-grain growth decreases with temperature, the mobility of re-grain boundaries increases. Moreover, the increasing degree of the boundary mobility is larger than that of the driving force decreasing. Therefore, the average growth rate of re-grains increases with temperature.
The predicted average radius of re-grains is compared with the experimental data, as shown in Fig. 5. From the Fig. 5, it can be seen that the comparison agrees better at strain rates of 0.01 and 0.1 s-1. However, at 1.0 s-1, the predicted results do not agree well with the experimental data. The reason causing the large difference has been given in section 5.3. At the same temperature, the average radius of re-grains decreases with the increasing strain rate. Although the average growth rate of re-grains increases with the increasing strain rate, the growth time for re-grains reduces sharply. Therefore, the average radius of re-grains decreases with the increasing strain rate. At the same strain rate, the average growth rate of the re-grains increases with temperature. Therefore, the average radius of re-grains increases with temperature within the same time. During the initial deformation stage (strain less than 0.03), there is no recrystallization and the average radius of re-grains is zero. The average radius of re-grains rapidly increases when the recrystallization takes place. However, the change rate of the average radius of re-grain gradually decreases with deformation. This is because the dislocation density in the re-grains increases with strain so that the difference in the dislocation density between the recrystallized and matrix grains and the driving force decrease. Thus the change rate decreases.

Fig. 4 Predicted growth rates of recrystallized grain at different temperatures and strain rates

Fig. 5 Comparison of predicted grain sizes with experimental data at different temperatures and strain rates

Fig. 6 Evolution of dislocation density in matrix and recrystallized grains at 1020 ��C and different strain rates
5.5 Dislocation density evolution
The evolution of average dislocation density in the matrix and re-grains for the TA15 alloy at temperatures of 1020 and 1050 ��C is shown in Figs. 6 and 7, respectively. From these figures, it can be seen that the effects of temperature and strain rate on dislocation density evolution are significant. At 1020 ��C (see Fig. 6), the saturated value of average dislocation density in matrix grains increases from 0.5 ��1015 to 3.0��1015 m-2 as the strain rate increases from 0.01 s-1 to 1.0 s-1. This is because the strain rate increases when there is no enough time for the dislocation to glide, climb or cross slip, so that more and more dislocations accumulate, which results in the increase of dislocation density. Similarly, at 1050 ��C, the saturated value of average dislocation density increases from 0.4��1015 to 2.9��1015, as shown in Fig. 7. At the same strain rate, the average dislocation density in the matrix grains decreases with the increasing temperature. This is because the higher the temperature is, the easier the climb or cross slip of dislocations takes place, which reduces the dislocation density.
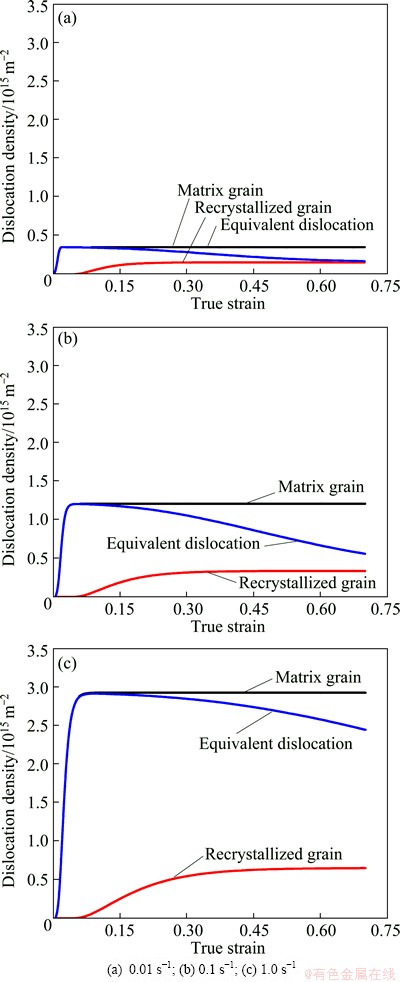
Fig. 7 Evolution of dislocation density in matrix and recrystallized grains at 1050 ��C and different strain rates
For the re-grains, the average dislocation density increases with the deformation. During the initial stages, the recrystallization does not take place and the dislocation density is much low (near zero). The dislocation density in the re-grains gradually increases due to the work hardening effect. The difference in the dislocation density between the matrix and re-grains decreases. As the deformation continues, the dislocation density in the re-grains gradually tends to be a saturated value. At a lower strain rate, the difference in the dislocation density between the matrix and re-grains is lower due to the lower dislocation density in the matrix grains.
During the initial stages, the recrystallizated phenomenon does not take place. Therefore, the equivalent dislocation density (volume average over the dislocation density in the matrix and re-grains) is equal to the dislocation density in the matrix grains. As the deformation further continues, the new nuclei begin to appear at the grain boundaries and to grow. At the same time, the matrix grains with relatively high dislocation density are consumed by the re-grains with a lower dislocation density. Thus, the equivalent dislocation density of the system decreases. Moreover, the volume fraction of recrystallization and the dislocation density gradually increase. Thus, the equivalent dislocation density tends to be steady. Especially at lower strain rates of 0.01 s-1 and 0.1 s-1, the saturated dislocation density in the re-grains is close to the value of matrix grains, so that the equivalent dislocation density nearly remains unchangeable.
6 Conclusions
1) The b-DDRX of TA15 titanium alloy at high temperatures was modeled by the CA method, considering the recrystallization nucleation and subsequent growth.
2) The parameters in the CA model were determined by fitting the experimental flow stress in the b single phase field.
3) To verify the CA model, the predicted flow stress was compared with the experimental data. The comparison showed that the average relative errors between them were 10.2%, 10.1% and 6%, respectively, at 1.0, 0.1 and 0.01 s-1 and 1020 ��C, and were 10.2%, 11.35% and 7.5%, respectively, at 1.0, 0.1 and 0.01 s-1 and 1050 ��C, which shows that the CA model is reliable.
4) The CA model was further used to predict the re-grain size, growth rate, and recrystallization kinetics, and they were compared with the experimental measurements. The results showed that the average growth rate increased with the increasing strain rate or temperature, while the re-grain size increases with the decreasing strain rate; the volume fraction of recrystallization decreases with the increasing strain rate or decreasing temperature.
References
[1] OUYANG De-lai, WANG Ke-lu, CUI Xia. Dynamic recrystallization of Ti-6Al-2Zr-1Mo-1V in beta forging process [J]. Transactions of Nonferrous Metals Society of China, 2012, 22(4): 761-767.
[2] LI Chao, ZHANG Xiao-yong, TANG Ren-bo, ZHOU Ke-chao. Deformation behaviors of Ti-5Al-5Mo-5V-1Cr-1Fe at high temperature [J]. The Chinese Journal of Nonferrous Metals, 2012, 22(7): 1914-1920. (in Chinese)
[3] FAN Xiao-guang, YANG He. Internal-state-variable based self-consistent constitutive modeling for hot working of two-phase titanium alloys coupling microstructure evolution [J]. International Journal of Plasticity, 2011, 27(11): 1833-1852.
[4] CHEN Hui-qin, CAO Chun-xiao. Characterization of hot deformation microstructures of alpha+beta titanium alloy with equiaxed structure [J]. Transactions of Nonferrous Metals Society of China, 2012, 22(3): 503-509.
[5] H P, ORTNER B. Recrystallization in hot working and creep [J]. Metal Science, 1974, 6(1): 161-167.
[6] OUYANG De-lai, LU Shi-qiang, CUI Xia, WU Chao, DONG Xian-juan. Nucleation of dynamic recrystallization of titanium alloy TA15 during hot deformation process in beta field [J]. Transactions of Materials and Heat Treatment, 2009, 30(6): 116-120. (in Chinese)
[7] DING R, GUO Z X. Microstructural evolution of a Ti-6Al-4V alloy during beta phase processing: Experimental and simulative investigations [J]. Materials Science and Engineering A, 2004, 365 (1-2): 172-179.
[8] WANJARA P, JAHAZI M, MONAJATI H, YUE S. Influence of thermomechanical processing on microstructural evolution in near-�� alloy IMI834 [J]. Materials Science and Engineering A, 2005, 416(1-2): 300-311.
[9] VO P, JAHAZI M, YUE S. Recrystallization during thermomechanical processing of IMI834 [J]. Metallurgical and Materials Transactions A, 2008, 39(12): 2965-2980.
[10] SUN Z C, YANG H, HAN G J, FAN X G. A numerical model based on internal-state-variable method for the microstructure evolution during hot-working process of TA15 titanium alloy [J]. Materials Science and Engineering A, 2010, 527 (15): 3464-3471.
[11] FAN X G, YANG H. Internal-state-variable based self-consistent constitutive modeling for hot working of two-phase titanium alloys coupling microstructure evolution [J]. International Journal of Plasticity, 2011, 27(11): 1833-1852.
[12] WANG K L, LANG K, FU M W, LU S Q, LI X. Study of the dynamic recrystallization of Ti-6.5Al-3.5Mo-1.5Zr-0.3Si alloy in ��-forging process via finite element method modeling and microstructure characterization [J]. Materials Design, 2011, 32(3): 1283-1291.
[13] CHEN F, CUI Z S, LIU J, ZHANG X X, CHEN W. Modeling and simulation on dynamic recrystallization of 30Cr2Ni4MoV rotor steel using the cellular automaton method [J]. Model Simul Mater Sci Eng, 2009, 17(7): 1-19.
[14] HALLBERG H, WALLIN M, RISTINMAA M. Simulation of discontinuous dynamic recrystallization in pure Cu using a probabilistic cellular automaton [J]. Computational Materials Science, 2010, 49: 25-34.
[15] KOCKS U F, MECKING H. Physics and phenomenology of strain hardening: The FCC case [J]. Progress in Material Science, 2003, 48(3): 171-273.
[16] DING R, GUO Z X. Coupled quantitative simulation of microstructural evolution and plastic flow during dynamic recrystallization [J]. Acta Materialia, 2001, 49(16): 3163-3175.
[17] HUMPHREYS F J, HATHERLY M. Recrystallization and related annealing phenomena [M]. 2nd ed. Oxford: Elsevier, 2004.
[18] VARSHNI Y P. Temperature dependence of the elastic constants [J]. Physical Review B, 1970, 2(10): 3952-3958.
[19] CHEN F, CUI Z S, LIU J, CHEN W, CHEN S J. Mesoscale simulation of the high-temperature austenitizing and dynamic recrystallization by coupling a cellular automaton with a topology deformation technique [J]. Materials Science and Engineering A, 2010, 527(21-22): 5539-5549.
[20] LUO J, LI M Q, LI X L, SHI Y P. Constitutive model for high temperature deformation of titanium alloys using internal state variables [J]. Mechanics of Materials, 2010, 42(2): 157-165.
�����ѺϽ�TA15��b���������±��ι����в�������̬�ٽᾧ��ģ����ʵ���о�
�� ������ �ϣ����ΰ
������ҵ��ѧ ����ѧԺ�����̼��������ص�ʵ���ң����� 710072
ժ Ҫ��������Ԫ���Զ�����ģ���ѺϽ�Ti-6Al-2Zr-1Mo-1V (TA15)��b����������ѹ�������еIJ�������̬�ٽᾧ����ͨ��Ԫ���Զ���ģ�ͣ���̬��ģ�����ٽᾧ���κ˺ͺ��������ٽᾧ����������������ɾ��紦λ���ܶȵ��ݻ��ṩ��Ϊ����֤��CAģ�͵���ȷ�ԣ���ͨ��CAģ��Ԥ�����õ�Ӧ��-Ӧ��������ʵ��ֵ���жԱȡ��ԱȽ����������1020 ��C��Ӧ������1.0��0.1��0.01 s-1�������£�����ƽ��������ֱ�Ϊ10.2%��10.1% ��6%������1050 ��C��Ӧ������1.0��0.1��0.01 s-1�������£�����ƽ��������ֱ�Ϊ10.2%��11.35% ��7.5%����֤��ģ�͵Ŀɿ��ԡ����⣬���ڸ�CAģ��Ԥ���о����ٽᾧ�����ߴ硢�����ٶȺ��ٽᾧ����ѧ����������������ٽᾧ����������������Ӧ�����ʻ��¶ȵ����߶����ߣ��ٽᾧ�����ߴ�����Ӧ�����ʵĽ��Ͷ����ӣ��ٽᾧ�����������Ӧ�����ʵ����ӻ��¶ȵĽ��Ͷ����͡�
�ؼ��ʣ���������̬�ٽᾧ��Ԫ���Զ�����λ���ܶ��ݻ����ٽᾧ����ѧ��TA15�ѺϽ�
(Edited by Hua YANG)
Foundation item: Projects (50935007, 51175428) supported by the National Natural Science Foundation of China; Project (2010CB731701) supported by the National Basic Research Program of China; Project (NPU-FFR-JC20100229) supported by the Foundation for Fundamental Research of Northwestern Polytechnical University in China; Project (27-TZ-2010) supported by the Research Fund of the State Key Laboratory of Solidification Processing, China; Project (B08040) supported by the Program of Introducing Talents of Discipline to University, China
Corresponding author: He YANG; Tel: +86-13991817686; E-mail: yanghe@nwpu.edu.cn
DOI: 10.1016/S1003-6326(14)63259-3
Abstract: A cellular automaton (CA) modeling of discontinuous dynamic recrystallization (DDRX) of a near-�� Ti-6Al-2Zr-1Mo-1V (TA15) isothermally compressed in the b single phase field was presented. In the CA model, nucleation of the b-DDRX and the growth of recrystallized grains (re-grains) were considered and visibly simulated by the CA model. The driving force of re-grain growth was provided by dislocation density accumulating around the grain boundaries. To verify the CA model, the predicted flow stress by the CA model was compared with the experimental data. The comparison showed that the average relative errors were 10.2%, 10.1% and 6%, respectively, at 1.0, 0.1 and 0.01 s-1 of 1020 ��C, and were 10.2%, 11.35% and 7.5%, respectively, at 1.0, 0.1 and 0.01 s-1 of 1050 ��C. The CA model was further applied to predicting the average growth rate, average re-grain size and recrystallization kinetics. The simulated results showed that the average growth rate increases with the increasing strain rate or temperature, while the re-grain size increases with the decreasing strain rate; the volume fraction of recrystallization decreases with the increasing strain rate or decreasing temperature.
