
Trans. Nonferrous Met. Soc. China 29(2019) 2090-2098
Artificial intelligence model of complicated flow behaviors for Ti-13Nb-13Zr alloy and relevant applications
Ze-yan SHI1, 2, Guo-zheng QUAN2, Chao AN2, Hui-min QIU2, Wei-yong WANG3, Zhi-hua ZHANG2
1. CQU-UC Joint Co-op Institute, Chongqing University, Chongqing 400044, China;
2. State Key Laboratory of Mechanical Transmission, College of Material Science and Engineering, Chongqing University, Chongqing 400044, China;
3. School of Civil Engineering, Chongqing University, Chongqing 400045, China
Received 10 January 2018; accepted 2 September 2019
Abstract:
The comprehensive nonlinear flow behaviors of a ductile alloy play a significant role in the numerical analysis of its forming process. The accurate characterization of as-forged Ti-13Nb-13Zr alloy was conducted by an improved intelligent algorithm, GA-SVR, the combination of genetic algorithm (GA) and support vector regression (SVR). The GA-SVR model learns from a training dataset and then is verified by a test dataset. As for the generalization ability of the solved GA-SVR model, no matter in �� phase temperature range or (��+��) phase temperature range, the correlation coefficient R-values are always larger than 0.9999, and the AARE-values are always lower than 0.18%. The solved GA-SVR model accurately tracks the highly-nonlinear flow behaviors of Ti-13Nb-13Zr alloy. The stress-strain data expanded by this model are input into finite element solver, and the computation accuracy is improved.
Key words:
Ti-13Nb-13Zr alloy; flow stress; constitutive model; support vector regression; genetic algorithm;
1 Introduction
Ti-13Nb-13Zr titanium alloy is a widely applied biomedical alloy due to the advantages of low elastic modulus, high strength, excellent corrosion resistance, nontoxicity, etc [1]. In the manufacturing process of the components with this alloy, the isothermal constitutive flow behaviors at different strain rates, strains and temperatures provide the basic stress-strain data for the numerical computation of forming process. Consequently, it is a significant issue to track the experimental flow behaviors, and further expand the stress-strain data in a wider range of deformation conditions. In recent years, along with the great development of intelligent machine learning, the methods of artificial neural network (ANN), genetic algorithm (GA), support vector regression (SVR), etc. have been introduced into modeling the complex flow behaviors of alloys [1-3].
ANN method by simulating biological neural systems has been successfully applied to characterizing the flow behaviors of many alloys, such as nickel base alloy [2], austenitic stainless steel [4], and Al-Mg alloy [5]. As for the process of determining proper network topologies and training parameters of an ANN model, it is a manual trial-and-error and time-consuming process, and the optimal scheme cannot be found at all. In addition, it should be noted that ANN model cannot avoid falling into local extremum, which results in the inability to obtain a global optimal solution.
Support vector regression (SVR), as an intelligent machine learning method, is widely adopted to characterize the nonlinear flow behaviors of alloys due to its excellent regression analysis ability and robustness [6-8]. Compared with ANN, SVR is more robust, as it avoids falling into local extremum, and then gets a global optimal solution. In SVR method, the learning ability and generalization ability can be dramatically enhanced by adjusting parameters including penalty factor C, kernel parameter �� and insensitive loss function �� appropriately. The SVR model with suitable C, �� and �� will precisely learn the highly-nonlinear flow behaviors of Ti-13Nb-13Zr alloy, and properly ignore some singular points on stress-strain curves. It is time-consuming to establish an accurate SVR model by optimizing each parameter individually. Consequently, it is significant to efficiently determine the optimal parameter combination of the three parameters (C, �� and ��) in SVR to build an accurate model. LOU et al [7] accurately predicted the hot flow behaviors of AZ80 magnesium alloy based on particle swarm optimization combined with SVR. In their work, particle swarm optimization was applied to determining the optimal solution of parameter C, �� and ��, and the higher prediction precision than ANN was achieved. DESU et al [8] solved a SVR model to characterize the flow behaviors of austenitic stainless steel 304. In their work, the best correlation coefficient (R) was 0.9989. Moreover, the accuracy still could be improved since only few combinations of the three parameters (C, �� and ��) were tried.
In order to achieve a higher accuracy, genetic algorithm (GA), known as a bionic algorithm with a lot of merits, such as strong robustness, high efficiency and excellent parallel process, was introduced to efficiently solve the optimal combination of parameters (C, �� and ��) in a SVR model by simulating the natural genetic mechanism [3,9]. The combined GA-SVR method only requires representative training samples from a work, and then it can self-adaptively seek the optimal combination of these three parameters to obtain the most accurate model. Compared with the work of DESU et al [8], the combined GA-SVR method achieved higher accuracy. The significant merit of GA-SVR is that when training parameters keep constant, training precision and prediction precision in different attempts for a determinate dataset keep stable. In this opinion, the robustness and generalization ability of GA-SVR are stronger than those of ANN. This work focuses on the application of GA-SVR method in the flow behavior characterization of Ti-13Nb-13Zr alloy.
2 Experimental
2.1 Materials
The chemical compositions (wt.%) of the adopted Ti-13Nb-13Zr alloy are as follows: Nb 14.6, Zr 13.3, C 0.03, Fe 0.02, N 0.015 and Ti balanced [1]. Figure 1 shows the optical metallograph of the as-received Ti-13Nb-13Zr alloy. From a forged Ti-13Nb-13Zr alloy billet with 20 mm in height and 70 mm in diameter, 24 cylindrical specimens with 12 mm in height and 10 mm in diameter were machined by wire-electrode cutting.

Fig. 1 Optical metallograph of as-received Ti-13Nb-13Zr alloy
2.2 Experimental procedures
In order to measure the true stress-strain data of as-forged Ti-13Nb-13Zr alloy, a series of isothermal compression tests were conducted. A Gleeble 3500 thermo-mechanical simulator, with a high-speed heating system, a servo hydraulic system, a digital control system and a data acquisition system, was used. In order to reduce friction and prevent adhesion between the specimen ends and anvils, two graphite lubricants were used on their contact surfaces. Twenty-four test samples were heated to the specified deformation temperature with a constant heating rate of 30 K/s and held at that temperature for 3 min by thermo-coupled-feedback- controlled AC current. The heated cylindrical specimens were compressed to a true strain of 0.916 (a fixed height reduction of 60%) at the strain rates of 0.01, 0.1, 1 and 10 s-1, and the temperatures of 923, 973, 1023, 1073, 1123 and 1173 K. Subsequently, these compressed samples were immediately quenched into water to reserve the high-temperature microstructures. In the testing processes, the true stress-strain data of Ti-13Nb-13Zr alloy were monitored in Fig. 2. It is summarized that flow stress gradually decreases with strain rate decreasing at a certain temperature and a certain strain, while it increases with temperature decreasing at a certain strain rate and a certain strain.
3 Construction of SVR for flow behaviors of Ti-13Nb-13Zr alloy
3.1 Basic principles of SVR
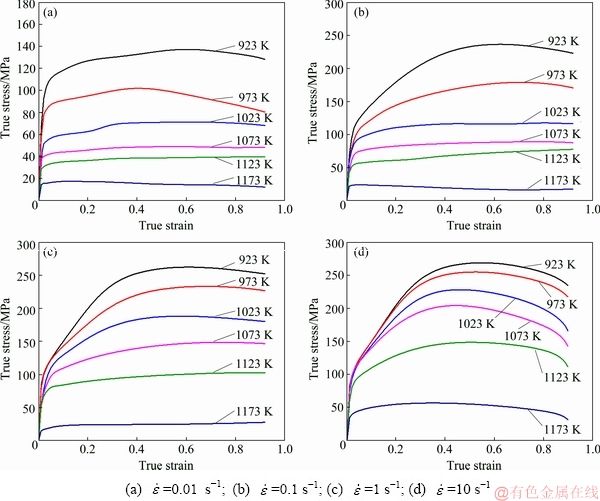
Fig. 2 True stress-strain curves of as-forged Ti-13Nb-13Zr alloy at different strain rates and temperatures
In SVR solving process, highly nonlinear low-dimensional data are mapped to linearly separable multidimensional data by kernel function k(xi, xj)=��(xi)����(xj), where k(xi, xj) is input variable, and ��(x) is mapping function. Meanwhile, the radial basis function (RBF) of kernel function expressed as Eq. (1) can effectively improve the regression precision of SVR [1,8]:
k(xi,x)=exp(-��||xi-x||2) (1)
wher �� is variable parameter of the RBF.
y=f(x) can be expressed by Eq. (2) in SVR:
f(x)=�ء�x+e (2)
where �� is the multidimensional column vector; e is the bias term.
Assuming that original data are (x1,y1), (x2,y2), (x3,y3), ��, (xi,yi), ��, (xk,yk), xi, yi��R, and the function f(x) is able to estimate all data, the optimal function is proposed and expressed as
 (3)
(3)
 (4)
(4)
where ��i and  are slack variables which influence regression precision; C is the penalty factor; �� is the insensitive loss parameter with a large impact on regression precision; l is the number of samples. In this work, temperature (T), strain (��) and strain rate (
 ) are considered as the input variables x of SVR, and flow stress (��) is used as the output variable f(x).
The regression function of optimal separating hyperplane in SVR is expressed as
 (5)
(5)
where ��i is the Lagrange multiplier.
As for SVR method, appropriate parameter settings are helpful to enhance the learning ability and generalization ability, and these parameters include penalty factor C in Eq. (3), kernel parameter �� in Eq. (1) and insensitive loss function �� in Eq. (4). Here, the C-value and ��-value influence the robustness and generalization ability of SVR, respectively. The ��-value influences the number of support vector and further impacts the regression precision of SVR.
3.2 Stress prediction model based on GA and SVR
3.2.1 Basic principles of GA
In GA solving process, a population is composed of several individuals encoded by genes. Here, the individual with a larger fitness value is selected and inherited to next generation by a fitness function. Subsequently, new individuals will be generated through the crossover and mutation of excellent individuals. The newly-generated populations are more adaptable to the environment than the antecedent populations. In the last generation, the individual with the best fitness value is output as an optimal solution [3,9].
3.2.2 Establishment of stress prediction model on GA-SVR
In the solving process for the optimal combination of the three parameters (C, �� and ��) in a SVR model by GA method, a total of 1224 input-output pairs were selected from the measured stress-strain data of Ti-13Nb-13Zr alloy. Among the total pairs, 408 input-output pairs in the true strain range of 0.1-0.9 with a gradient of 0.05 were used for testing the generalization ability of GA-SVR, and the remained 816 input-output pairs were used to train GA-SVR.
Here, the cross validation method, as an effective method for assessing the precision of data mining and machine learning, was adopted to evaluate the performance of the solved GA-SVR model. In the cross validation method, N groups are divided from the raw data, and one separate group is used as a validation dataset. The remaining (N-1) groups are utilized for training GA-SVR model. Each group of N groups is alternately set as validation dataset until the end of a round. The performance of GA-SVR model is related to the average number of evaluation index in N validation process.
Here, two classical evaluation methods including mean square error (MSE, M) expressed as Eq. (6) and correlation coefficient (R) expressed as Eq. (7), were applied to measuring the fitness value and assess the degree of correlation between the experimental values and predicted values [10,11], respectively. In common, a larger R-value indicates that the solved GA-SVR model has a higher accuracy level.
 (6)
(6)
where f(xi) are the predicted stresses; yi are the experimental stresses; N is the number of stress-strain samples.
 (7)
(7)
where E is the sample of experimental stress-strain data; P is the sample of predicted stress-strain data;  and
and  are the average values of experimental data and predicted data, respectively.
Figure 3 shows the detailed flowchart to solve a GA-SVR model. Firstly, the population of GA-SVR model is initialized, and the three parameters (C, �� and ��) are coded to the chromosomes of individuals. Here, the population number was set as 25, and was updated by the selection, crossover and mutation operators in solving process. Secondly, the indicator of MSE as Eq. (6) is used to calculate the fitness values of the individuals.
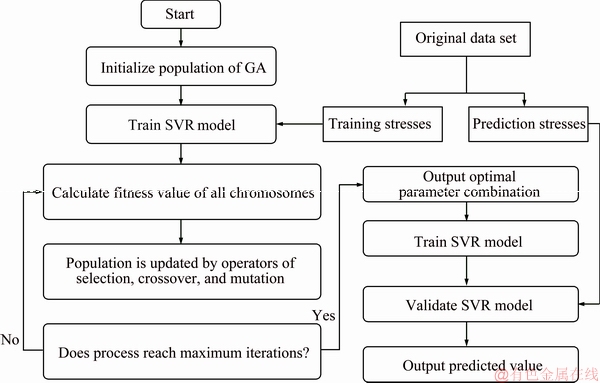
Fig. 3 Flowchart to solve GA-SVR model
The individual with a larger fitness value is selected and inherited to the next generation with a larger probability. This repeated assessing process is called cross validation method. Finally, if the iteration number attains the predetermined value, the solving process ceases, and meanwhile the optimal parameter combination of the three parameters is obtained. Here, the predetermined iteration number was 50.
The average fitness value and the best fitness value corresponding to the iteration number of the well-trained GA-SVR model for Ti-13Nb-13Zr alloy are shown in Fig. 4. It can be seen that the average fitness values are extremely close to the best fitness values. The three parameters (C, �� and ��) with the best combination (R=0.999992) are 99.8697, 24.2188 and 0.0044, respectively.
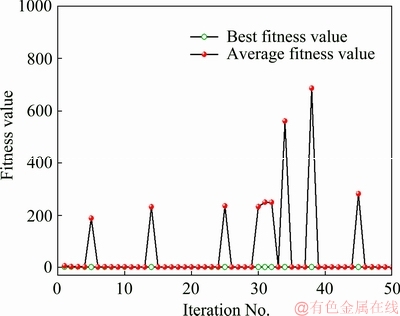
Fig. 4 Relationships between fitness values and iteration number of GA-SVR model for Ti-13Nb-13Zr alloy
4 Evaluation of performance of solved GA- SVR model
The evaluation of the learning ability and generalization ability of the solved model was performed by three indicators including correlation coefficient (R) as Eq. (7), relative error (d) as Eq. (8), average absolute relative error (AARE, A) expressed by Eq. (9) [1-3]:
 (8)
(8)
 (9)
(9)
In Ref. [1], QUAN et al solved the ANN model for Ti-13Nb-13Zr alloy. Here, the GA-SVR model for this ally was solved, and the performances of this model were compared with the previous ANN model in details by three indicators including R, d and AARE.
Here, the stress-strain data of Ti-13Nb-13Zr alloy were clarified into (��+��) phase data and �� phase data according to the phase transus temperature (1073 K), and the relative evaluation was conducted. As for the learning ability evaluation of the trained GA-SVR model of Ti-13Nb-13Zr alloy, the correlations between the trained stresses and the training predictions were fitted as Fig. 5(a) in (��+��) phase and Fig. 5(b) in �� phase. Figure 5 shows that no matter the microstructures of �� phase or (��+��) phase, the R-values are always larger than 0.99998, and the AARE-values are in the range of 0-0.16%. As for the learning ability evaluation of the trained ANN model of Ti-13Nb-13Zr alloy in Ref. [1], the correlations between the trained stresses and training predictions is 0.99991, and the AARE-values are in the range of 0-3.2%. Consequently, it can be concluded that the trained GA-SVR model sufficiently learns the training samples, and the learning ability of GA-SVR model is stronger than that of ANN model.
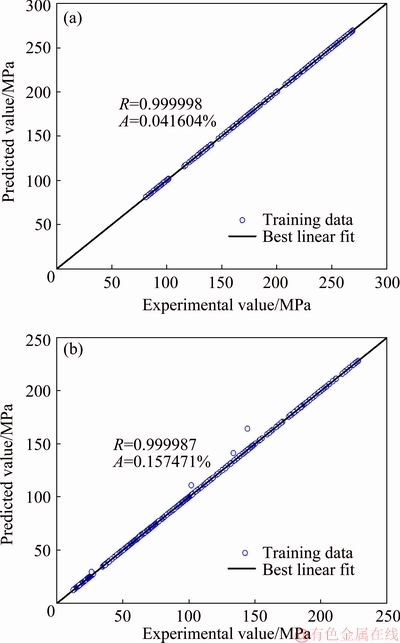
Fig. 5 Correlations between trained stresses and training predictions of GA-SVR model in (��+��) (a) and �� (b) phase of Ti-13Nb-13Zr alloy
As for the generalization ability evaluation of the solved GA-SVR model of Ti-13Nb-13Zr alloy, the scattered stress-strain data were predicted on the experimental stress-strain curves. Figure 6 shows that the predicted stresses are extremely close to the experimental stress-strain curves. Furthermore, the correlations between the experimental stresses and the testing data of predictions by GA-SVR model were fitted as Fig. 7(a) in (��+��) phase and Fig. 7(b) in �� phase. Figure 7 shows that no matter the microstructures of �� phase or (��+��) phase, the R-values are always larger than 0.9999, and the AARE-values are in the range of 0-0.18%.
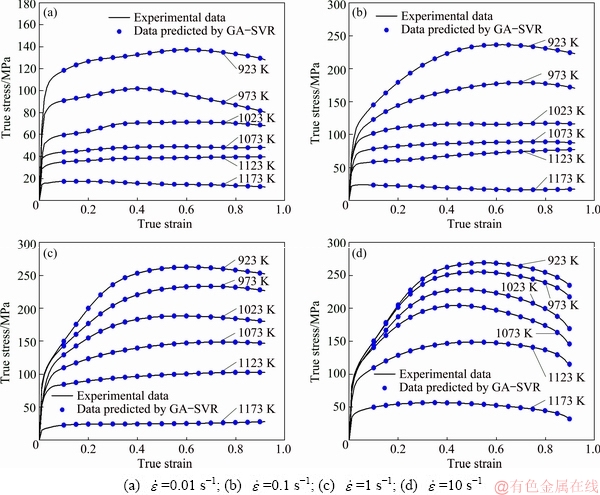
Fig. 6 Comparisons between experimental flow stresses and testing data predicted by GA-SVR model of Ti-13Nb-13Zr alloy
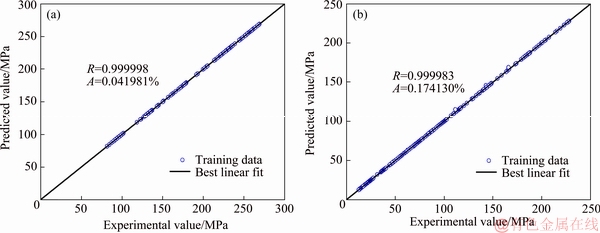
Fig. 7 Correlations between experimental stresses and testing data predicted by GA-SVR model in (��+��) (a) and �� (b) phase of Ti-13Nb-13Zr alloy
In order to deeply understand the generalization ability of the solved GA-SVR model, the analysis of frequency distribution of sample relative errors (d) by Gaussian distribution method was carried out. By the analysis, the average value (��) of all the d-values expressed by Eq. (10) and the standard deviation (w) expressed by Eq. (11) [3] were achieved:
 (10)
(10)
 (11)
(11)
Figure 8 shows the histogram distribution of sample relative errors between experimental stresses and predicted stresses of the solved GA-SVR model of Ti-13Nb-13Zr alloy. From Fig. 8, it can be seen that most of d-values (95.588%) are distributed in the range from -0.5% to 0.5%, and the m-value and w-value are -0.00162 and 0.26511, respectively. It can be deduced that the predicted stresses are close to the experimental stresses, and the distribution of sample relative errors has no jumping. It can be summarized that the solved GA-SVR model accurately tracks the highly nonlinear flow behaviors of Ti-13Nb-13Zr alloy.
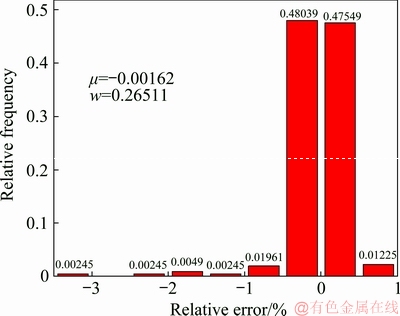
Fig. 8 Distribution of sample relative errors between experimental stresses and predicted stresses
5 Applications of GA-SVR model in forming simulation
In this section, the influence of input stress-strain data on simulated results of an isothermal compression process was studied by finite element (FE) software DEFORM. The parameters corresponding to the physical compression experiments were set in the finite element model. To improve the computational efficiency, one half of the test sample was adopted on account of its geometrical symmetry. In the computation process of material flow behaviors by finite element (FE) software, the limited input stress-strain data were derived by mathematical interpolation method. This means that the amount of input stress-strain data determines the computation accuracy. Therefore, the input stress-strain data need expanding. Here, the solved GA-SVR model was applied to enriching the stress-strain data of Ti-13Nb-13Zr alloy.
A compression experiment at the temperature of 1123 K, compressive strain of 0.9 and strain rate of 1 s-1 was simulated with different input stress-strain data as Scheme-A and Scheme-B. The Scheme-A has the input stress-strain data expanded by the solved GA-SVR model. As shown in Fig. 9, the flow stress data at the strain rate of 1 s-1 and the temperatures of 948, 998, 1048, 1098 and 1148 K were predicted. These data together with the experimental data as Scheme-A were input into finite element solver. The Scheme-B has the input stress-strain data acquired from the compression experiments at the strain rate of 1 s-1 and the temperatures of 923, 973, 1023, 1073, 1123 and 1173 K.
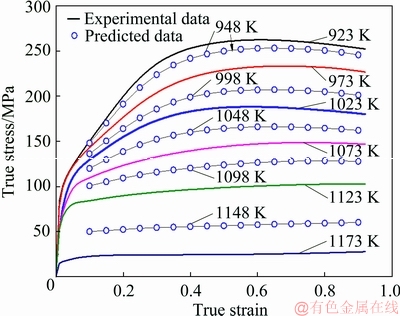
Fig. 9 True stress-strain data of Ti-13Nb-13Zr alloy at strain rate of 1 s-1
From the simulations of the compression experiments with input stress-strain data, the distributions of effective stress for Scheme-A and Scheme-B are achieved and shown in Fig. 10(a) and (b), respectively. It can be seen that the distributions of effective stress in Scheme-A and Scheme-B are similar, but the effective stress and the average effective stress are largely different.
From the simulations, the relationships between stroke and load corresponding with Scheme-A and Scheme-B are achieved in Fig. 11. The load curve of Scheme-A is closer to the experimental curve than Scheme-B. The relative errors of the former are in the range from -6.683196% to 0.377291%, whereas those of the later are in the range from 8.561982% to 27.35808616%. It can be summarized that insufficient input stress-strain data result in large simulation tolerance, while the expanded input stress-strain data from the well-trained GA-SVR model enhance the simulation accuracy.
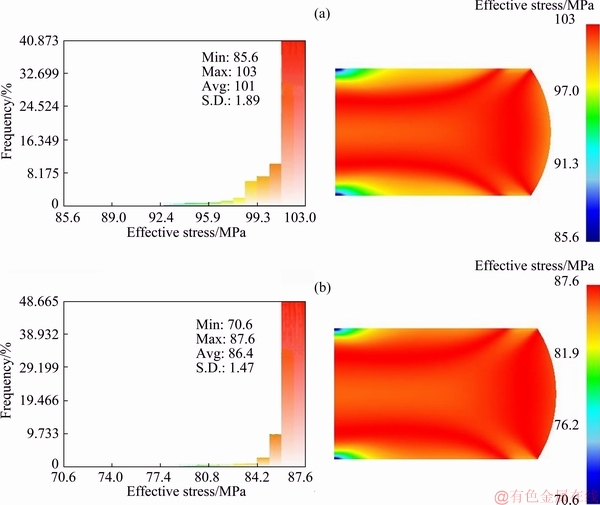
Fig. 10 Distributions of effective stress for Scheme-A (a) and Scheme-B (b) at strain rate of 1 s-1, temperature of 1123 K, and compressive strain of 0.9
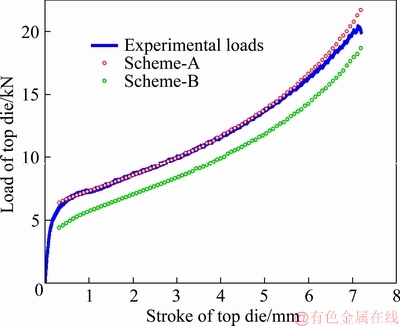
Fig. 11 Relationships between stroke and load of top die of experimental data
6 Conclusions
(1) As for the learning ability evaluation of the trained GA-SVR model of Ti-13Nb-13Zr alloy, no matter �� phase or (��+��) phase, the R-values are always larger than 0.99998, and the AARE-values are always lower than 0.16%. Its learning ability is stronger than the trained ANN model.
(2) As for the generalization ability evaluation of the solved GA-SVR model of Ti-13Nb-13Zr alloy, no matter �� phase or (��+��) phase, the R-values are always larger than 0.9999, and the AARE-values are in the range of 0-0.18%. The distribution of relative errors has no jumping. The solved GA-SVR model accurately tracks the highly-nonlinear flow behaviors.
(3) The solved GA-SVR model is applied to enriching the stress-strain data of Ti-13Nb-13Zr alloy, and the expanded stress-strain data are input into finite element solver to enhance the simulation accuracy.
References
[1] QUAN Guo-zheng, PU Shi-ao, ZHAN Zong-yang, ZOU Zhen-yu, LIU Ying-ying, XIA Yu-feng. Modelling of the hot flow behaviors for Ti-13Nb-13Zr alloy by BP-ANN model and its application [J]. International Journal of Precision Engineering & Manufacturing, 2015, 16(10): 2129-2137.
[2] QUAN Guo-zheng, PAN Jia, WANG Xuan. Prediction of the hot compressive deformation behavior for superalloy nimonic 80A by BP-ANN model [J]. Applied Sciences, 2016, 6(3): 66-82.
[3] QUAN Guo-zheng, ZHANG Zhi-hua, ZHANG Le, LIU Qing. Numerical descriptions of hot flow behaviors across �� transus for as-forged Ti-10V-2Fe-3Al alloy by LHS-SVR and GA-SVR and improvement in forming simulation accuracy [J]. Applied Sciences, 2016, 6(8): 210-233.
[4] MANDAL S, SIVAPRASAD P V, VENUGOPAL S, MURTHY K P N. Constitutive flow behaviour of austenitic stainless steels under hot deformation: Artificial neural network modelling to understand, evaluate and predict [J]. Modelling & Simulation in Materials Science & Engineering, 2006, 14(6): 1053-1070.
[5] GHOLAMZADEH A, KARIMI T A. The prediction of hot flow behavior of Al-6%Mg alloy [J]. Mechanics Research Communications, 2009, 36(2): 252-259.
[6] WANG Hu, LI En-ying, LI Guang-Yao. The least square support vector regression coupled with parallel sampling scheme metamodeling technique and application in sheet forming optimization [J]. Materials & Design, 2009, 30(5): 1468-1479.
[7] LOU Yan, KE Chang-xing, LI Luo-xing. Accurately predicting high temperature flow stress of AZ80 magnesium alloy with particle swarm optimization-based support vector regression [J]. Applied Mathematics & Information Sciences, 2013, 7(3): 1093-1102.
[8] DESU R K, GUNTUKU S C, B ADITYA, GUPTA A K. Support vector regression based flow stress prediction in austenitic stainless steel 304 [J]. Procedia Materials Science, 2014, 6: 368-375.
[9] SIVARAJ R, RAVICHANDRAN T. An improved clustering based genetic algorithm for solving complex NP problems [J]. Journal of Computer Science, 2011, 7(7): 1033-1037.
[10] YAN Jie, PAN Qing-lin, LI An-de, SONG Wen-bo. Flow behavior of Al-6.2Zn-0.70Mg-0.30Mn-0.17Zr alloy during hot compressive deformation based on Arrhenius and ANN models [J]. Transactions of Nonferrous Metals Society of China, 2017, 27(3): 638-647.
[11] CHAI Rong-xia, GUO Cheng, YU Li. Two flowing stress models for hot deformation of XC45 steel at high temperature [J]. Materials Science and Engineering A, 2012, 534: 101-110.
Ti-13Nb-13Zr�Ͻ���������Ϊ���˹�����ģ�ͼ������Ӧ��
ʯ����1,2��Ȩ����2���� ��2�������2��������3�����ǻ�2
1. �����ѧ CQU-UC����ѧԺ������ 400044��
2�������ѧ ���Ͽ�ѧ�빤��ѧԺ ��е���������ص�ʵ���ң����� 400044��
3�������ѧ ��ľ����ѧԺ������ 400045
ժ Ҫ�������ԺϽ�ĸ��ӷ�����������Ϊ�dz�����ֵģ��Ĺؼ����ء�����Ŵ��㷨(GA)��֧�������ع�(SVR)����GA-SVR��ȷ����Ti-13Nb-13Zr��̬�Ͻ�ĸ߶ȷ�����������Ϊ��GA-SVRģ�Ͷ�ѵ�����������ѧϰ�����ɼ��������������֤����GA-SVRģ�͵ķ��������������ۣ����ۺϽ��ڦ����(��+��) �࣬���ϵ��Rֵ��>0.9999��ƽ������������(AARE)��ʼ��<0.18%������GA-SVRģ�Ϳ��Ծ�ȷ�����úϽ�ĸ߶ȷ�������Ϊ����ģ�ͽ���������չ�Ͻ��Ӧ��-Ӧ�����ݣ���Щ��չ������ݱ����뵽����Ԫģ������������ֵģ��ľ��ȡ�
�ؼ��ʣ�Ti-13Nb-13Zr�Ͻ�����Ӧ��������ģ�ͣ�֧�������ع飻�Ŵ��㷨
(Edited by Bing YANG)
Foundation item: Project (cstc2018jcyjAX0459) supported by Chongqing Basic Research and Frontier Exploration Program, China; Projects (2019CDQYTM027, 2019CDJGFCL003, 2018CDPTCG0001-6, 2019CDXYCL0031) supported by the Fundamental Research Funds for the Central Universities, China
Corresponding author: Guo-zheng QUAN; Tel: +86-15922900904; Fax: +86-23-65111493; E-mail: quangz3000@sina.com
DOI: 10.1016/S1003-6326(19)65115-0
Abstract: The comprehensive nonlinear flow behaviors of a ductile alloy play a significant role in the numerical analysis of its forming process. The accurate characterization of as-forged Ti-13Nb-13Zr alloy was conducted by an improved intelligent algorithm, GA-SVR, the combination of genetic algorithm (GA) and support vector regression (SVR). The GA-SVR model learns from a training dataset and then is verified by a test dataset. As for the generalization ability of the solved GA-SVR model, no matter in �� phase temperature range or (��+��) phase temperature range, the correlation coefficient R-values are always larger than 0.9999, and the AARE-values are always lower than 0.18%. The solved GA-SVR model accurately tracks the highly-nonlinear flow behaviors of Ti-13Nb-13Zr alloy. The stress-strain data expanded by this model are input into finite element solver, and the computation accuracy is improved.
