

Synthesis and characteristics of large-scale ZnO rods by wet chemical method
WEI Su-feng(κ�ط�), JIANG Qing(�� ��), LIAN Jian-she(������)
Key Laboratory of Automobile Materials, Ministry of Education, College of Materials Science and Engineering,
Jilin University, Changchun 130025, China
Received 31 October 2007; accepted 18 March 2008
Abstract:
The large-scale ZnO rods of submicrometer were prepared on the bare glass using a wet chemical method under different experimental parameters, such as the reactant concentration and the growth time. The microstructure of the ZnO rods was characterized by X-ray diffractometry(XRD) and field emission scanning electron microscopy (FESEM) with the energy dispersive X-ray spectroscopy(EDX), and the optical property was investigated by the room-temperature photoluminescence (PL) spectra. XRD and FESEM results show that the wurtzite structure and rod-like ZnO is obtained. The length (3-8 mm) and the diameter (400 nm- 3 mm) vary with the experimental parameters. A strong UV emission at 384 nm and a weak visible yellow-green emission around 570 nm are observed in the PL spectrum. After annealing at 600 �� in air, the UV peak intensity increases obviously and the yellow-green peak intensity decreases greatly. The near-band-edge UV emission is attributed to the exciton recombination; the yellow-green emission can be associated with the defect recombination; and some defect complexes may be responsible for the latter emission.
Key words:
ZnO; wet chemical method; photoluminescence; annealing;
1 Introduction
ZnO is a well-known semiconductor with a direct wide-band gap energy (3.37 eV) and a large exciton binding energy (60 meV) at room temperature, which makes it a significant material of catalytic, electronic, optoelectronic and piezoelectric properties. Recently, one-dimensional(1D) semiconductor nanostructures have attracted considerable attention, especially for 1D ZnO nanostructure due to its unique and novel application to nanodevices such as ultraviolet light-emitting devices[1], field-effect transistor[2], solar cells[3], and chemical sensors[4]. Such kind of 1D ZnO nanostructures has been realized as nanorods, nanowires, nanobelts, nanotubes, nanorings, nanobridges, nanonails and so on [5]. Among these 1D nanostructures, ZnO nanorods have been widely studied for their easy synthesis and application in nanoscale devices.
At present, 1D ZnO nanorods have been obtained mainly by vapor-liquid-solid(VLS) process, metal organic chemical vapor deposition(MOCVD) and wet chemical route. The VLS process requires higher growth temperature than 500-550 ��, expensive substrates and the metal catalyst assistant[6]. The catalyst-free MOCVD enables to grow ZnO nanorods at 400-500 �� that is still relatively high[7]. The wet chemical route exhibits several advantages like low cost, large-scale production, low-temperature process and no catalyst assistant. It can be performed on various substrates, which promotes its applications in versatile fields. Therefore, it will be the most promising method to synthesize ZnO nanorods. VAYSSIERES[8] proposed the preparation of ZnO nanorods by a wet chemical method. However, there is a little report on the optical properties of ZnO rods that are developed directly on the bare glass. In this work, large-scale ZnO rods were prepared directly on bare glass by wet chemical method under different experimental parameters. The influences of the experimental parameters on the microstructures, morphologies and the optical properties of ZnO rods are investigated in details.
2 Experimental
All the chemicals in experiments were in analytical grade without any purification. The bare glass was used as substrate. The substrate was cleaned with scour and rinsed thoroughly with deionized (DI) water, then stirred for 30 min in ethanol with ultrasonic vibration and again rinsed with DI water thoroughly. The reactant solution was prepared by equi-amount zinc nitrate hexahydrate (Zn(NO3)2��6H2O) and methenamine (C6H12N4) aqueous solution mixed in a sealed glass vessel. The glass substrate was immersed into the reactant solution. The reaction temperature was kept at 95 ��. The concentration of the reactant solution changed from 0.001 to 0.1 mol/L. The reaction time changed from 0.5 to 4 h. Subsequently, the substrate covered with a white layer was washed carefully with DI water and then dried at the same temperature.
The morphologies and the crystalline structures of the as-grown products were characterized by field emission scanning electron microscope (FESEM, JEOL JSM-6700F, Japan) and X-ray diffractometer (XRD, Rigaku D/max, Japan) with the Cu K�� radiation of 1.541 7 ? and a monochrometer at 50 kV and 300 mA with the scanning rate and step being 4 (?)/min and 0.02?, respectively. The infrared (IR) spectrum of the ZnO rods was measured by a Nexus670 Fourier transform spectrometer (FT-IR, Thermo Nicolet, USA). The room-temperature PL spectrum was measured with a fluorescence spectrophotometer using a He-Cd laser with a wavelength of 325 nm as the excitation light source.
3 Results and discussion
3.1 Basic chemistry
In the experiment, the reaction system was maintained in the weak acid condition. The reaction processes in the system can be expressed by the following equations:
C6H12N4+10H2O��6HCHO+4NH3?H2O (1)
Zn2++4NH3?H2O��[Zn(NH3)4]2++4H2O��
Zn(OH)2+4NH4++2OH- (2)
Zn(OH)2��ZnO+H2O (3)
In the aqueous solution of zinc nitrate, the methenamine decomposes to aldehyde and ammonia (Eqn.(1)) in the weak acid condition. Then ammonia combines with Zn2+ to produce a large number of Zn2+ amino complexes in the solution. The Zn2+ amino complexes will be directly hydrolyzed (Eqn.(2)), and ZnO can be formed on the glass substrate and vessel inter-surface through the decomposition reaction shown in Eqn.(3).
3.2 Structure and morphology
Fig.1 shows the XRD patterns of the as-grown ZnO rods on the bare glass developed for 1 h. All diffraction peaks can be indexed to hexagonal wurtzite ZnO, and no diffraction peaks of any other impurities are detected. The dominated orientation of the ZnO rods varies with the concentration of the reactant solution. At lower concentrations of 0.001-0.005 mol/L, the (100) preferred orientation is observed, which means that most of the ZnO rods along c-axis growth lay parallelly on the substrate. Then the (100) preferred orientation becomes weaker as the concentration of the reactant increases and the (002) orientation growth is eventually observed as the concentration of the reactant increases to 0.08-0.1 mol/L, which implies that most of the ZnO rods grow with c-axis vertical to the glass substrate.
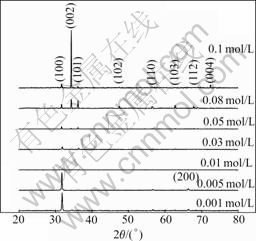
Fig.1 XRD patterns of as-grown ZnO rods with different concentration reactant for 1 h
Figs.2(a) and (b) show the XRD patterns of the ZnO rods grown in the solution of 0.1 mol/L of the reactant for 1 h and 4 h, respectively. The intensity of (002) peak increases with the growth time increasing, while the random orientations emerge simultaneously. It is obvious that the crystallinity of the samples increases and the ZnO rods exhibit some random growth, but the rods with c axis being vertical to the substrates are still dominated.
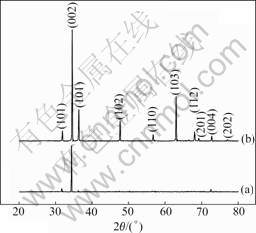
Fig.2 XRD patterns of ZnO rods grown in 0.1 mol/L reactant for 1 h (a) and 4 h (b)
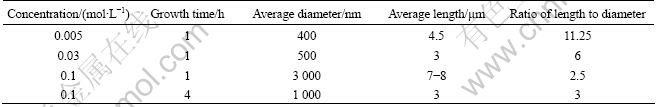
The morphologies and microstructures of the as-grown samples were characterized by FESEM. The morphologies of the samples grown in the solutions with different concentrations and for different time are shown in Fig.3. The inserts of Figs.3(c) and (d) are their section images. It is clearly seen that hexagonal ZnO rods are obtained. They always grow along the c axis that is of lowest energy in hexagonal structure. As seen in Figs.3(a)-(c), at lower concentration, the ZnO rods are parallel to the substrate. Several rods perpendicular to the substrate appear gradually with increasing the concentration. When the concentration reaches 0.1 mol/L, most of the rods get perpendicular to the substrate. With growth time increasing to 4 h, the vertical rods become a compact array ensemble, as shown in Fig.3(d). The direct observations on the evolution of morphologies and microstructures are in agreement with the above analyses based on the XRD patterns. It can be also observed that these ZnO rods are 3-8 mm long with diameters in the range of 400 nm-3 mm. The average diameters of samples increase with the reactant concentration, while the average lengths do not follow this rule. This is not exactly similar with the results reported by JANOTTI et al[9]. However, the ratio of the length to diameter decreases with the reaction concentration increasing, which is almost conformed by the results of JANOTTI et al[9]. The average diameter decreases with the growth time increasing, so does the average length. However, the ratio of the length to diameter increases weakly. The energy dispersive X-ray spectroscopy(EDX) analysis results show that the molar ratio of oxygen to zinc is 1.24?1, which indicates that there is excessive oxygen in the as-grown ZnO rods. Table 1 summarizes the geometrical parameters of the as-grown ZnO rods under different experimental conditions.
In most cases, homogenous nucleation of solid phases from solution requires a higher activation energy barrier than heterogeneous nucleation and therefore, heterogeneous nucleation is energetically more favorable if there are some substances served as nuclei[10]. In our experiments, there is almost no nucleus on the bare glass, so the homogenous nucleation is dominated. Nuclei grow up and then are adsorbed onto the substrates. The concentration of the homogeneous nucleation is low at the lower reactant concentration and becomes higher with the reactant concentration and growth time increasing rapidly, which can be distinctly seen from Fig.3 and Table 1. Too many nuclei interact each other, which restrains the growth of every single rod in spite of the diameter and the length.
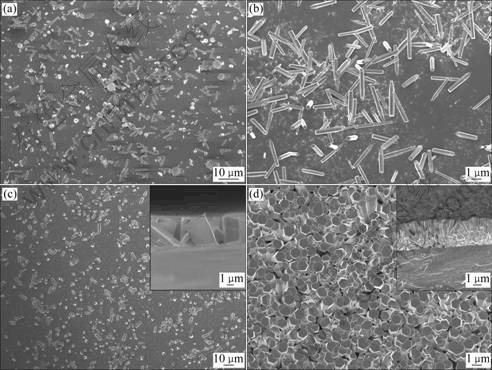
Fig.3 FESEM images of samples (Inserts of (c) and (d) are their section images): (a) 0.05 mol/L, 1 h; (b) 0.03 mol/L, 4 h; (c) 0.1 mol/L, 1h; (d) 0.1 mol/L, 4 h
Table 1 Geometrical parameters of as-grown ZnO rods at different experimental parameters
3.3 Luminescent properties
Fig.4 shows the PL spectra of as-grown ZnO rods at room temperature. Two emitting bands, including a strong UV emission centered at about 384 nm and a visible yellow-green emission centered at about 570 nm, are observed. The PL intensity increases with the reactant concentration because of the increase of ZnO rods with increasing the reactant concentration. The strong UV emission must be contributed to excitonic recombination corresponding to the near band edge emission of the wide band-gap ZnO. In addition to UV excitonic emission peak, ZnO also exhibits visible luminescence at different emission wavelengths owing to intrinsic or extrinsic defects. The deep level yellow-green emissions observed in Fig.4 of the ZnO rods should be related to these defects. A number of different hypotheses have been proposed for green emission, such as singly ionized oxygen vacancy[11], doubly charged oxygen vacancy [12], oxygen antisite[13] and surface defects[14]. Green emission is commonly attributed to the singly ionized oxygen vacancy and is easily affected by surface modifications. The yellow emission, which is usually observed in ZnO synthesized by a wet chemical method, is commonly attributed to interstitial oxygen[15], and is not affected by surface modification[16]. The green and yellow emissions in ZnO are also attributed to the presence of Zn(OH)2 on the surface[17]. However, there are different origins related to mutative PL centers. Since excessive oxygen has been confirmed by the EDX, and there is no hydroxyl ��OH presented in the as-grown ZnO rods by the FT-IR spectroscopy, interstitial oxygen perhaps is one of the origins of the visible emission in the experiment. The PL spectra are measured with ensemble of ZnO rods, and therefore, the visible emission is an ensemble of different effect emission. There may be still other defects that should be responsible for yellow-green emission. The ZnO rods exhibit steady PL properties, which can be recurred by the repeated experiments.
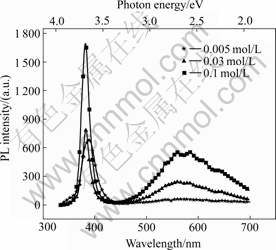
Fig.4 PL spectra of samples with different solution concentration
Fig.5 shows the PL spectra of ZnO rods before and after being annealed at 600 �� for 1 h. It is seen that the intensity of UV emission increases and that of yellow-green emission decreases after annealing. The peak intensity ratio of the UV to visible emission increases obviously from 1.7 for the ZnO rods before annealing to 11.6 after annealing. The latter ratio is comparable to that of ZnO films deposited by pulse laser deposition[18]. So, the optical quality of ZnO rods is enhanced after annealing. But the visible yellow-green emission does not completely fade away, whose energy level is about 2.18 eV. The calculated energy levels from different studies were summarized by TAM et al[19] and the results are shown in Fig.6. It should be mentioned that the majority of calculations only predicts energies of single point defect. However, the energy of the neutral oxygen vacancy-zinc interstitial complex defect is calculated to be 2.16 eV below the conduction band minimum. The single point defect, such as neutrally charged zinc vacancy[20] and neutral zinc interstitial[9], have been confirmed to be mobile at relatively low temperatures below 600 ��. However, the yellow-green emission persists after annealing at as high as 600 �� in singly charged, and doubly charged zinc vacancy, respectively; I0(Zn) and I(Zn) indicate neutral zinc interstitial while I+(Zn) denotes singly charged zinc interstitial; V(O0) and V(O) denote neutral oxygen vacancy while V(O+) denotes singly charged oxygen vacancy; I(O) and I(H) represent oxygen and hydrogen interstitial, respectively; V(O)I(Zn) denotes a complex of oxygen vacancy and zinc interstitial): (a) Ref.[21]; (b) Ref.[22]; (c) Ref.[13]; (d) Ref.[23]
air. This indicates that defect complexes not just single point defect are responsible for this emission. The energy level of this emission (2.18 eV) is close to the neutral oxygen-zinc interstitial (2.16 eV), which may be one reason responsible for the yellow- green emission.
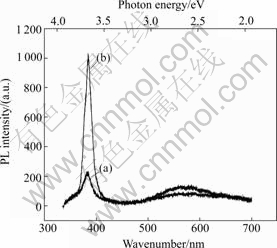
Fig.5 PL spectra of samples developed in 0.08 mol/L solution for 1 h before (a) and after (b) annealing in air
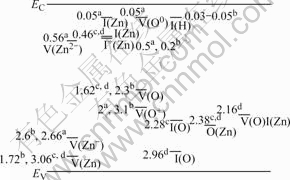
Fig.6 Energy levels of different defects in ZnO from different studies in the literature (V(Zn), V(Zn-) and V(Zn2+) denote neutrally,
4 Conclusions
1) The dominated orientation of ZnO rods varies from parallel at lower concentration to perpendicular to the substrate when the concentration increases to 0.1 mol/L and the vertical rods become a compact array ensemble as growth time increases to 4 h.
2) The ratio of the length to diameter decreases with increasing the reaction concentration but increases weakly with the growth time.
3) A strong UV emission and a weak visible yellow- green emission are observed for all as-grown ZnO rods and the optical quality of ZnO rods is enhanced after annealing.
References[1] K?NENKAMP R, WORD R C, SCHLEGEL C. Vertical nanowire light-emitting diode [J]. Applied Physics Letters, 2004, 85: 6004-6006.
[2] PARK W II, KIM J S, YI G C, BAE M H, LEE H J. Fabrication and electrical characteristics of high-performance ZnO nanorod field-effect transistors [J]. Applied Physics Letters, 2004, 85: 5052-5054.
[3] BAXTER J B, AYDIL E S. Nanowire-based dye-sensitized solar cells [J]. Applied Physics Letters, 2005, 86: 053114-053116.
[4] FAN Z Y, LU J G. Gate-refreshable nanowire chemical sensors [J]. Applied Physics Letters, 2005, 86: 123510-123512.
[5] WANG Zhong-lin. Nanostructures of zinc oxide [J]. Materials Today, 2004, 7(6): 26-33.
[6] HUANG M H, WU Y Y, FEICK H, TRAN N, WEBER E, YANG P D. Catalytic growth of zinc oxide nanowires by vapor transport [J]. Advanced Materials, 2001, 13: 113-116.
[7] PARK W I, KIM D H, JUNG S W, YI G C. Metalorganic vapor-phase epitaxial growth of vertically well-aligned ZnO nanorods [J]. Applied Physics Letters, 2002, 80: 4232-4234.
[8] VAYSSIERES L. Growth of arrayed nanorods and nanowires of ZnO from aqueous solution [J]. Advanced Materials, 2003, 15: 464-466.
[9] JANOTTI A, VAN DE WALLE C G. New insights into the role of native point defects in ZnO [J]. Journal of Crystal Growth, 2006, 287: 58-65.
[10] VAYSSIERES L. Advanced semiconductor nanostructures [J]. Comptes Renidus Chimie, 2006, 9: 691-701.
[11] VANHEUSDEN K, SEAGER C H, WARREN W L, TALLANT D R, VOIGT J A. Correlation between photoluminescence and oxygen vacancies in ZnO phosphors [J]. Applied Physics Letters, 1996, 68(3): 403-405.
[12] DIJKEN A V, MEULENKAMP E A, VANMAEKELBERGH D, MEIJERINK A. The kinetics of the radiative and nonradiative processes in nanocrystalline ZnO particles upon photoexcitation [J]. Journal of Physics Chemical B, 2000, 104: 1715-1723.
[13] LIN Bi-xia, FU Zhu-xi, JIA Yun-bo. Green luminescent center in undoped zinc oxide films deposited on silicon substrates [J]. Applied Physics Letters, 2001, 79: 943-945.
[14] DJURI?I? A B, CHOY C H, ROY V A L, LEUNG Y H, YWONG C Y, CHEAH K W, GUNDU RAO T K, CHAN W K, LUI H F, SURYA C. Photoluminescence and electron paramagnetic resonance of ZnO tetrapod structures [J]. Advanced Functional Materials, 2004, 14: 856-864.
[15] KWOK W M, DJURI?I? A B, LEUNG Y H, CHAN W K, PHILLIPS D L. Time-resolved photoluminescence study of the stimulated emission in ZnO nanoneedles [J]. Applied Physics Letters, 2005, 87: 093108-093100.
[16] LI D, LEUNG Y H, DJURI?I? A B, LIU Z T, XIE M H, SHI S L, XU S J, CHAN W K. Different origins of visible luminescence in ZnO nanostructures fabricated by the chemical and evaporation methods [J]. Applied Physics Letters, 2004, 85: 1601-1603.
[17] ZHOU H, ALVES H, HOFMANN D M, KRIEGSEIS W, MEYER B K, KACZMARCZYK G, HOFFMANN A. Behind the weak excitonic emission of ZnO quantum dots: ZnO/Zn(OH)2 core-shell structure [J]. Applied Physics Letters, 2002, 80: 210-212.
[18] FAN X M, LIAN J S, GUO Z X, LU H J. Microstructure and photoluminescence properties of ZnO thin films grown by PLD on Si(111) substrates [J]. Applied Surface Science, 2005, 239: 176-181.
[19] TAM K H, CHEUNG C K, LEUNG Y H, DJURI?I? A B, LING C C, BELING C D, FUNG S, KWOK W M, CHAN W K, PHILLIPS D L, DING L, GE W K. Defects in ZnO nanorods prepared by a hydrothermal method [J]. Journal of Physics Chemical B, 2006, 110: 20865-20871.
[20] TUOMISTO F, SAARINEN K, LOOK D C, FARLOW G C. Introduction and recovery of point defects in electron-irradiated ZnO [J]. Physical Review B, 2005, 72: 085206-085216.
[21] LIMA S A M, SIGOLI F A, JAFELICCI JR M, DAVOLOS M R. Luminescent properties and lattice defects correlation on zinc oxide [J]. International Journal of Inorganic Materials, 2001, 3: 749-754.
[22] NIKITENKO V. Optics and spectroscopy of point defects in ZnO [C]// NORBERG N H, TERUKOV E. Zinc oxide��A material for micro- and optoelectronic applications [M]. Netherlands: Springer, 2005: 69-81.
[23] XU P S, SUN Y M, SHI C S, XU F Q, PAN H B. The electronic structure and spectral properties of ZnO and its defects [J]. Nuclear Instruments and Methods in Physics Research B, 2003, 199: 286-290.
Foundation item: Project(2004CB619301) supported by the National Basic Research Program of China; Project supported by 985��Automotive Engineering of Jilin University, China
Corresponding author: LIAN Jian-she; Tel/Fax: +86-431-85095876; E-mail: lianjs@jlu.edu.cn
Abstract: The large-scale ZnO rods of submicrometer were prepared on the bare glass using a wet chemical method under different experimental parameters, such as the reactant concentration and the growth time. The microstructure of the ZnO rods was characterized by X-ray diffractometry(XRD) and field emission scanning electron microscopy (FESEM) with the energy dispersive X-ray spectroscopy(EDX), and the optical property was investigated by the room-temperature photoluminescence (PL) spectra. XRD and FESEM results show that the wurtzite structure and rod-like ZnO is obtained. The length (3-8 mm) and the diameter (400 nm- 3 mm) vary with the experimental parameters. A strong UV emission at 384 nm and a weak visible yellow-green emission around 570 nm are observed in the PL spectrum. After annealing at 600 �� in air, the UV peak intensity increases obviously and the yellow-green peak intensity decreases greatly. The near-band-edge UV emission is attributed to the exciton recombination; the yellow-green emission can be associated with the defect recombination; and some defect complexes may be responsible for the latter emission.
