

Application of cold drawn lamellar microstructure for developing ultra-high strength wires
S. Goto1, R. Kirchheim2, T. Al-Kassab2, C. Borchers2
1. Faculty of Engineering and Resource Science, Akita University, Tegata Gakuencho,
Akita 010-8502, Japan;
2. Institute fuer Materialphysik, University of Goettingen, Friedrich-Hund-Platz 1, D-37077, Goettingen, Germany
Received 15 July 2007; accepted 10 September 2007
Abstract:
Composite materials having lamellar structure are known to have a good combination of high strength and ductility. They are widely used in the fields of automobiles, civil engineering and construction, machines and many other industries. An application of lamellar microstructure for developing ultra-high strength steel wires was studied and discussed. Based on the experimental results, the relationships between the strength increase and microstructure development during the cold wire drawing were studied to reveal the strengthening mechanism. As cold drawing proceeds, the wire strength extremely increases, the microstructure changes from large single crystal lamellar structure to very fine polycrystalline lamellar one which has nano-sized grains, high dislocation density and amorphous regions. From the results obtained, it is concluded that heavy cold drawing technique is an effective method for lamellar composite to get high strength wires. Furthermore, formation process of the best microstructure for producing the ultra-high strength wires was also discussed.
Key words:
lamellar composite; strengthening mechanism; wire drawing; amorphous phase; mechanical property;
1 Introduction
Composite materials having hard phase and ductile phase are expected to have both of high strength and good toughness. Especially, lamellar composites produced by eutectic or eutectoid phase transformation are considered to be a hopeful candidate for high temperature structural materials because of their excellent thermal stability of microstructures. Fig.1 shows an example of the microstructure of lamellar eutectic composite in which very fine layer by layer lamellar structure composed of hard CuAl2 and soft Al phases are found[1].
It has been suggested that the strength of composite materials, ��C, is generally explained by ��the rule of mixtures��:
��C=VA��A+VB��B (1)
where ��A and ��B are the stresses supported by each component phase A and B, VA and VB are their volume fractions, respectively. In this equation, structure parameters such as lamellar spacing or lamellar thickness are not taken into consideration.
However, processes of severe plastic deformation such as drawing or rolling should change even the crystal structure by stress induced transformation in addition to lamellar spacing, so that they change the mechanical property of the composite materials as well. Especially, wire drawing process realizes a many axial stress condition that makes un-deformable phases in the composite materials possible to deform plastically without any failing. Therefore, the tensile strength of lamellar composite wire has been remarkably increased by wire drawing technique in recent year.
Various types of cold drawn pearlitic lamellar wires are used for many applications such as suspension cables, tire cord, engineering springs in the fields of automobiles, civil engineering and construction, machines and many other industries[2]. In fact, pearlitic steel wires of the strength 1 800 MPa were used for suspension cables of the Akashi Strait Bridge, the world��s largest suspension bridge, that was constructed in Japan at 1998. On the
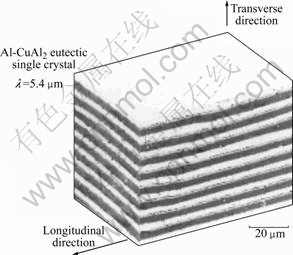
Fig.1 Typical example of lamellar microstructure in Al-CuAl2 eutectic composite
other hand, strength of the pearlitic wire for tire cords which was 3 000 MPa at the beginning of the 1980s has been improved to nearly 4 000 MPa[3]. It has also been reported that a hypereutectoid steel rod can be drawn into 60 ��m in diameter wire having strength of 5 000 MPa[4] that is the highest strength among mass-products at the present time. Recently, several attempts have been made to produce more high strength wires.
The structure of these pearlitic steel wires is the same as a lamellar composite comprising of a ductile soft ferrite and un-deformable hard cementite phases, in which the wire having the fine pearlitic lamellar structure can be readily drawn to extremely smaller diameters without any damage and fracture, though the hard cementite phase occupies one-tenth to one-fifth in volume. This means that the hard cementite phase in the wire is deformable under hydrostatic many axial deformation conditions and plays a great role for strengthening the wire during cold drawing.
Although many studies have been made on the production processes of cold drawn pearlitic steel wires[2,4], only few studies have been made on the strengthening mechanism with a basic view of clarifying the relationship between microstructure development and strength increase during cold wire drawing.
In present study, an attempt is made for clarifying the relationship between microstructure and strength during cold drawing in the pearlitic steel wire based on an experiment and revealing a rigorous method for producing more high strength steel wires. Although the experiment has been conducted on the steel wires, the reviled strengthening mechanism may be applied to many other non ferrous metal systems having lamellar structure.
2 Experimental
The material used for this experiment is a commercial steel wire that has a chemical composition of C 0.81, Si 0.20, Mn 0.49, P 0.006 and S 0.008 (mass fraction, %). The initial material is a cold drawn wire having a diameter of 1.70 mm that was initially prepared by drawing a 5.5 mm diameter rod to 3.25 mm diameter one, applying intermediate patenting comprising austenitization at 1 223 K and isothermal transformation at 873 K, and then redrawing the patented rod. To make a patented specimen, the cold drawn wire was given a final patenting, in which an austenitization was done with a resistance furnace at 1 223 K for 50 s and an isothermal transformation was carried out in a lead bath at a temperature of 833 K for 20 s. This wire was heavily strained by wet wire drawing preformed in industrial condition, in which the drawing was conducted at a drawing speed of 3.3��10-2 m/s with a reduction in area of 20% per one pass to eliminate the effect of the heat generated by working. Two kinds of wire specimens having 1.07 and 0.30 mm in diameter were made by this wire drawing process without any patenting.
In order to study the microstructure of these wire specimens, TEM observation was performed by the method described as follows. TEM foils have been obtained on both longitudinal and transverse sections of the wires. First, the wire diameter was increased to about 3 mm by electrolytic deposition of high purity nickel in a sulfurmate nickel bath. The samples were then cut on both longitudinal and transverse sections with a diamond saw. After mechanical polishing, the thin foils for TEM observation were made by means of electro-polishing and argon ion milling techniques. The thin foils (11 ��m��10 ��m��1.5 ��m33) for HRTEM (high-resolution transmission electron microscopy) were also made by using a focused ion beam apparatus. TEM and HRTEM observations were preformed using a JEOL 2000 CX and a Philips CM 200, respectively. Three-dimensional atom probe (3D-AP) was carried out for analyzing carbon distribution in the matrix at 40 K under ultrahigh- vacuum conditions (residual pressure 10-8 Pa), with 20% pulse fraction and 2.0 kHz pulse repetition rate. 3D-AP specimens were prepared by electro-polishing (15%, volume fraction) perchloric acid in methanol, 12-20 V). X-ray diffraction was also used to determine structure change in the cementite phase during the cold drawing and also to determine residual stress in the microstructure of the ferrite phase from the analysis of the diffraction peaks.
In order to determine the mechanical properties of these wire specimens, a tensile test was performed by using an Instron-type tensile test machine. The stress-strain curve was measured under a strain rate of 2.1��10-4 s-1 at room temperature. In addition to the tensile test, a micro-hardness test was performed by using a Vickers hardness tester.
3 Results and discussion
3.1 Drawing process and wire deformation
Fig.2 shows a schematic view of the wire-drawing process and the microstructure change of the wire after drawing[5]. Most of the plastic flow is caused by the compression force which arises from the reaction of the wire specimen with the die. A redundant (shearing) deformation in the wire also occurs under the complex stress field during the drawing. It has been theoretically analyzed that the limiting strain in drawing (fracture strain) is at least twice that of pure tension, though it depends on the strain hardening exponent of the wire material[6]. The hard cementite lamellar phase in pearlite wire can be plastically deformed during drawing, even if it has a small number of slip systems[7] and a high fracture strength of 8 000 MPa[8].
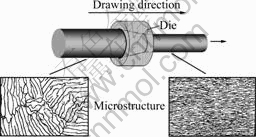
Fig.2 Schematic view of wire drawing process[5]
3.2 Microstructure change during cold drawing
The microstructure of the isothermally transformed 1.70 mm diameter wire (as-patented wire) was observed by TEM. As seen in Fig.3, microstructure of the as-patented wire was characterized by the fact that there are many randomly orientated pearlite colonies of alternating ferrite (bright) phase and cementite (dark) phase lamellae, each lamellar phase having a single orientation[5]. The size of pearlite colony was about 4 ��m in diameter and the inter-lamella spacing was about 66 nm. This microstructure is known to depend on the austenitizing and patenting conditions but not on carbon concentration in the wire. In the present experiment, the microstructure was similarly observed on both the longitudinal and transverse sections of the wire. This means that the microstructure in the wire is macroscopically isotropic. Fig.4 shows a bright field image and a cementite dark field image of a same region in the as-patented wire[5]. The microstructure of the pearlitic steel wire is quite similar to the lamellar composite one as shown in Fig.1. It has soft ferrite
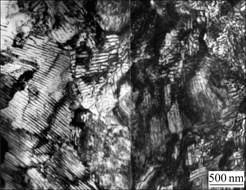
Fig.3 TEM micrograph of 1.70 mm diameter wire isothermally transformed for 20 s at 833 K[5]
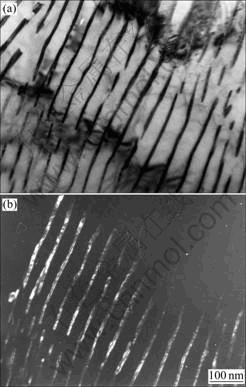
Fig.4 TEM micrographs of longitudinal section in as-patented 1.70 mm diameter wire: (a) Bright field image; (b) Cementite dark field image[5]
(bright) and hard cementite (dark) lamellar phases. The cementite lamellar phase shows a large single crystal structure, while the ferrite lamellar phase shows a few dislocations in the matrix, which are most likely to generate during cooling process from the patenting temperature to room temperature.
Fig.5 shows a bright field image and a cementite dark field image of a same region in longitudinal section of the cold drawn 1.07 mm diameter wire with a true strain of 0.94. It is found that the inter-lamellar spacing decreases and the dislocation density in ferrite phases
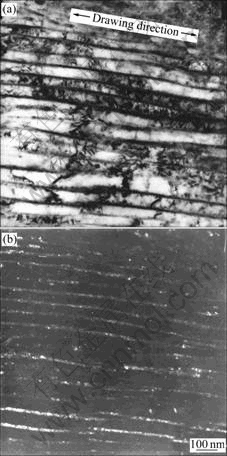
Fig.5 TEM micrographs of longitudinal section in drawn 1.07 mm diameter wire: (a) Bright field image; (b) Cementite dark field image
increases, forming dislocation cell structure as cold drawing proceeds. The fragmentation of cementite lamellar into planner arrays of white particle spots, sometimes as small as a few nano-meter in size, is observed in the dark field image as shown in Fig.5(b). This is a direct evidence for the fragmentation of cementite lamellar during cold drawing, which means that the hard cementite phase can deform under the hydrostatic many axial stress condition during wire drawing. This fact has been reported in Refs.[8-9].
Fig.6 shows a TEM micrograph of the longitudinal section in the cold drawn 0.30 mm diameter wire with a true strain of 3.47, in which the lamellae are rather straight and strongly aligned with the wire drawing direction. It is difficult to distinguish each dislocation, but notes the high density of extinction contours due to high dislocation density inside the ferrite lamellae. Strain concentration was also observed at the interface between the ferrite and cementite phases as pointed out by LANGUILLAUNE et al[8]. On the other hand, Fig.7 shows a TEM micrograph of transverse section in the drawn 0.30 mm diameter wire. It is found on this section that the pearlitic colonies have a wavy aspect and that
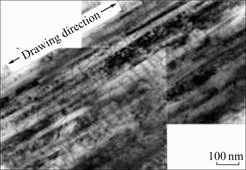
Fig.6 TEM micrograph of a longitudinal section in drawn 0.30 mm diameter wire
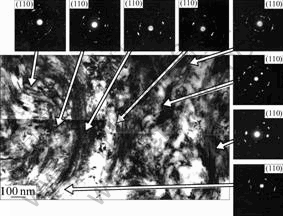
Fig.7 TEM micrograph of transverse section in drawn 0.30 mm diameter wire
lamellae present strong curvatures around the wire axis to make very complex microstructure as reported by LANGUILLAUNE et al[8]. This figure also shows the diffraction spots of some small regions. It is found that the wire axis shows the same [110] direction, while each the small region shows locally twisting around [110] crystallographic orientation that has been interpreted as a consequence of the fiber texture development in the ferrite phase during wire drawing[10].
3.3 Changes in mechanical properties during cold drawing
Fig.8 shows the true stress��true strain curves of the as-patented wire and the two cold drawn wires[11]. In these wires, the strength of the wires increases with increasing the tensile strain(��t) and also the drawing strain(��d). And the work hardening rate in the stress��strain curves also increases while increasing the drawing strain. Then, the drawn 0.30 mm diameter wire shows an ultra high strength of about 3 200 MPa.
Fig.9 shows the relationships among the cold drawing strain, ��d and the ultimate tensile strength, ��B, the yield strength, ��0.2 and the Vickers hardness, HV[11].
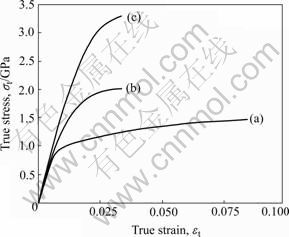
Fig.8 True stress��true strain curves of as-patented and cold drawn wires[11]: (a) d=0.30 mm, ��d=3.47; (c) d=1.07 mm, ��d=0.94; (c) d=1.70 mm, ��d=0, as-patented
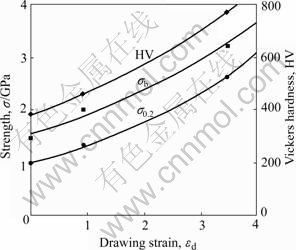
Fig.9 Relations between cold drawn strain ��d and values of ultimate tensile strength ��B, yield strength ��0.2 and Vickers hardness HV in wires[11]
As pointed out by LANGFORD[12], the values increase exponentially with increasing drawing strain. However, the elongation to fracture decreases with increasing the drawing strain as shown in Fig.8. Therefore, the fracture surface of these wire specimens was observed to check the fracture mode after the tensile test. Fig.10 shows the results, in which each fracture surface shows a cup and cone type fracture and small dimple pattern in the fracture surface. This means that the cold drawn wires are still ductile. Then, it can be concluded that the heavily cold drawn pearlitic lamellar wire has an excellent combination of ultra high strength and ductility.
However it is well known that sometimes delamination fracture occurs to make short elongation in cold drawn wires[13]. Therefore, a new drawing technique without delamination fracture should be developed when more high strength wires have to be produced.
3.4 Some factors for strength increase during cold drawing
To reveal the strengthening mechanism of the cold drawn pearlitic lamellar wires, the changes in characteristics of the cementite and ferrite phases during the wire drawing were studied. Fig.11 shows an effect of the drawing strain on the inter-lamellar spacing and the volume fraction of cementite in pearlite[11]. The inter-lamellar spacing decreases almost linearly with increasing drawing strain or decreasing wire diameter as expected. However, the volume fraction of cementite also decreases with increasing drawing strain, though it should not change, but be constant during wire drawing. This means a direct evidence for the cementite dissolution into ferrite phase during wire drawing. As pointed out by several authors[8,14]. This fact suggests that there is strong interaction between carbon atoms in cementite phase and dislocations in ferrite phase to decompose the cementite phase, and that the strength increase during wire drawing may stem from a pinning effect for moving dislocations in the ferrite phase due to the redistribution of carbon atoms around the dislocations in the ferrite matrix, though the volume fraction of strong cementite phase decreases during the wire drawing. Naturally, accumulation of high density dislocations in the ferrite phase as shown in Figs.5 and 6 can be thought to be one reason for strengthening the wire, because of the strain work hardening.
Fig.12 shows X-ray diffraction spectra obtained on the cementite phases extracted from the pearlitic wires. Although many cementite peaks present in the case of as-patented wire, they are strongly broadening in the case of the drawn 1.07 mm diameter wire due to a very small sized fragmentation as shown in Fig.5 and high elastic strains inside the cementite domains. As drawing proceeds, however, most of these diffraction peaks disappear probably due to the existence of both nano-crystalline[15-16] and amorphous regions, as seen in the case of the drawn 0.30 mm diameter wire (shown in Fig.13).
In order to obtain some information as for ferrite phase, the internal stress in ferrite phase was measured by X-ray diffraction technique. Fig.14 shows the relation between the internal stress and the cold drawing strain in the longitudinal and transverse directions of the wires. It is found that both the directions show compressive internal stress, though the stress in longitudinal direction is much larger than that in transverse direction. Assuming that the internal stress, ��i, is due to accumulation of dislocations in ferrite phase, the dis-
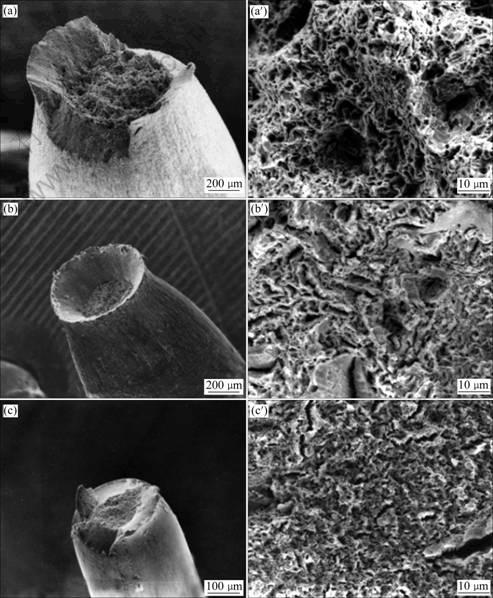
Fig.10 SEM micrographs of fracture surface in wires after tensile test: (a), (a��) As-patented, 1.7 mm; (b), (b��) Drawn to 1.07 mm; (c), (c��) Drawn to 0.30 mm
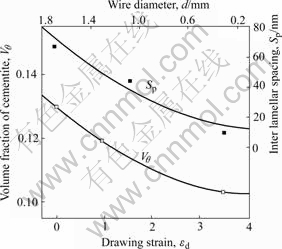
Fig.11 Relations among cementite volume fraction (V��), drawn strain (��d), inter-lamellar spacing (Sp) and wire diameter d[11]
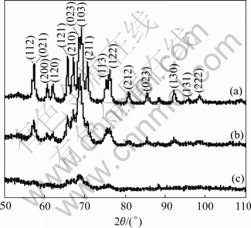
Fig.12 X-ray diffraction patterns of cementite phase extracted from three kinds of wires: (a) As-patented wire; (b) Drawn 1.07 mm diameter wire; (c) Drawn 0.30 mm diameter wire
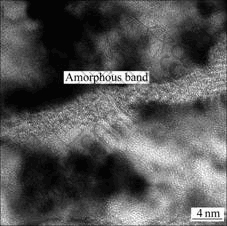
Fig.13 HRTEM micrograph of drawn 0.30 mm diameter wire showing presence of amorphous band located in cementite phase
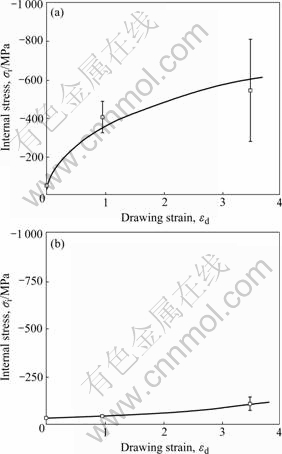
Fig.14 Relation between cold drawing strain (��d) and internal stress (��i) obtained by {211} plane diffraction of ferrite phase: (a) Longitudinal direction; (b) Transverse direction
location density, ��, in ferrite phase can be estimated by using Bailey-Hirsch equation:
��i=��Gb��1/2 (2)
where �� is a constant, G is elastic constant and b is the magnitude of the Burgers vector. The stress in longitudinal direction of the drawn 0.30 mm diameter wire shows especially large value of 500 MPa, which corresponds to the dislocation density of 1.5��1027/m2 when ��=0.62, G=8.3��104 N/m2 and b=2.5��10-10 m. This value is much larger than that of 5��1016/m2 that has thought to be the maximum dislocation density possibly accumulated in ferritic steel bulk specimen. This means that dislocations are effectively accumulated in ferrite phase of pearlite by the constraint effect of hard cementite phase barrier.
HRTEM is a good technique for obtaining information on lattice imperfections in addition to lattice plane image of the ferrite and cementite phases.
Fig.13 shows a HRTEM micrograph of the drawn 0.30 mm diameter wire showing strain fields (dark regions) and amorphous region with few nanometer thick (amorphous band) in the cementite phase. These amorphous regions were well observed in the cementite phase. Probably, they are thought to be generated by plastically local deformation under a complex stress field during the wire drawing because of a small number of slip systems in cementite phase. Fig.15 shows a HRTEM micrograph of the drawn 0.30 mm diameter wire showing the presence of amorphous interfaces that are located between the ferrite and cementite phases. The interface between ferrite and cementite phases is thought to be a stress concentrated region because of large difference in slip systems for the ferrite and cementite phases. Therefore, these amorphous interfaces are thought to be transformed from the cementite interface region because the ferrite phase can easily deform by slip deformation. Fig.16 shows a HRTEM micrograph of the drawn 0.30 mm diameter wire showing moir�� image in ferrite phase. These moir�� image were well observed in the ferrite phase that has high density of dislocations and sometimes very small nano sized crystalline grains as pointed out by IVANISENKO et al[16]. Therefore, this is
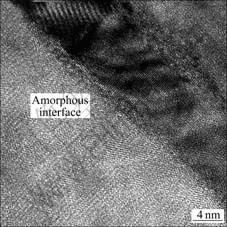
Fig.15 HRTEM micrograph of drawn 0.30 mm diameter wire showing presence of amorphous interfaces located between ferrite and cementite phases
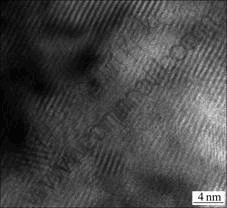
Fig.16 HRTEM micrograph of drawn 0.30 mm diameter wire showing Moir�� image in ferrite phase
an evidence of high density of dislocations in the ferrite phase, which generated during wire drawing, as described in Fig.6.
The 3-dimensional atom probe technique is a good method for obtaining information on the positions of atoms or spatial distribution of atoms in a specimen, in which atoms are removed from a conducting sample by a high voltage pulse, the time of flight reveals their chemical nature, and continuous stripping allows lateral and in-depth analysis[17]. By using this technique carbon atom distribution and concentration in the ferrite phase was investigated. Fig.17 shows the distribution of carbon atoms in ferrite phase of the drawn 0.30 mm diameter wire, which was obtained by the 3-dimensional atom probe. The spatial distribution of carbon atoms appears to seemingly be uniform as shown in Fig.17(a). However, it appears quite evident that carbon atoms are segregating along dislocations because of linear arrays of high concentration positions as shown in Fig.17 (b).��Fig.18 shows the concentration profiles of carbon atoms in any given directions of the ferrite phase.
Average concentration of carbon atoms in the ferrite phase shows 0.41% (molar fraction), which is much higher than that of the equilibrium state. That means, the carbon atoms are segregating at dislocations and supersaturated in the ferrite phase as pointed out by LAGUILLAUME et al[8].
3.5 Strengthening mechanism of cold drawn lamellar wires
From the results obtained in this experiment, the strengthening mechanism of the cold drawn lamellar wire may be summarized as follows. Fig.19 shows a schematic view of the microstructure change during cold drawing. The as-patented wire is characterized by a lamellar composite structure comprising of the ductile
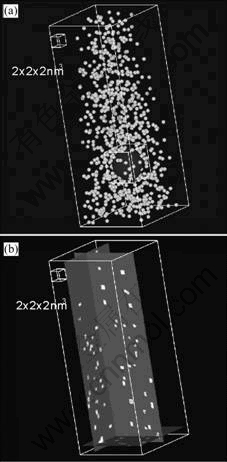
Fig.17 Distribution of carbon atoms in ferrite phase of drawn 0.30 mm diameter wire: (a) Spatial distribution of carbon atoms; (b) Planer distribution of carbon concentrations in any given planes
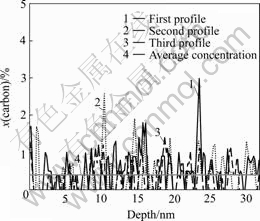
Fig.18 Concentration profiles of carbon atoms in ferrite phase of drawn 0.30 mm diameter wire
soft ferrite single crystal and hard cementite single crystal phases. As drawing proceeds, however, the inter-lamellar spacing and volume fraction of cementite phase decrease. The cementite phase changes into planner
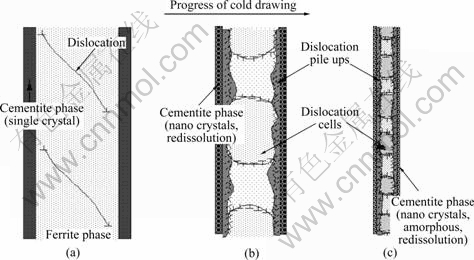
Fig.19 Schematic view of microstructure change during cold drawing: (a) As-patented, 1.70 mm; (b) Drawn to 1.07 mm; (c) Drawn to 0.30 mm
arrays of nano scale fine crystals with small amorphous regions by fragmentation as shown in Fig.5. And also a part of cementite phase dissolves into the ferrite phase to cause the super saturation of carbon atoms in the ferrite phase. While the ferrite phase increases the dislocation density to make very high compressive internal stress conditions as shown in Fig.13. These facts suggest that the very thin cementite layer in the wire plays a great role for accumulating a high density of dislocations in the ferrite phases as shown in Fig.6. This microstructure has an ultra high strength of 3 200 MPa as shown in Fig.8.
Therefore, the strength increase during cold drawing seems to be due to the work hardening of ferrite phase and a pinning effect to moving dislocations by the redistribution of supersaturated carbon atoms in ferrite phase, in addition to the formation of amorphous regions and fine nano-crystalline cementite phases as shown in Figs.14 and 15.
Especially, it is attractive that lamellar structure can be readily produced on ultra high strength even at a smaller drawing strain because of the large work hardening rate as shown in Fig.8. This strengthening mechanism may be also applied to other non ferrous metal systems having lamellar structure, such as Cu-Al, Cu-In, Ni-In and Zn-Al eutectoid alloys.
4 Conclusions
1) The heavily cold drawn pearlitic lamellar wire shows an extremely high strength and acceptable level of toughness for construction materials, so that heavy cold drawing technique is a rigorous method for lamellar composite to produce ultra high strength wires.
2) The high strength may be caused by a formation of very fine lamellar structure as small as a few nano-meter in size during cold wire drawing, which has very thin ferrite phases having extremely high dislocation density and supersaturated carbon atoms and also very thin cementite phases having amorphous and nano-crystalline regions.
3) It is important to develop a new cold drawing technique that allows for accumulating more high strain in the wire. The reviled strengthening mechanism may be applied to many other non ferrous metal systems which have lamellar structure.
Acknowledgements
Financial support by the Alexander von Humboldt Stiftung is gratefully acknowledged. We also would like to thank Drs. H. Tashiro and K. Nakamura in Nippon Steel Corporation for providing the steel wire specimens used in this experiment.
References
[1] GOTO S, YAMASHITA S, MIMURA T, YOSHINAGA H. Yield strength of Al-CuAl2 lamellar-eutectic composites at high temperatures [J]. Trans JIM, 1986, 27(7): 512-523.
[2] TASHIRO H. Piano wire of the highest tensile strength steel [J]. Materia Japan, 1996, 35(11): 1177-1181.
[3] TAKAHASHI T, OCHIAI I, SATOH H. Development of ultra-high strength steel wire [J]. Shinnittetsu Giho, 1992, 343: 86-90. (in Japanese)
[4] OCHIAI I, NISHIDA S, TASHIRO H. Effects of metallurgical factors on strengthening of steel tire coed [J]. Wire J, 1993, 26: 50.
[5] GOTO S, KOMATSU Y, KIRCHHEIM R, AL-KASSAB T. Strength of cold drawn pearlitic steel wires [J]. Kogyohakubutsukan, Akita University, 2006, 39: 3-17.
[6] DIETER G E. Mechanical behavior of materials under tension [J]. Mechanical Metallurgy, McGraw-Hill, 1976: 666.
[7] MAURER K, WARRINGTON D H. Deformation of cementation [J]. Philos Mag, 1957, 15: 321.
[8] LAGUILLAUME J, KAPELSKI G, BAUDELET B. Cementite dissolution in heavily cold drawn pearlitic steel wires [J]. Acta Mater, 1997, 45(3): 1201-1212.
[9] SAUVAGE X, COPREAUX J, DANOIX F, BLAVETTE D. Atomic-scale observation and modeling of cementite dissolution in heavily deformed pearlitic steel [J]. Philos Mag A, 2000, 80: 781-796.
[10] HOSFORD W F Jr. Microstructural changes during deformation of [011] fiber-textured metals [J]. Trans AIME, 1964, 230: 12-15.
[11] GOTO S, SASAKI K, ASO S, LIU W, LU M,��TASHIRO T, NAKAMURA K. Strengthening of pearlitic steels by heavily cold drawing [J]. Proc Int Sym on Strength Theories, Application and Developments, Xi��an, 1998: 529-534.
[12] LANGFORD G. Deformation of pearlite [J]. Metall Trans A, 1977, 8A: 861.
[13] TAKAHASHI T, OHASHI S, TARUI T, ASANO Y. Mechanism of delamination cracking in ultra-high tensile strength wire [J]. Shinnittetsu Giho, 1992, 347: 22-26. (in Japanese)
[14] READ H G, REYNOLDS Jr W T, HONO K, TARUI T. APFIM and TEM studies of drawn pearlitic wire [J]. Scripta Mater, 1997, 37: 1221-1230.
[15] DAITOH Y, HAMADA T. Microstructure of heavily deformed high carbon steel wire [J]. CAMP-ISIJ, 1997, 10: 1284.
[16] IVANISENKO YU, MACLAREN I, SAUVAGE X, VALIEV R Z, FECHT H J. Shear-induced ������ transformation in nanoscale Fe-C composite [J]. Acta Met, 2006, 54: 1659-1669.
[17] KIRCHHEIM R. Chemical composition of advanced materials as obtained by the 3-dimensional atom probe [C]// Proc Fifth Int Conf on Materials Engineering Resources, Akita, Japan, 2005: 18-23.
(Edited by LI Xiang-qun)
Foundation item: Project supported by the Alexander von Humboldt Foundation of Germany
Corresponding author: S. Goto; Tel: +81-18-8892794; Fax: 81-18-8892465; E-mail: goto_shoji@ybb.ne.jp
