
J. Cent. South Univ. (2016) 23: 3284-3292
DOI: 10.1007/s11771-016-3394-4

Nonlinear characteristics of induced spontaneous combustion process of sulfide ores
PAN Wei(��ΰ)1, WU Chao(�ⳬ)1, LI Zi-jun(���ξ�)1, SHI Ying(ʯӢ)1, YANG Yue-ping(����ƽ)2
1. School of Resources and Safety Engineering, Central South University, Changsha 410083, China;
2. School of Nuclear Resources Engineering, University of South China, Hengyang 421001, China
 Central South University Press and Springer-Verlag Berlin Heidelberg 2016
Abstract:
To investigate the relationship between nonlinear parameters and spontaneous combustion tendency of sulfide ores, nine different sulfide ore samples were taken from a pyrite mine in China, and induced spontaneous combustion experiment was carried out in the laboratory. Different stages of the induced spontaneous combustion process were studied by integrating wavelet technology and nonlinear dynamics theory. The results show that ignition points of all the ore samples are above 330 ��C, indicating that sulfide ores of the pyrite mine are difficult to combust spontaneously under normal mining conditions. Spontaneous combustion process includes three stages: incubation stage, development stage and approaching stage. The average temperature rising rate of the three stages are 1.0 ��C/min, 2.0 ��C/min and 4.2 ��C/min, respectively. During the spontaneous combustion process, mean values of approximate entropy and correlation dimension increase at first, and then decrease in the following stage. The mean value of the maximum Lyapunov exponent increases with the passage of reaction time. In a whole, correlation among the three nonlinear parameters firstly weakens, then enhances, and the best correlation period is at approaching stage. As ignition point increases, the maximum Lyapunov exponent of approaching stage decreases. Therefore, combustible tendency of sulfide ores could be qualitatively evaluated based on the maximum Lyapunov exponent of this stage.
Key words:
1 Introduction
Spontaneous combustion of sulfide ores is one of the most serious disasters in high-sulfur mines during mining process [1-3]. In China, about 30% of nonferrous metal mines, 10% of iron mines (mainly pyrite mines), and 10% of nonmetal construction materials mines are in the risk of spontaneous combustion. Spontaneous fires of sulfide ores in underground mines could produce large quantities of toxic gases and heat to deteriorate the work environment, resulting in substantial economic losses, even the loss of human life [4-6]. Therefore, research on spontaneous combustion tendency of sulfide ores is an important protection to ensure safe and efficient mining for high-sulfur mines.
Based on the relevant literatures, reports on spontaneous combustion tendency of sulfide ores could be divided into determination indicators and comprehensive determination methods. Determination indicators include oxidation mass gain rate [7], self-heating initiative temperature [8], apparent activation energy [9] and so on. Multi-index comprehensive evaluation method [10], evaluation method based on entropy and set pair analysis theory [11], and Fisher discriminant analysis method [12] represent the comprehensive determination methods.
To evaluate the spontaneous combustion tendency of sulfide ores comprehensively, ignition point is usually adopted as an indicator. As the spontaneous combustion of sulfide ores is a nonlinear multi-factor coupling evolution process, research on the unsteady spontaneous combustion process using nonlinear dynamics theory to investigate the relationship between nonlinear parameters and spontaneous combustion tendency is worthy of further study. At present, there is little research on nonlinear characteristics of spontaneous combustion process of sulfide ores.
Due to the restrictions of underground mining and test conditions, it is difficult to carry out large-scale field test in the field. In this work, nine typical sulfide ore samples from a pyrite mine in China were taken as experimental materials, and their induced spontaneous combustion processes were simulated in laboratory Combined with wavelet technology and nonlinear dynamics theory, three different stages of spontaneous combustion process were analyzed.
2 Experimental
2.1 Ore samples analysis
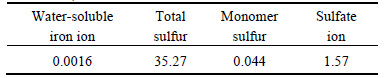
Sulfide ore samples were collected from a pyrite mine in China with the sampling method of multi-point sampling, and nine representative samples were taken as experimental materials. As an example, the main chemical composition of the ore sample 1 is listed in Table 1.
Table 1 Main chemical composition of ore sample 1 (mass fraction, %)
Metallic mineral of the ore sample 1 is pyrite with two-stage mineralization. The largest size of early-stage pyrite particles is about 5 mm, and their average size is about 2 mm. They are fragmented as a result of the stress action. Unlike the early-stage pyrite particles, the late-stage pyrite particles are fine-grained aggregates with the average size of about 5 ��m. The micrograph of the ore sample 1 is shown in Fig. 1.
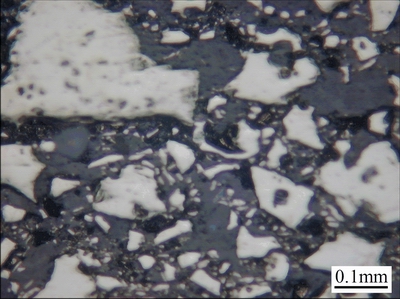
Fig. 1 Micrograph of ore sample 1
2.2 Experimental method
In the experiment, the particle diameter of ore samples was ground to less than 180 ��m . Each sample with mass of 100 to 150 g and moisture content of about 5% was put into the reactor in the pot resistance furnace to simulate its induced spontaneous combustion process owing to the weak oxidation of sulfide ores at normal temperature. The initial temperature of experiment was set at about 60 ��C, and the induced spontaneous combustion process was simulated at the heating rate of about 2 ��C/min. After ore samples had obvious combustion phenomenon (heavy smoke in the reactor), ore temperature could increase rapidly and exceed ambient temperature of pot resistance furnace finally. The crossing point temperature was chosen as the ignition point of ore samples.
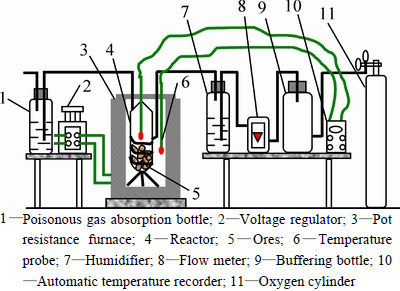
Fig. 2 Schematic diagram of experimental apparatus:
3 Experimental results
By analyzing the induced spontaneous combustion curves, the ignition points of ore samples were determined except for the ore sample 4 in which no crossing point existed on its induced spontaneous combustion curve. Induced spontaneous combustion process of the eight ore samples (samples 1, 2, 3, 5, 6, 7, 8 and 9) are with common characteristics. According to the temperature variation trend of ore samples, spontaneous combustion process could be divided into three stages: incubation stage (stage I), development stage (stage II) and approaching stage (stage III). In this experiment, the average values of upper temperature limit at stage I and stage II are 110.3 ��C and 280.8 ��C respectively.
At stage I, oxidation of ore samples is weak and reaction heat is little. Correspondingly, the average heating rate of this stage is relatively low, about 1.0 ��C/min. At stage II, oxidation reaction rate of ore samples grows and the average heating rate increases to 2.0 ��C/min as a result of energy accumulation and activity excitation at the previous stage. At stage III, oxidation reaction rate of ore samples grows rapidly so that the reaction heat can not dissipate completely. Therefore, ore temperature rises drastically to induce spontaneous combustion. The average heating rate of this stage is about 4.2 ��C /min.
Figure 3 displays the induced spontaneous combustion process of the ore sample 1. It shows that the obvious combustion period lies between 183 and 188 min and the ignition point (crossing point temperature) is 408 ��C.
During the experiment process, when the measured ore temperature was equal to ambient temperature, the value was determined as the ignition point. If the measured ore temperature is lower than ambient temperature at former moment, and then higher than ambient temperature, the ignition point was determined using the cubic spline interpolation method. Measured results of ignition point are shown in Fig. 4. It is found that ignition points of all the ore samples are above 330 ��C, which means that they are difficult to combust spontaneously under normal mining conditions.
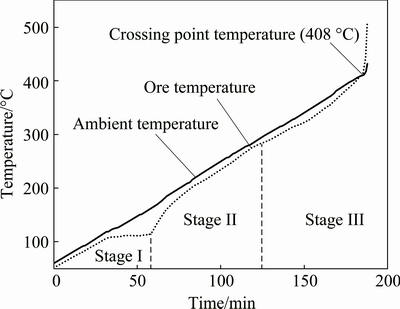
Fig. 3 Induced spontaneous combustion process of ore sample 1
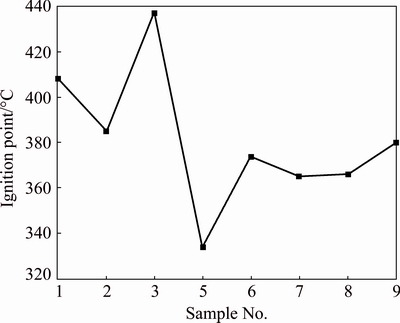
Fig. 4 Measured results of ignition point
4 Preprocessing of measured temperature series
In this experiment, temperature variations of ore samples were caused by the comprehensive effect of pot resistance furnace and exothermic oxidation of ore samples, and the former played as a dominant role. Hence, it is necessary to separate self-heating information from the measured temperature series. Then, the temperature series were processed by wavelet decomposition and reconstruction [13]. The low frequency components of the series (large scale approximation parts) reflect the heating effect of pot resistance furnace, and high frequency components (details) contain the complicated self-heating information of ore samples.
Due to the limited measured data, the temperature series of the eight samples were extended with the cubic spline interpolation method, and the length of the expanded series was 451. For temperature increments could show the pre- and post-temperature variations more intuitively, they were selected as the research objects.
Appropriate wavelet function is the key to wavelet analysis. In this work, fifty-four wavelet functions of seven common wavelet series were selected based on the following optimization criteria.
1) Because high frequency reconstructed series which contain self-heating information of ores account for the small proportion, the difference of mean value between low frequency reconstructed series and the original series is small.
2) Owing to the removal of the complicated self-heating information, variation coefficient of low frequency reconstructed series is less than that of the original series.
3) Interference of the complicated self-heating information can weaken the correlation of the original series. Therefore, autocorrelation coefficient of low frequency reconstructed series is greater than that of the original series.
4) Low frequency reconstructed series should maintain the basic characteristics of the original series. Their skewness coefficient should have little difference.
The results of wavelet function optimization indicate that there is no common wavelet function suitable for all the ore samples. For samples 1, 2, 3, 5 and 8, the appropriate wavelet function is dmey, and the wavelet function bior3.1 is suitable for samples 6, 7 and 9.
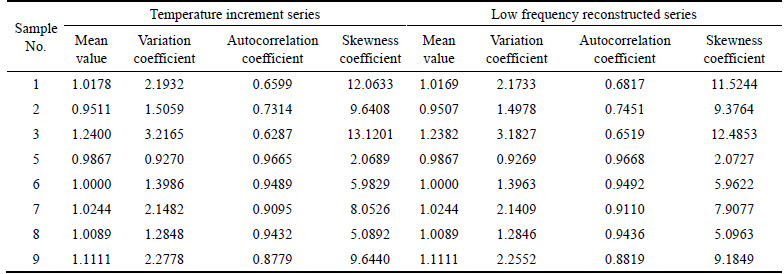
The characteristic values of corresponding series are listed in Table 2, which show that the series are all positive skew distribution, and mean values have little difference, but variation coefficients, autocorrelation coefficients and skewness coefficients have great difference.
For these eight kinds of ore samples, their temperature increment series were decomposed with the appropriate wavelet function, and then the first layer of high frequency coefficients were reconstructed. Finally, the high frequency reconstructed series were normalized as the research series.
In order to reveal the nonlinear characteristics of spontaneous combustion process at the three different stages, research series need to be split into three subsequences based on experimental observations.
Table 2 Characteristic values for corresponding series of ore samples
5 Extraction of nonlinear characteristic parameters
5.1 Extraction of approximate entropy
For a given N-point research series {x(i), i=1, ��, N}, approximate entropy could be obtained by the following steps (m is the dimension, and r is the threshold value) [14]:
1) Compose the m-dimensional vector X(i) as follows:
X(i)=[x(i), x(i+1), ��, x(i+m-1)], i=1, 2, ��, N-m+1 (1)
2) For every i value, calculate the distance between X(i) and X(j), namely
 (2)
(2)
3) Given the threshold value r (r>0), for each i value, count the number of d[X(i), X(j)] )and calculate the ratio of to the total number of vectors (denoted as
  ), so
), so
 (3)
(3)
4) Calculate the logarithm of and its average value, denoted as  , namely
 (4)
(4)
5) For m+1, repeat steps 1-4, to obtain  . The approximate entropy value is
 (5)
(5)
Usually m=2, r=k�� (k is empirical coefficient, k=0.1-0.2; �� is standard deviation of research series) are used to calculate the approximate entropy. In this work, empirical coefficient was determined according to the variation extent of approximate entropy with different k values, which can be expressed as
 (6)
(6)
ki+1=ki+l (7)
where ki is the trial value (k1=0.1); i is the iteration times (i=1-11) and l is the step length (l=0.01).
For all the ore samples, when the average E takes on minimum value, the corresponding k value is optimal.
Figure 5 denotes the variation of approximate entropy with different values of i. When i=10, namely ki=0.19, the average E takes the minimum value of 1.68%.
Correspondingly, approximate entropies of all the ore samples are listed in Table 3.
5.2 Extraction of correlation dimension
Correlation dimension could be calculated by the following steps based on the GP algorithm [15]:
1) For the m-dimensional reconstructed phase space, define the correlation integral as
 (8)
(8)
where N is the number of phase point; r is hypersphere radius; ��Xi-Xj��is the euclidean distance between the phase point Xi and Xj; and �� is called Heaviside function.
2) Adjust the value of r in a certain range to meet
 (9)
(9)
where D(m) is an estimation of correlation dimension.
3) When the embedding dimension m is equal to the saturated embedding dimension mc, D(m) will be stable and the stable value is correlation dimension D2.
To reduce the amount of calculation, when the relationship between D(m) and D(m-1) accords with Eq. (10), calculation procedure will automatically terminate. In this case, m and D(m) are considered mc and D2 respectively [16].
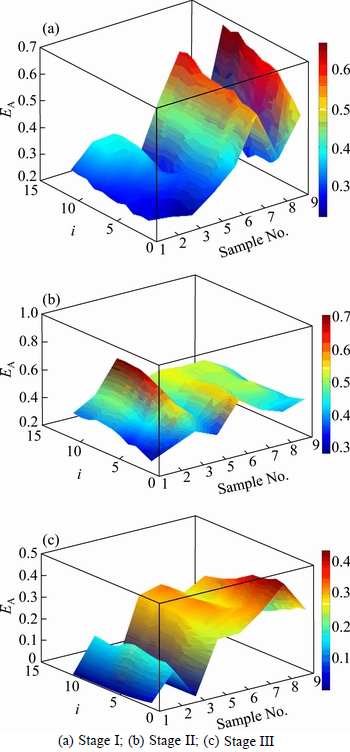
Fig. 5 EA-i curves of ore samples:
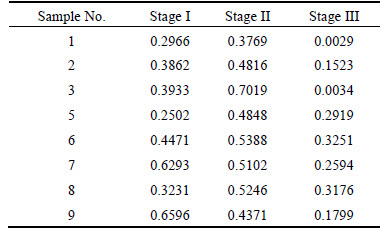
Table 3 Calculated results EA of ore samples (k=0.19)
[D(m)-D(m-1)]/D(m)��10% (10)
In actual calculation of D2, the optional delay time �� was obtained using the improved auto-correlation function method [17] firstly, and then D2 was extracted in reconstructed phase space.
D(m)-m curves for research series of the ore sample 1 are depicted in Fig. 6, which indicate that mc of stage I, stage II and stage III are 4, 5 and 5, respectively. Accordingly, D2 values of the three stages are 1.5223, 2.3723 and 0.4017, respectively.
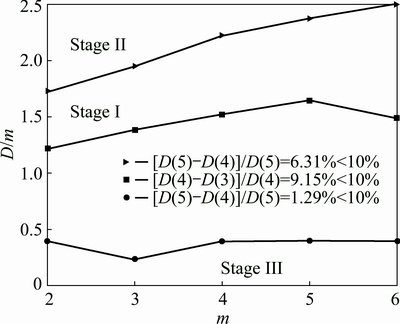
Fig. 6 D(m)-m curves of ore sample 1
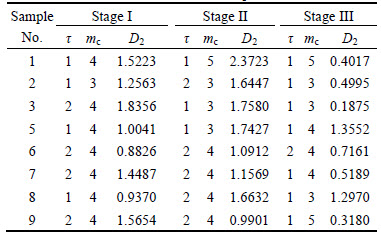
The calculated D2 results of all the ore samples are listed in Table 4.
Table 4 Calculated D2 results of ore samples
5.3 Extraction of maximum Lyapunov exponent
The maximum Lyapunov exponent can be calculated by the following steps by means of small data sets [18].
1) In the m-dimensional reconstructed phase space, search the nearest neighbor point Xjj of the reference point Xj and keep temporal separation:
 (11)
(11)
where dj(0) is the initial distance between the phase point Xj and its nearest neighbor point Xjj and p is the mean period of research series.
2) To each point Xj, calculate the distance dj(i):
 (12)
(12)
3) For general j, calculate the average value of y(i):
 (13)
(13)
where q is the number of all non-zero dj(i).
4) Select the linear region of y(i)-i curves and make the regression line using the least square method. The slope of the line is the maximum Lyapunov exponent ��max.
For the ore sample 1, the mean period of the three stages was calculated with the value of 3, 3 and 4 based on FFT method. The phase space was reconstructed according to Table 4, and then the maximum Lyapunov exponent (��max=0.0002, 0.0004 and 0.0008) was obtained following the above step. Figure 7 shows the ��max results of the ore sample 1.
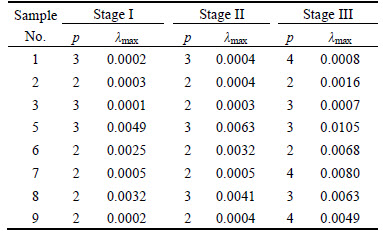
Table 5 lists ��max results of all the ore samples.
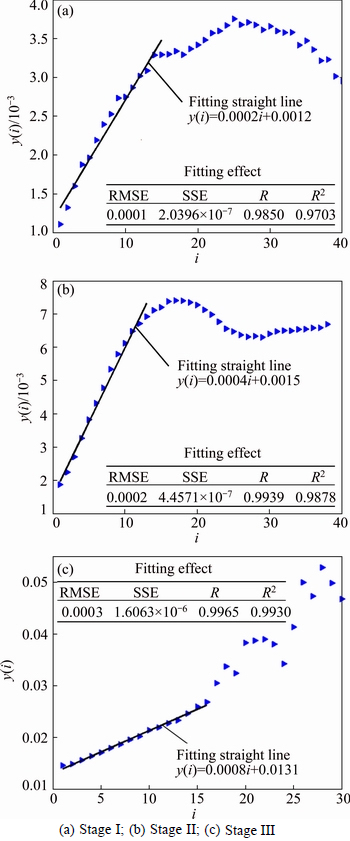
Fig. 7 ��max results of ore sample 1:
Table 5 Calculated ��max results of ore samples
6 Nonlinear characteristics of spontaneous combustion process
Figure 8 displays the variation trend for nonlinear parameters of all the ore samples. It shows that mean values of EA and D2 increase at first, and then decrease, but mean value of ��max increases with the self-heating reaction time. For the former two parameters, the minimum values appear at stage III.
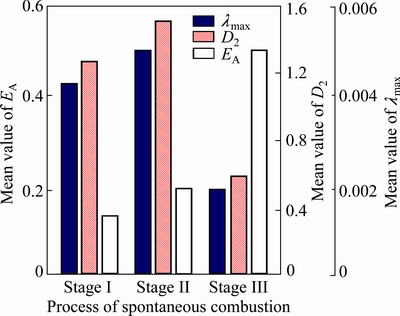
Fig. 8 Variation trend of nonlinear parameters
Both EA and D2 could be adopted to characterize the complexity of nonlinear systems. However, there are some differences between the two parameters. EA mainly reflects the disorder degree of the system. D2 is sensitive to inhomogeneity for chaotic attractor. At stage II, oxidation rate of ore samples transits from low speed to high speed which means that this stage is the transition phase of spontaneous combustion process and its kinetic structure has mutation. As a result, mean values of EA and D2 are maximum at this stage. At stage III, spontaneous combustion of ore samples is induced due to the sharp increase of ore temperature. In macroscopic view, stage III is an orderly evolution process, and consequently mean values of EA and D2 are minimum at this stage.
��max is an estimation of predictability for a chaotic system. It reflects the sensitive dependence of the chaotic system on initial conditions. At stage I, chemical activity of ore samples has not been excited and ore samples can not react with oxygen rapidly. Thus, chaotic degree of this stage is the lowest. Stage II is the process to increase the surface energy of ore molecule. With the rising temperature of self-heating reaction and pot resistance furnace, chemical activity and oxidation rate of ore samples increase. Therefore, chaotic degree of this stage enhances gradually. At stage III, oxygen begin to enter the molecule interior structure of ore samples to bring about dramatic increase of oxidation rate. That is why chaotic degree of this stage is the highest.
Figure 9 shows the variation trend for correlation coefficients of nonlinear parameters, where corrcoef (EA, D2) is the correlation coefficient of EA and D2, corrcoef (��max, EA) is the correlation coefficient of ��max and EA, and corrcoef (D2, ��max) is the correlation coefficient of D2 and ��max.
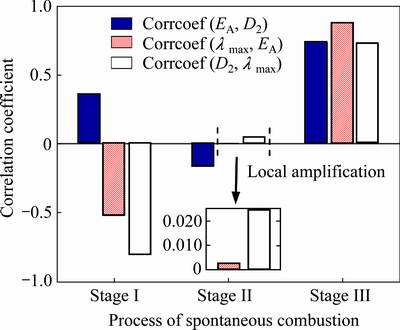
Fig. 9 Variation trend for correlation coefficients of nonlinear parameters
From Fig. 9, it can be found that correlation variation between the three nonlinear parameters is very different during spontaneous combustion process. In a whole, correlation between the nonlinear parameters weakens at first, then enhances with the passage of reaction time, and the best correlation period is at stage III. At stage I, EA and D2 show a low positive correlation with the correlation coefficient of 0.3568. ��max and EA have a moderate negative correlation with the correlation coefficient of -0.5218. D2 and ��max have a high negative correlation with the correlation coefficient of -0.8046. At stage II, there are extreme low correlation between the three nonlinear parameters with absolute values of correlation coefficients less than 0.1590. At stage III, the three nonlinear parameters show high positive correlation with correlation coefficients greater than 0.7220. The main reason for correlation variation is that spontaneous combustion of sulfide ores is an unsteady evolution process. Figure 9 indicates that to explore the new evaluation method for combustible tendency of sulfide ores based on nonlinear multi-parameters fusion, nonlinear parameters of stage III should be extracted and adopted because of their high correlation with each other.
Figure 10 shows the relationship between nonlinear parameters of the three stages and ignition point. It indicates that there is no significant correlation between nonlinear parameters and ignition point. But at stage III, for ore samples 1, 2, 3, 5 and 8 (using dmey wavelet), and ore samples 6, 7 and 9 (using bior3.1 wavelet), ��max decreases with the increase of ignition point. Thus, combustible tendency of sulfide ores could be qualitatively evaluated using ��max of this stage.
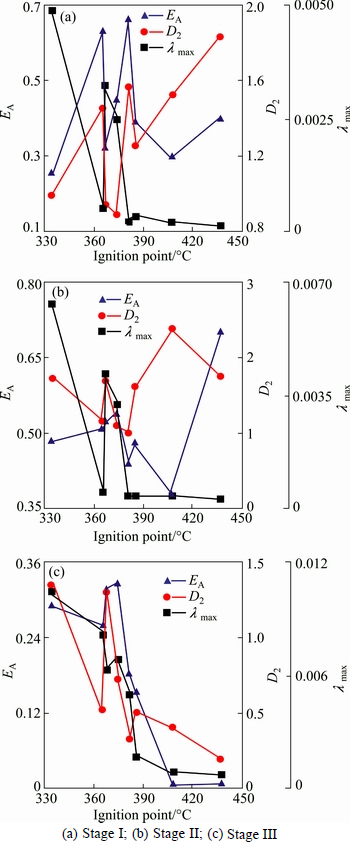
Fig. 10 Relationship between nonlinear parameters and ignition point:
The main purpose of the induced spontaneous combustion experiment of sulfide ores is to reveal the relationship between ore temperature and the ambient temperature of pot resistance furnace and determine the lowest ambient temperature that induces combustion of sulfide ores. Theoretically, as the ambient temperature rises, the effect of heat accumulation will be more significant. Under the positive feedback effect, the lowest ambient temperature can be acquired by experiment. But during the actual measurement process, temperature of ore samples often does not exceed the ambient temperature owing to the low heat liberation and other restrictive factors. Even though smoke emission of ore could be observed in the reactor, it is still hard to determine its ignition point, such as the ore sample 4. In addition, heating rate of the pot resistance furnace has a certain impact on the measurement results of the ignition point. For example, when heating rate is too high, ore temperature is generally lower than the ambient temperature. Accordingly, the spontaneous combustion curve usually has no crossing point. Even if the ignition point could be measured under this condition, it is often greater than the actual value. When heating rate is too low, ore might be completely oxidized at lower ambient temperatures. In this case, it is difficult to accurately measure the ignition point. Therefore, the reliability of the measured results in laboratory needs to be further verified.
From the view of nonlinear degree variation during the spontaneous combustion process, the ��max method to qualitatively evaluate the combustible tendency of sulfide ores was proposed in this work. The ��max value was extracted from all the measured temperature data of stage III, and the heating effect of pot resistance furnace was eliminated with the wavelet technology during the calculation process. Because spontaneous combustion of sulfide ores is a typical nonlinear evolution process, it is more objective to evaluate combustible tendency with the nonlinear method. Moreover, to our knowledge, this is a new evaluation method.
7 Conclusions
1) The measured results of spontaneous combustion process indicate that ignition points of all the ore samples are above 330 ��C, which means that sulfide ores of the pyrite mine are difficult to combust spontaneously under normal mining conditions. Spontaneous combustion process of ore samples includes three stages: incubation stage, development stage and approaching stage. The average temperature rising rates of the three stages are 1.0 ��C/min, 2.0 ��C/min and 4.2 ��C/min, respectively.
2) Mean values of approximate entropy and correlation dimension increase at first, and then decrease, but mean value of the maximum Lyapunov exponent increases with the reaction time. For the former two parameters, the minimum values appear at approaching stage.
3) Correlation variation between the three nonlinear parameters (approximate entropy, correlation dimension and maximum Lyapunov exponent) is very different during spontaneous combustion process. In a whole, correlation between the nonlinear parameters weakens at first, then enhances with the passage of reaction time, and the best correlation period is approaching stage. So, in order to explore the new evaluation method for combustible tendency of sulfide ores based on nonlinear multi-parameters fusion, nonlinear parameters of this stage should be extracted and adopted because of their high correlation with each other.
4) There is no significant correlation between nonlinear parameters and ignition point. But at approaching stage, maximum Lyapunov exponent decreases with the increase of ignition point. Thus, combustible tendency of sulfide ores could be qualitatively evaluated based on maximum Lyapunov exponent of this stage.
References
[1] WU C, LI Z J, LI M. Chemical thermodynamic mechanism of sulfide ores during oxidation and self-heating process [C]//Proceedings of the 2007 International Symposium on Mining Safety Science and Technology. Beijing: Science Press, 2007: 2435-2439.
[2] WANG H J, XU C S, WU A X, AI C M, LI X W, MIAO X X. Inhibition of spontaneous combustion of sulfide ores by thermopile sulfide oxidation [J]. Minerals Engineering, 2013, 49: 61-67.
[3] LI Zi-jun, SHI Dong-ping, WU Chao, WANG Xiao-lei. Infrared thermography for prediction of spontaneous combustion of sulfide ores [J]. Transactions of Nonferrous Metals Society of China, 2012, 22(12): 3095-3102.
[4] PAN W, LIAO J, WU C, LI Z J. Numerical simulation of self-heating and its influence factors of sulfide ore heap [C]//Proceedings of International Symposium on Rock Mechanics and Mine Dynamic Disaster Prevention. Beijing: China Coal Industry Publishing House, 2013: 221-227.
[5] YANG Fu-qiang, WU Chao, LI Zi-jun. Spontaneous combustion tendency of fresh and pre-oxidized sulfide ores [J]. Journal of Central South University, 2014, 21(2): 715-719.
[6] LIU Hui, WU Chao, SHI Ying. Locating method of fire source for spontaneous combustion of sulfide ores [J]. Journal of Central South University of Technology, 2011, 18(4): 1034-1040.
[7] LI Zi-jun, XU Zhi-guo, DENG Yan-xing. Parameter optimization of oxidation weight increase method for oxidability detection of sulfide ores at low temperature [J]. China Safety Science Journal, 2012, 22(6): 54-59. (in Chinese)
[8] PAN Wei, WU Chao, LI Zi-jun, YANG Yue-ping. Self-heating tendency evaluation of sulfide ores based on nonlinear multi-parameters fusion [J]. Transactions of Nonferrous Metals Society of China, 2015, 25(2): 582-589.
[9] YANG Fu-qiang, WU Chao, CUI Yan, LU Guang. Apparent activation energy for spontaneous combustion of sulfide concentrates in storage yard [J]. Transactions of Nonferrous Metals Society of China, 2011, 21(2): 395-401.
[10] LI Zi-jun, GU De-sheng, WU Chao. Dangerousness assessment of ore spontaneous combustion in high temperature high sulfide deposits [J]. Metal Mine, 2004(5): 57-59. (in Chinese)
[11] XIE Zheng-wen, WU Chao, LI Zi-jun, YANG Fu-qiang. Evaluation on spontaneous combustion tendency of sulfide ores based on entropy and set pair analysis theory [J]. Journal of Central South University: Science and Technology, 2012, 43(15): 1858-1863. (in Chinese)
[12] HU Han-hua, LIU Zheng, LI Zi-jun, CUI Tian-tian. Fisher discriminant analysis to the classification of spontaneous combustion tendency grade of sulphide ores [J]. Journal of China Coal Society, 2010, 35(10): 1674-1679. (in Chinese)
[13] SANG Yan-fang, WANG Dong. Wavelets selection method in hydrologic series wavelet analysis [J]. Journal of Hydraulic Engineering, 2008, 39(3): 295-300. (in Chinese)
[14] PINCUS S M. Approximate entropy as a measure of system complexity [J]. Proceeding of the National Academy Sciences USA, 1991, 88(6): 2297-2301.
[15] GRASSBERGER P, PROCACCIA I. Dimension and entropy of strange attractors from a fluctuating dynamic approach [J]. Physica D: Nonlinear Phenomena, 1984, 13: 34-54.
[16] ZHAO Jing, XU Jian-hua. Study on fractal characteristics of inundated area of flood disaster in China from 1950 to 1997 [J]. Journal of Natural Disasters, 2003, 12(1): 31-35. (in Chinese)
[17] YU Da-peng, ZHAO De-you, WANG Yu. Chaotic dynamics of propeller singing [J]. Acta Acustica. 2010, 35(5): 530-538. (in Chinese)
[18] MICHAEL T R, JAMES J C, CARLO J D L. A practical method for calculating largest lyapunov exponents from small data sets [J]. Physica D: Nonlinear Phenomena, 1993, 65(1/2): 117-134.
(Edited by DENG L��-xiang)
Foundation item: Projects(51304238, 51534008) supported by the National Natural Science Foundation of China; Project (2015CX005) supported by Innovation Driven Plan of Central South University, China
Received date: 2015-06-01; Accepted date: 2016-01-15
Corresponding author: PAN Wei, PhD; Tel: +86-13875801845; E-mail: panwei2012@csu.edu.cn
Abstract: To investigate the relationship between nonlinear parameters and spontaneous combustion tendency of sulfide ores, nine different sulfide ore samples were taken from a pyrite mine in China, and induced spontaneous combustion experiment was carried out in the laboratory. Different stages of the induced spontaneous combustion process were studied by integrating wavelet technology and nonlinear dynamics theory. The results show that ignition points of all the ore samples are above 330 ��C, indicating that sulfide ores of the pyrite mine are difficult to combust spontaneously under normal mining conditions. Spontaneous combustion process includes three stages: incubation stage, development stage and approaching stage. The average temperature rising rate of the three stages are 1.0 ��C/min, 2.0 ��C/min and 4.2 ��C/min, respectively. During the spontaneous combustion process, mean values of approximate entropy and correlation dimension increase at first, and then decrease in the following stage. The mean value of the maximum Lyapunov exponent increases with the passage of reaction time. In a whole, correlation among the three nonlinear parameters firstly weakens, then enhances, and the best correlation period is at approaching stage. As ignition point increases, the maximum Lyapunov exponent of approaching stage decreases. Therefore, combustible tendency of sulfide ores could be qualitatively evaluated based on the maximum Lyapunov exponent of this stage.
