
J. Cent. South Univ. (2012) 19: 897-902
DOI: 10.1007/s11771-012-1090-6![]()
Dissolution rate determination of alumina in
molten cryolite-based aluminum electrolyte
KAN Hong-min(�ۺ���), ZHANG Ning(����), WANG Xiao-yang(������)
Key Laboratory of Advanced Materials Technology of Liaoning Province, Shenyang University,Shenyang 110044, China
? Central South University Press and Springer-Verlag Berlin Heidelberg 2012
Abstract:
Determination of dissolution rate of alumina is one of the classical problems in aluminum electrolysis. A novel method which can measure the dissolution rate of alumina was presented. Effect of factors on dissolution rate of alumina was studied intuitively and roundly using transparent quartz electrobath and image analysis techniques. Images about dissolution process of alumina were taken at an interval of fixed time from transparent quartz electrobath of double rooms. Gabor wavelet transforms were used for extracting and describing the texture features of each image. After subsampling several times, the dissolution rate of alumina was computed using these texture features in local neighborhood of samples. Regression equation of the dissolution rate of alumina was obtained using these dissolution rates. Experiments show that the regression equation of the dissolution rate of alumina is y=-0.000 5x3+0.024 0x2-0.287 3x+ 1.276 7 for Na3AlF6-AlF3-Al2O3-CaF2-LiF- MgF2 system at 920 ��C.
Key words:
aluminum electrolyte; dissolution rate; image analysis; alumina; Gabor wavelet transform��
1 Introduction
It is important for aluminum production to know the dissolution performance and dissolution rate of alumina. When temperature of aluminum electrolysis is lowered, low alumina solubility and dissolution rate occur. Alumina can not be completely dissolved or quickly dissolved in molten cryolite. Alumina will deposit on the bottom, thus the physical and chemical processes and heat balance of the electrolysis cell are severely affected. It is one of the key issues for low temperature aluminum electrolysis to improve the dissolution performance of alumina and know the dissolution rate of alumina.
Many previous measurements of alumina solubility and dissolution performance of alumina have been conducted and significant progress has been made [1-3]. The solubility of alumina in molten Na3AlF6 containing various amounts of AlF3, CaF2, and LiF was determined by measuring the mass loss of a rotating sintered corundum disc. The empirical expression was given by SKYBAKMOEN et al [4]. GERLACH et al [5] studied the dissolution of alumina in cryolite melts. Al2O3 samples pressed to tablets were dissolved in cryolite melts. They discovered that the dissolution rate changed at an Al2O3 content of 5%-6% (mass fraction) in the cryolite melts and the alteration of the rate law may be explained by structural changes in the melts. WELCH and GERDA [6] studied crust and alumina powder dissolution in aluminum smelting electrolytes. ZHANG et al [7] measured the solubility of Al2O3 in basic cryolite melts experimentally for 3��r(cryolite ratio)��12.5 at 1 300 K. QIU et al developed transparent quartz electro- bath in 1985. Dissolution behavior of alumina can be observed more intuitively and roundly by transparent quartz electrobath. In recent years, research groups took the whole process of dissolution of alumina from transparent quartz electrobath and studied the dissolution behavior of alumina in molten cryolite. It is found that the dissolution process of alumina is divided into two stages: rapid dissolution and peeling off dissolution of alumina crusted with electrolyte. Besides, research groups analyzed the effect of factors on dissolution rate of alumina using transparent quartz electrobath and image analysis techniques, and co-occurrence matrix method was used to compute the texture features [8-13].
In this work, a novel method that can measure the dissolution rate of alumina is presented. The transparent quartz electrobath of double rooms and image analysis are used for aluminum electrolysis. The image sequence is obtained by taking from the transparent quartz electrobath of double rooms. Image analysis techniques are used to compute the change of alumina dissolution rate. Images about dissolution process of alumina are taken at an interval of fixed time from transparent quartz electrobath of double rooms. Gabor wavelet transforms are used for extracting and describing texture features of each image. After subsampling several times, the dissolution rate of alumina is computed using these texture features in local neighborhood of samples. Regression equation of the dissolution rate of alumina is obtained using the dissolution rate. The use of the transparent quartz electrobath can provide corresponding parameters for aluminum electrolysis industry, which will guide industrial production.
2 Computing dissolution rate of Al2O3 based on image sequence analysis
2.1 Factors and constraints
Here, the transparent quartz electrobath of double rooms is used for a container. Alumina powder is added into the transparent quartz electrobath. Factors of dissolution rate of Al2O3 are considered. Then, constraints used by the following algorithm are set. These factors are temperature of the transparent quartz electrobath, quality of Al2O3, rate at which Al2O3 is added, stirring, additives used and composition of additives. Although capacity of the transparent quartz electrobath does not affect the shape of dissolution rate varying curve of Al2O3, it affects the critical value of dissolution rate varying curve of Al2O3. Suppose that Vt denotes the capacity of the transparent quartz electrobath, Tt denotes the temperature of the transparent quartz electrobath, Qal denotes the quality of Al2O3, Val denotes the rate at which Al2O3 is added, ts denotes the time of stirring, Vs denotes the speed of stirring, Vad denotes the additives used, and Pad denotes the composition ratio of additives, then the factor set affecting dissolution rate of Al2O3 Sdis can be denoted as
Sdis={Vt, Tt, Qa, Va, ts, Vs, Vad, Pad} (1)
In this work, the method that computes the dissolution rate of Al2O3 is proposed based on image sequence analysis. Each element is set in the factor set Sdis. Image analysis and understanding are used for image sequence of Al2O3 which is taken from the transparent quartz electrobath. The dissolution rate varying curve of Al2O3 is developed. Then, the dissolution rate varying equation of Al2O3 is devloped. Here, the constraints for Sdis are set as follows. Suppose Vt=a, Tt=b, Qal=c, Val=d, ts=e, Vs=f, Vad=g, Pad=h, then the dissolution rate of Al2O3 Dal can be denoted as
Dal=D(a��b��c��d��e��f��g��h) (2)
where D denotes the dissolution rate function, operator ������ denotes dependence relation among constraints.
It should be noticed that the factor set Sdis can be extended dynamically and parameter value can be changed dynamically. This makes it possible that constraints can be changed by application.
2.2 Algorithm computing dissolution rate of Al2O3
Here, the image sequence of Al2O3 dissolution is taken from the transparent quartz electrobath. It can be found that each image contains a large amount of texture information. Our idea is as follows: First, the image sequence of Al2O3 dissolution is taken at a specific time interval. The image sequence is regarded as a point set where each point corresponds to an image at a specific time. Texture features of each image are used to characterize a point. Then, the similarity between neighboring points is used to describe dissolution rate variation of Al2O3, so that the dissolution rate varying curve of Al2O3 can be drawn. Then, approximation and interpolation techniques are used to establish the dissolution rate varying equation of Al2O3. Finally, dissolution rate of Al2O3 can be computed by the equation. The flowchart by which dissolution rate of Al2O3 can be computed based on image sequence analysis can refer to Fig. 1. The error of the method is caused mainly by sampling time and time interval of sampling.
2.2.1 Computing information region in Al2O3 dissolution image
Here, image sequence of Al2O3 dissolution is taken from the transparent quartz electrobath at a fixed time interval. Then, information region is computed in each image. It can be found in Fig. 2 that Al2O3 dissolution image contains three regions: information region (Al2O3 dissolution region, Fig. 2(a)), interference region (Transparent quartz electrobath region, Fig. 2(b)) and background region (Black region, Fig. 2(c)). As far as computation of Al2O3 dissolution rate is concerned, the information region is most important. Here, rectangle window, such as A and B, is used to compute the information region.
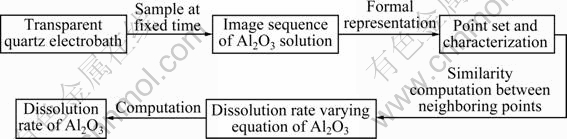
Fig. 1 Flowchart for computing dissolution rate of Al2O3 based on image sequence analysis
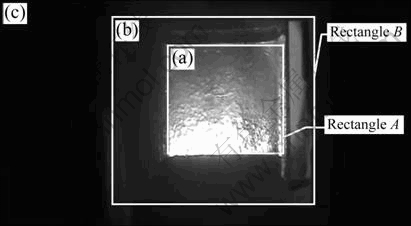
Fig. 2 Al2O3 dissolution image: (a) Information region; (b) Interference region; (c) Background region
When Al2O3 dissolution images are taken, the position of camera and distance from camera to the transparent quartz electrobath are relatively fixed. This means that the position and scale of a rectangle window can be decided in advance. Here, the point at the upper left corner is selected as a reference point. The scale of rectangle window A is A1 ? A2 and the position is (P1, P2). The scale of rectangle window B is B1 ? B2 and the position is (P3, P4).
Suppose that f(x, y) denotes an Al2O3 dissolution image of size M ? N. Equation (3) can be used to decide whether a point (x, y) is in information region:
P1�� x��P1+A1 and P2��y��P2+A2 (3)
Here, x=P1 and x=P1+A1 are left boundary and right boundary of the information region, respectively; y=P2 and y=P2+A2 are upper boundary and bottom boundary, respectively.
2.2.2 Extracting texture features from information region of Al2O3 dissolution image
It can be found in Fig. 2(a) that the information region of the Al2O3 dissolution image contains a large amount of texture. Here, texture features are used to characterize an image, and Gabor wavelet transform method [14-15] is used to compute the texture features.
First, image sequence is taken through the transparent quartz electrobath. Then, color images are transformed into gray images by gray-scale transformation. Suppose that f(x, y) denotes a gray image of Al2O3 dissolution of size M?N. The 2D discrete Gabor wavelet transform of f(x, y) can be denoted as
![]() (4)
(4)
where the parameters s and t are mask size variables of filter; the parameters x and y point out the position of a pixel in f(x, y); the parameters p and q are scale and orientation of wavelet transform, respectively, p=[0, 4] and q=[0, 5]; j*pq denotes complex conjugate of jpq. jpq is Gabor wavelet transform function and can be denoted as
jpq(x, y)=a-pj (x��, y��) (5)
where the parameter a is scale factor, and a>1. The parameters x�� and y�� can be respectively denoted as
x��=a-p(xcosq+ysinq) and y��=a-p(-xsinq+ycosq) (6)
where ��=q��/6.
Suppose that Gabor function is used as mother wavelet, then j(x, y) can be denoted as
![]() (7)
(7)
where the parameter W denotes the frequency bandwidth of Gabor wavelet. It was found from neurophysiological research results that Gabor wavelet where W=0.5 is consistent with human vision system approximately. The parameters ��x and ��y denote constants of Gaussian envelope along x axis and y axis, respectively.
Energy can be computed according to the results of 2D discrete Gabor wavelet transform. Suppose that E(p, q) denotes energy of scale p and orientation q, then E(p, q) can be denoted as
![]() (8)
(8)
Energy can describe texture features effectively, but energy can also lead to classification error easily. So, mean and standard deviation are usually used as texture features. Suppose that ��(p, q) denotes mean and ��(p, q) denotes standard deviation, then ��(p, q) and ��(p, q) can be respectively denoted as
![]() (9)
(9)
 (10)
(10)
Suppose that T denotes a texture feature vector of f(x, y), then T can be denoted as
T=[m00, s00, m01, s01, ��, mP-1, Q-1, sP-1, Q-1] (11)
2.2.3 Determination of dissolution rate equation of Al2O3
Here, the dissolution rate equation of Al2O3 will be computed. After image sequence of Al2O3 dissolution is drawn from the transparent quartz electrobath at a fixed time interval, the images can be regarded as an ordered point set. Furthermore, texture feature vectors can be used to characterize a point, as shown in Fig. 3.
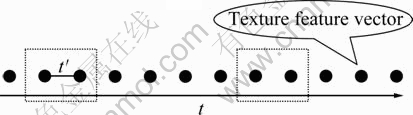
Fig. 3 Image sequence of Al2O3 dissolution
In Fig. 3, t�� denotes time interval between points in the ordered point set. If t�� is sufficiently small, then it can be thought that dissolution rate of Al2O3 can be changed at a fixed rate at t�� time interval.
Our idea is to use the similarity between texture feature vectors of two image points to describe dissolution rate variation of Al2O3. If t�� is sufficiently small, then dissolution rate of Al2O3 can be denoted as quotient between similarity and t��.
Suppose that Euclidean distance is used as similarity measure, then similarity between texture feature vectors of two image points can be denoted as
![]() (12)
(12)
where Tt1 and Tt2 denote the texture feature vectors of two image points at t�� time interval in the ordered point set, respectively. The dissolution rate of Al2O3, Dal, can be denoted as
Dal=S(Tt1, Tt2)/t�� (13)
Suppose that image point set of Al2O3 dissolution consists of n elements. The k resampling is carried out for image sequence of Al2O3 dissolution in Fig. 3. The information can be regarded as a sample in the dashed box. Then, Eqs. (12) and (13) are used to compute dissolution rate of Al2O3, so that the dissolution rate varying point set of Al2O3 can be drawn. The polynomial approximation is used for the point set to compute dissolution rate varying equation of Al2O3. Finally, the dissolution rate of any time can be computed by initial value of dissolution rate and dissolution rate varying equation of Al2O3.
3 Experiments and analyses
3.1 Image sampling
In this work, dissolution rate of alumina is studied. The electrolyte system is Na3AlF6-AlF3-Al2O3-CaF2-LiF- MgF2. The liquidus temperature is about 920 ��C. The dissolution of alumina is observed in the system by the transparent quartz electrobath of double rooms. An image about the dissolution of alumina is shown in Fig. 4 [16]. The behavior about the dissolution of alumina is as follows in the electrolyte: the agglomeration of alumina is formed and floats on the top of the electrolyte; then the agglomeration of alumina sinks in the electrolyte after wetting and is dissolved at the bottom of the electrobath; finally, the agglomeration is dissolved completely.
3.2 Establishing equation about dissolution rate of alumina
To compute the varying curves of dissolution rate about alumina in cryolite molten salt, a prototype system is designed by the above approach and compiled by Java.
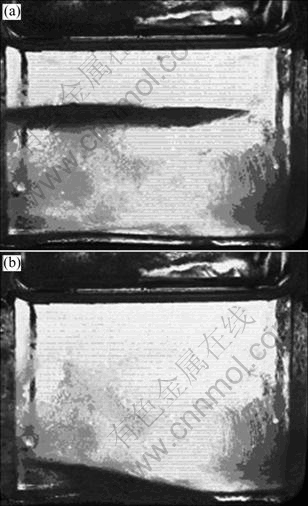
Fig. 4 Dissolution images of alumina: (a) Initial stage; (b) Final stage
The configuration of the computer for test is Intel(R) Celeron(R) mainboard, 1.60 GHz CPU main frequency and 256 MB memory. Test result for alumina is shown in Fig. 5.
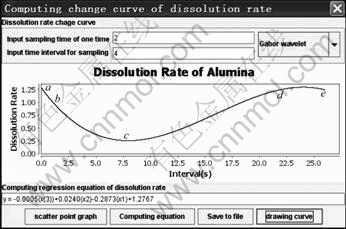
Fig. 5 Dissolution rate varying curve of alumina
The value in the first textbox is sampling time, and described by the number of image points in sampling. The result computed by the value minus 1 and multiply sampling time of image sequence is t�� in Fig. 3. The value in the second textbox is time interval of sampling which refers to time interval between two sampling, and described by the number of image points.
Here, the dissolution of alumina is sampled at a fixed time interval of 4 s.
When the value is 2 in the first textbox and the value is 4 in the second textbox, the dissolution rate varying curve is shown in Fig. 5 for alumina.
The equation about the dissolution rate of alumina is
y=-0.000 5x3+0.024 0x2-0.287 3x+1.276 7 (14)
where x denotes the time of subsamples, y is the dissolution rate of alumina at x which is computed by the method.
Figure 5 shows that the first dissolution rate of alumina is very fast (a-b). It gradually slows down and becomes stable (b-c). The dissolution rate of alumina increases gradually (c-d). After a period of stable dissolution rate of alumina, it begins to decline (d-e). This shows that alumina approaches to saturation in the aluminum electrolytic cell at this time. This process is fully in line with the phenomenon from a transparent quartz electrobath.
3.3 Analysis about dissolution rate variation of alumina
First, the dissolution rate of alumina is very fast (a-b). When the alumina is added into electrobath, a chemical reaction occurs between alumina and the component of the molten. Intermediate activator is formed. Then, alumina crystals dissolve.
The dissolution rate of alumina gradually slows down and becomes stable (b-c). When the cool alumina is added into the high temperature electrobath, molten cryolite particles will penetrate the pores of Al2O3. Then, heat exchanges between alumina and the molten rapidly. The temperature of the electrolyte around alumina drops. Condensate electrolyte and Al2O3 are bonded together and form a mass of alumina and electrolyte. This decreases contact area between Al2O3 and electrolyte, so that the erosion chance of Al2O3 crystals by fluoride ion is reduced.
Dissolution rate of alumina increases gradually (c-d). Agglomeration disappears after the temperature balance. At this moment, Al2O3 continues to be eroded by fluoride ion and the chemical reaction occurs between alumina and the component of the molten. So, the dissolution rate of alumina increases.
After a period of stable dissolution rate of alumina, it begins to decline (d-e). This shows that alumina approaches to saturation in the aluminum electrolytic cell at this time.
The above analysis shows that, in order to improve the dissolution rate of alumina, the opportunities of the agglomeration formation of alumina and electrolyte should be reduced and the specific surface area of alumina should be increased. Effective measures are as follows:
1) Stirring alumina to dissolve, rather than settling on the bottom.
2) Slowly adding alumina to prevent significant temperature changes in electrolyte and to form high concentration fluoride ion around alumina crystals.
3) Preheating alumina to avoid the agglomeration formation of alumina and electrolyte.
4) Using of additives to increase the concentration of fluoride ion.
5) Improving the quality of alumina to increase the specific surface area of alumina.
4 Conclusions
1) A novel method that can measure dissolution rate of alumina is proposed. The method can analyze the effect of factors on dissolution rate of alumina intuitively and roundly by transparent quartz electrobath and image analysis techniques. Image analysis techniques are used to compute the dissolution rate of alumina. The dissolution rate equation of alumina is established based on the above method:
y=-0.000 5x3+0.024 0x2-0.287 3x+1.276 7
2) The dissolution rate equation of alumina is susceptible to stirring rate, preheating temperature of alumina and kind of alumina.
Acknowledgements
The authors wound like to thank Professor WANG Zhao-wen and Dr. HU Xian-wei of Northeastern University for their help.
References
[1] SOLHEIM A, ROLSETH S, SKYBAKMOEN E. Liquidus temperature and alumina solubility in the system Na3AlF6-AlF3-LiF-CaF2-MgF2 [C]// Light Metals 1995. Warrendale: Minerals, Metals & Materials Soc, 1995: 451-456.
[2] KELLER R. Alumina dissolution and sludge formation revisited [C]// Light Metals 2005, Warrendale: Minerals, Metals & Materials Soc, 2005: 147-150.
[3] HAVERKAMP R G, WELCH B J. Modelling the dissolution of alumina power in cryolite [J]. Chemical Engineering and Processing, 1998, 37: 177-187.
[4] SKYBAKMOEN E, SOLHEIM A, STERTEN A. Alumina solubility in molten salt systems of interest for aluminum electrolysis and related phase diagram data [J]. Metallurgical and Materials Transactions B, 1997, 28B(2): 81-86.
[5] GERLACH J, HENNIG U, KERN K. The dissolution of aluminum oxide in cryolite melts [J]. Metallurgical Transactions B, 1975, 6B(3): 83-86.
[6] WELCH B J, GERDA I K. Crust and alumina powder dissolution in aluminum smelting electrolytes [J]. JOM, 2007, 59(5): 50-54.
[7] ZHANG Y S, WU X X, ROBERT A R. Solubility of alumina in cryolite melts: Measurements and modeling at 1 300 K [J]. Metallurgical and Materials Transactions B, 2003, 34 B(4): 235-242.
[8] YANG Zhen-hai, GAO Bing-liang, XU Ning, QIU Zhu-xian, LIU Yao-kuan. Dissolution of alumina in molten cryolite: A video recording study [J]. Journal of Northeastern University: Natural Science, 1999, 20(4): 398-400. (in Chinese)
[9] XU Jun-li, SHI Zhong-ning, GAO Bing-liang, QIU Zhu-xian. Dissolution of alumina in molten cryolite [J]. Journal of Northeastern University: Natural Science, 2003, 24(9): 832-834. (in Chinese)
[10] QIU Zhu-xian, WANG Zhao-wen, GAO Bing-liang, YU Xu-guang. Physical and chemical processes of low temperature aluminum electrolysis [J]. Mining Research and Development, 2003, 8: 9-12. (in Chinese)
[11] FAN Li-man, QIU Zhu-xian, GRJOTHEIM K. A direct observation of the process of aluminium in cryolite-alumina electrolyte through a transparent quartz cell [J]. Journal of Northeastern University, 1986, 46(1): 97-106. (in Chinese)
[12] XU Jun-li, SHI Zhong-ning, GAO Bing-liang, QIU Zhu-xian. Bubble behavior on metal anode of aluminum electrolysis [J]. The Chinese Journal of Nonferrous Metals, 2004, 14(2): 298-301. (in Chinese)
[13] KAN Hong-min, ZHANG Ning, WANG Xiao-yang. Study on solution of Al2O3 in low temperature aluminum electrolyte [C]// Light Metals 2011, Warrendale: Minerals, Metals & Materials Soc, 2011: 503-507.
[14] ZHANG Gang, MA Z M, DENG Li-guo, XU Chang-ming. Novel histogram descriptor for global feature extraction and description [J]. Journal of Central South University of Technology, 2010, 17(3): 580-586.
[15] MA Z M, ZHANG Gang, YAN Li. Shape feature descriptor using modified Zernike moments [J]. Pattern Analysis and Applications, 2011, 14(1): 9-22.
[16] YANG You-jian, WANG Zhao-wen, FU Wei-qin, GAO Bing-liang, HU Xian-wei, YU Ya-xin, LIU Ying-le. Dissolution behavior of alumina in molten aluminum electrolyte [C]// World Non-Grid- Connected Wind Power and Energy Conference (WNWEC). Nanjing: INSPEC, 2010: 1-6.
(Edited by HE Yun-bin)
Foundation item: Projects(51101104, 51072121) supported by the National Natural Science Foundation of China; Project(LS2010109) supported by the Key Laboratory Foundation of Liaoning Province, China
Received date: 2011-05-03; Accepted date: 2011-10-15
Corresponding author: KAN Hong-min, PhD; Tel: +86-24-62268751; E-mail: kanhongmin2002@163.com
Abstract: Determination of dissolution rate of alumina is one of the classical problems in aluminum electrolysis. A novel method which can measure the dissolution rate of alumina was presented. Effect of factors on dissolution rate of alumina was studied intuitively and roundly using transparent quartz electrobath and image analysis techniques. Images about dissolution process of alumina were taken at an interval of fixed time from transparent quartz electrobath of double rooms. Gabor wavelet transforms were used for extracting and describing the texture features of each image. After subsampling several times, the dissolution rate of alumina was computed using these texture features in local neighborhood of samples. Regression equation of the dissolution rate of alumina was obtained using these dissolution rates. Experiments show that the regression equation of the dissolution rate of alumina is y=-0.000 5x3+0.024 0x2-0.287 3x+ 1.276 7 for Na3AlF6-AlF3-Al2O3-CaF2-LiF- MgF2 system at 920 ��C.
