

Preparation of tin-oxide nanotubes as anode for Li-ion batteries
WANG Jian-hua (������), ZHANG Li-hua(������), CHEN Dong-hua(�¶���), GUO Yu-zhong(������)
Key Laboratory of Advanced Material of Yunnan Province, Kunming University of Science and Technology,
Kunming 650093, China
Received 15 July 2007; accepted 10 September 2007
Abstract:
The influence of nanostructure on the electrochemical properties of Li-ion battery was investigated. Tin-oxide nanotubes were prepared by combining sol-gel method with polycarbonate template. Scanning electron microscopy and X-ray diffractometry were applied to characterize the obtained material. The electrochemical measurements were conducted on the nanostructured tin-oxides as electrode of Li-ion batteries. The XRD data indicate that the wall of tube is composed of cassiterite crystals of several nanometers. The electrochemical measurements show that the reaction under potential 0.1-0.2 V is possibly related to the tubular structure of the material. It is suggested that the trapping of Li by dangling bonds and defects sites also contributes to the larger irreversible capacity loss in the first discharge.
Key words:
lithium ion battery; nano-tube; tin-oxide; template;
1 Introduction
Tin-based materials have been of considerable interest because, in principle, they can store over twice as much Li as graphite. However, large volume changes occur when Li is inserted and removed from these Sn-based materials. It causes internal damage to the electrode, resulting in loss of capacity and recharge ability[1]. Electrodes composed of smaller particles show better capacity retain ability. In addition, nano particles provide large surface areas, resulting in low current density and a decrease of concentration polarization. The Li diffusing distance is correspondingly shorter, bringing the significant advantage of increasing rate capacity[2-3]. But, fine-grained materials have drawback in practical applications. The transition of electrons between particles becomes difficult after cycling[2]. Therefore, it is necessary to assemble the fine particles into continuous structure.
Template-based approach is useful way to produce nanostructures. Corresponding cylindrical nanostructures of the desired materials are deposited within the pores in template by sol-gel or electrophoretic deposition. Some nanostructured materials have been used as electrodes in Li-ion batteries, such as V2O5[4-5], LiNiO2[6] and SnO2[7-8]. Electrochemical tests indicated a better recharge ability and rate capacities than conventional electrodes composed of the same materials[7,9-10].
Further studies are still necessary for better understanding of electrochemical behavior of these nanostructures. In this study, tin-oxide nanotubes are prepared by using polycarbonate membrane as template, and combining with sol-gel deposition. Electrochemical studies are carried out on these nanostructured materials.
2 Experimental
2.1 Fabrication of SnO2 nanotubes
The template membranes were commercially available polycarbonate(PC) filters from Whatman. Membranes with pore diameter of 50, 200 and 400 nm were selected. The characteristics of the membranes are listed in Table 1. SnCl2?2H2O(AR) and ethanol(AR) were used as starting precursors for preparation of sol. Tin chloride was dissolved into ethanol to yield a 3 mol/L solution. A transparent sol was obtained after aging the solution for 12 h at room temperature. A piece of PC template membrane was immersed into the sol for 12 h and then, put on a piece of Pt foil (15 mm��15 mm��
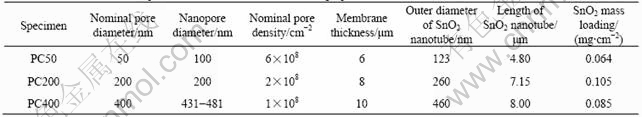
Table 1 Characteristics of template membranes and SnO2 nanotube prepared from membrane
0.1 mm, 99.99%). The Pt foil was used as current collector of anode. The surface layer can be diminished by dipping membrane into distilled water quickly[7]. The specimen was dried at 80 �� for more than 24 h to evaporate solvent. It was then placed in a furnace and the temperature was increased to 500 �� at a heating rate of 5 ��/h. The template was removed in heating process. Tin-oxide nanotube arrays were formed on Pt foil.
2.2 Characterization
Scanning electron microscopy(SEM) images were taken on a Philips XL30 ESEM system by attaching the Pt foil that was covered with the SnO2 nanotubes to a stub. The composition of nanotubes was determined by energy dispersive spectra(EDS) system from EDAX Phoenix. The crystal structures of nanotubes were characterized by a D/max 2200 X-ray diffractometer. The crystal sizes were calculated using software based on Scherrer formula.
The mass of the SnO2 nanotubes was obtained via inductively coupled plasma(ICP) atomic emission analysis, using an ICPS-1000II analyzer from Shimadzu. It was accomplished by dissolving the nanotubes in 1 mol/L HCl aqueous solution, and determining the Sn2+ concentration of the resulting solution. The mass of the SnO2 was calculated from the concentration of Sn2+ in the solution.
2.3 Electrochemical test
The nanostructured SnO2 on Pt foil was used, without further treatment, as electrode in Li-ion battery. Coin-type test cells were constructed using these electrodes in a 2032 coin-cell hardware. The cells used a polypropylene microporous separator from Entek, and an electrolyte of 1 mol/L LiPF6 dissolved in 1?1 (volume ratio) mixture of ethylene carbonate(EC) and dimethyl carbonate(DMC). A piece of lithium foil (0.1 mm in thickness, 13 mm in diameter) was used as counter electrode. Cells were assembled in an argon-filled glove box. All cells were tested with a constant current of 1.35 mA/cm2 on PCBT138-8D battery test system from Lixin Co.
Differential specific capacities, dq/(mdV), were calculated from adjacent points in the voltage��time data using the known value of the current, I, and the active electrode mass, m, as follows:
![]() (1)
(1)
3 Results and discussion
3.1 Characterization of prepared materials
Fig.1 shows the typical SEM images of template synthesized SnO2 nanotubes standing freely on the Pt substrate. The clusters of SnO2 tubes can be obtained in large area. The formation of hollow tubes can be clearly seen in Fig.1(b). The diameter and length of tubes prepared by different membrane are listed in Table 1. The outer diameters of tubes measured by SEM image agree with the diameter of pores in the template membrane. The length of tube arrays matches well the thickness of membrane, indicating that tubes form across the complete thickness of the membrane. The wall thickness of tubes can be measured by SEM image when membrane with large pore diameter is applied. The value of 50 nm was obtained for specimen PC400. The mass of SnO2 loading on Pt substrate was measured by ICP, as listed in Table 1. The values agree with data in Ref.[7], measured by same method.
The compositions of the tubular materials were analyzed with EDS (Fig.2). Except Pt from substrate, only tin and oxygen are detected when the material is heated at 500 ��. The mole ratio of Sn to O is about 1?2. Specimens heated at different temperatures were also analyzed with EDS. The removal of carbon in the heating process is clearly shown in Fig.3. X-ray diffractometry was applied to tubular material stood on Pt foil. Sample was heated at 500 �� for 1 h. The widening peaks in Fig.4 imply that the wall of tube is constructed of ultra fine crystals (cassiterite, PDF No.41-1445). The calculated crystal size based on Scherrer formula is less than 10 nm. The two strong peaks in XRD pattern come from Pt.
3.2 Electrochemical measurements
Constant-current charge/discharge experiments
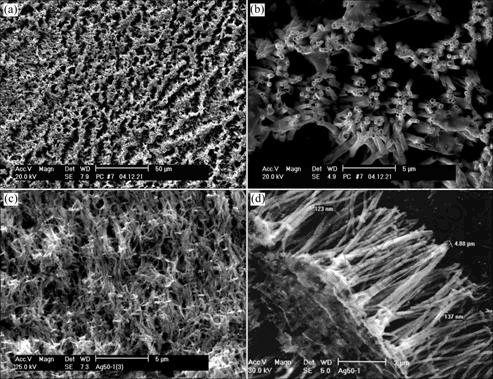
Fig.1 SEM images of tin-oxide tube arrays standing freely on substrate: (a) Sample PC400 in low magnification; (b) Sample PC400 in higher magnification; (c) Sample PC50 viewed from top; (d) Sample PC50 viewed from side
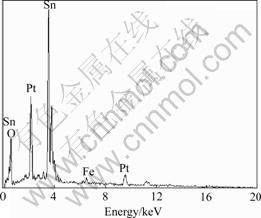
Fig.2 EDS spectrum of SnO2 tubes on Pt substrate (sample is heated at 500 ��)
were conducted in the potential window between 0.1 V and 1.3 V. The voltage profiles for the first, the second, 10th and 30th cycle of the PC200 are shown in Fig.5. The first discharge to 0.1 V shows a large irreversible capacity. The calculated first discharge capacity based on the formation of Li2O and alloy is 1491 mA?h?g-1, but the observed first discharge capacity reaches 1 923 mA?h?g-1. The plateau around 0.8 V corresponds to a phase transformation of SnO2 to Sn and Li2O[1,11]. The lithium cannot be removed from the Li2O in charge, causing irreversible capacity. The formation of the SEI
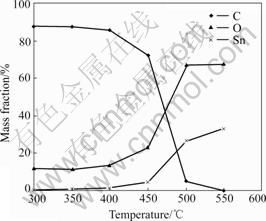
Fig.3 Chemical composition of tubular materials depending on heating temperature measured by EDS
film also leads to irreversible capacity loss[12]. Compared to traditional electrode, more SEI film can be formed because of large surface area of nano material, which results in more irreversible capacity loss.
Another possible reason for larger irreversible capacity loss is related to the trapping of Li. The retention of Li atoms within the lattice of nano-Si was observed by HRTEM[13]. JAMNIK et al[14] believed that some atoms, like dangling bonds and defects sites, have the unusual bonding ability to Li ions. Once the Li ions are trapped, it may be very difficult to extract them.
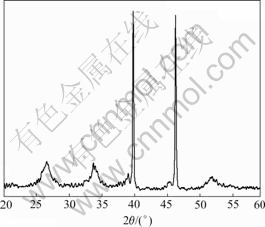
Fig.4 XRD pattern of SnO2 nanotube on Pt substrate (sample is heated at 500 ��)
There would be amounts of dangling bonds and defects sites in our nanostructured SnO2 material. We assume that the dangling bonds and defects sites also contribute to irreversible capacity loss. Further work should be done to confirm this suggestion.
Differential specific capacity, dq/(m dV) is a useful value to give information of electrochemical reaction

Fig.5 Cell voltage vs capacity for nanostructured SnO2 (pore diameter is 200 nm)
potential. Fig.6 shows the differential capacity plot at the first, the second, 10th and 30th cycles for the PC200. Two groups of primary reduction peaks are seen on the first discharge curves, one centers at 0.8 V and the other at 0.1-0.2 V. The reduction of SnO2 to Sn takes place at peak around 0.8 V. It disappears on the curves of the second and the later discharges. LI and MARTIN[7]
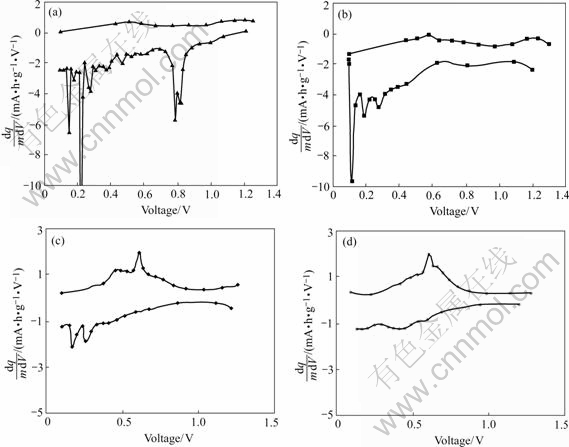
Fig.6 Curves of differential capacity vs voltage for sample PC200 cycled between 0.1 and 1.3 V: (a) 1st cycle; (b) 2nd cycle; (c) 10th cycle; (d) 30th cycle
observed that the reduction of SnO2 to Sn occurs in two distinct stages: the reduction of SnO2 to SnO and subsequent reduction of SnO to Sn. The two separate peaks near 0.8 V on the first discharge curve (Fig.6) correspond to these two separate reduction processes. The reason why two distinct peaks are seen in this study has to do with the large surface area of the anode material.
No apparent peak at 0.1-0.2 V has been reported on SnO2. We can seen them on the dq/(m dV) curves of the first few cycles. There may be related with the tubular structure. Researches show that structures like nanopore or nanotube have the ability of storing lithium[15-16]. DAHN et al[17] proposed a model called ��falling of cards�� for description of storage of Li in hard carbon. The inserting of Li into pole in hard carbon takes place around potential of 0 V, and extracting of these Li usually happens at higher potential. Therefore it is reasonable to attribute the electrochemical reaction at around 0.1-0.2 V to the inserting of Li+ inside tubes.
The peaks between 0.2-0.7 V correspond to the subsequent alloying of Sn to Li. The oxidation peaks centered at 0.6 V associate with the de-alloying process. These peaks provide the reversible capacity for SnO2 anode[1,7,11].
Fig.7 shows the plots of the discharge capacity vs number of cycles for tubular SnO2 electrodes with different diameters. The influence of tube diameter on the cycling performance can be seen. For sample PC200, 80% of capacity remains after 50 cycles. The capacity of sample PC400 drops quickly after 30th cycles.
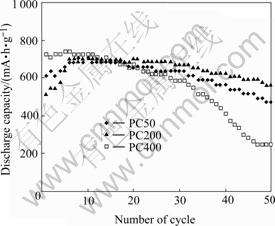
Fig.7 Plots of electrode discharge capacity as function of cycle number
The capacities for PC200 and PC50 initially increase with cycle number increasing in the first few cycles. This phenomenon has only been seen for electrode with nanostructured materials[7]. LI et al attributed it to the increasing of surface area. We suggest other possible explanation here. It is believed that electrochemical reaction takes place on both outside and inside surfaces of the tubular material. Usually Li+ ions insert from the open end of tube other than diffuse from side surface of a tube. The speed of inserting is controlled by the inner diameter of tube and Li concentration inside tube. Li+ ions diffuse easily into tube in the first few cycles because of the low Li+ concentration inside tube. But the amount of Li+ diffuse into the tube in each cycle process is more than those diffuse out. They are trapped in the tube because the inner pore of tube is too small. The Li+ concentration inside tube amounts to high level after several cycles. The diffusing reaches equilibrium after six cycles, which can be seen on Fig.7. The reason that sample PC400 reaches the equilibrium at the first cycles can be attributed to its larger pore diameter.
4 Conclusions
1) Tin-oxide nanotube arrays were successfully prepared by combining sol-gel method with polycarbonate template. Assembling the fine particles into continuous structure may bring out advantages and, at the same time, some new problems. The electrochemical behavior of the nanostructures is different from that of traditional materials.
2) Electrochemical reactions of these nanostructured materials take place at almost the same potential as traditional one, but apparent peaks at 0.1-0.2 V are found on differential specific capacity graph. The electrochemical reactions around 0.1-0.2 V are attributed to the inserting of Li+ inside tubes. In the first few cycles Li ions diffuse into the tube and some of them are trapped inside the tubes. It causes larger irreversible capacity loss. Except the formation of Li2O and the SEI film, large irreversible capacity loss can be attributed to trapping of Li ion, including by tube or dangling bonds or defects sites.
3) The diameter of tubes controls the cycling performance. Sample with pore diameter of 200 nm shows better capacity retain ability in 50 cycles.
References[1] COURTNEY I A, DAHN J R, Electrochemical and in situ X-ray diffraction studies of the reaction of lithium with tin oxide composites [J]. J Electrochem Soc, 1997, 144(6): 2045-2052.
[2] BOSE A C, KALPANA D, THANGADURAI P, RAMASAMY S. Synthesis and characterization of nanocrystalline SnO2 and fabrication of lithium cell using nano-SnO2 [J]. J Power Sources, 2002, 107: 138-141.
[3] LI Hong, SHI Li-hong, LIU Wei, HUANG Xue-jie, CHEN Li-quan. Studies on capacity loss and capacity fading of nanosized SnSb alloy anode for Li-ion batteries [J]. J Electrchem Soc, 2001, 148(8): A915-912.
[4] PATRISSI C J, MARTIN C R. Sol-gel based template synthesis and Li-insertion rate performance of nanostructured vanadium pentoxide [J]. J Electrchem Soc, 1999, 146(9): 3176-3180.
[5] KIM K T, KIM M J, CHO S. Pulsed electrodeposition of palladium nanowire arrays using AAO template [J]. Materials Chem and Phys, 2006, 96: 278-282.
[6] ZHOU Ying-ke, HUANG Ji-er, SHEN Cheng-min, LI Hu-lin. Synthesis of highly ordered LiNiO2 nanowire arrays in AAO templates and their structural properties [J]. Mater Sci Eng A, 2002, 335: 260-267.
[7] LI Nai-chao, MARTIN C R. A high rate, high capacity, nanostructured Sn-based anode prepared using sol-gel template synthesis [J]. J Electrchem Soc, 2001, 148(2): A164-A170.
[8] ZHU Wei, WANG Wen-zhong, XU Hao-lan, SHI Jian-lin. Fabrication of ordered SnO2 nanotube arrays via a template route [J]. Materials Chem Phys, 2006, 99: 127-130.
[9] TABERNA P L, MITRA S, POIZOT P, SIMON P. High rate capabilities Fe3O4-based Cu nano-architectured electrodes for lithium-ion battery applications [J]. Nature Material, 2006(5): 567-573.
[10] WANG Y, LEE J Y, ZENG H C. Polycrystalline SnO2 nanotubes prepared via infiltration casting of nanocrystallites and their electrochemical application [J]. Chem Mater, 2005, 17: 3899-3903.
[11] HUGGINS R A. Lithium alloy negative electrodes [J]. J Power Sources, 1999, 81/82: 13-19.
[12] LI Jing-ze, LI Hong, WANG Zhao-xiang, HUANG Xue-jie, CHEN Li-quan. The interaction between SnO anode and electrolytes [J]. J Power Sources, 1999, 81/82: 346.
[13] LI Hong, SHI Li-hong, LIU Wei, HUANG Xue-jie, CHEN Li-quan. The crystal structural evolution of nano-Si anode caused by lithium insertion and extraction at room temperature [J]. Solid State Ionics, 2000, 181: 135-137.
[14] JAMNIK J, MAIER J. Nanocrystallinity effects in lithium battery materials Aspects of nano-ionics [J]. Phys Chem Chem Phys, 2003, 5: 5215-5220.
[15] DOMINKO R, ARCON D, MRZEL A, ZARKO A. Dichalcogenide nanotube electrodes for Li-ion batteries [J]. Advanced Materials, 2002, 14: 1531-1534.
[16] MEUNIER V, KEPHART J, ROLAND C, BERNHOLC J. Ab intio investigations of lithium diffusion in carbon nanotube systems [J]. Phys Rev Lett, 2002, 88: 075506.
[17] DAHN J R, XING W, GAO Y. The falling cards model for the structure of microporous carbons [J]. Carbon, 1997, 35: 825-831.
Foundation item: Project(203630002) supported by the National Natural Science Foundation of China
Corresponding author: WANG Jian-hua; Tel: +86-871-5334185; E-mail: wjianna@hotmail.com
