
J. Cent. South Univ. (2012) 19: 2373-2379
DOI: 10.1007/s11771-012-1284-y![]()
Using acoustic technique to detect leakage in city gas pipelines
CHEN Zhi-gang(��־��), LIAN Xiang-jiao(�����), HE Liang(����)
Beijing Engineering Research Center of Monitoring for Construction Safety,
Beijing University of Civil Engineering and Architecture, Beijing 100044, China
? Central South University Press and Springer-Verlag Berlin Heidelberg 2012
Abstract:
For solving the difficult problem of leakage detection in city gas pipelines, a method using acoustic technique based on instantaneous energy (IE) distribution and correlation analysis was proposed. Firstly, the basic theory of leakage detection and location was introduced. Then the physical relationship between instantaneous energy and structural state variation of a system was analyzed theoretically. With HILBERT-HUANG transformation (HHT), the instantaneous energy distribution feature of an unstable acoustic signal was obtained. According to the relative contribution method of the instantaneous energy, the noise in signal was eliminated effectively. Furthermore, in order to judge the leakage, the typical characteristic of the instantaneous energy of signal in the input and output end was discussed using correlative analysis. A number of experiments were carried out to classify the leakage from normal operations, and the results show that the leakages are successfully detected and the average recognition rate reaches 93.3% among three group samples. It is shown that the method using acoustic technique with IED and correlative analysis is effective and it may be referred in other pipelines.
Key words:
1 Introduction
Natural gas pipelines are important parts of city infrastructures. On one hand, it gives supplies for the city��s economic development and people��s daily life, but on the other hand it also brings a certain threat to public safety. In recent years, there have been some reports about the fire and explosion caused by gas leakage in cities. The disaster caused huge losses for people��s lives and property. In order to avoid these incidents, some measures should be taken to strengthen the safety management for city gas pipelines. So, leakage monitoring steps should also be taken. Once leakage occurs, it can be detected soon and effective measures can be taken as quickly as possible to avoid worse consequences. There are some methods for pipeline leakage detection, such as negative pressure wave, fiber detection, SPRT, neural network, wavelet analysis and information fusion. In the field of leakage detection, a lot of researches focus on negative pressure wave method which is sound in theory and has been applied in many oil pipelines [1]. But in gas pipelines, the fluctuation of pressure wave is significant and there is a lot of noise, so the effect of negative pressure wave in gas pipelines is not very ideal. Recently, many researches have been published on the use of fiber optic distributed sensing for the detection and location and some results also show its effectiveness [2]. But the fiber method can only be used in strict environment with little interference and noise. LAURENTYS et al [3] proposed an expert system to solve the difficulty of leakage feature identification with much interference and normal operations. Other intelligent methods, such as SPRT, neural network and wavelet analysis, are used in this situation, and they have to be based on much known information of leakage and others [4]. Now, the studies related to leakage in city gas pipelines are rare, and these methods cannot be used with little information because of the complexity of different cities.
It is known that city gas pipelines is different from the oil pipelines and long gas pipelines because of the compressibility of gas, peculiarity of city pipelines and complex urban environments [5]. The characteristic of signal caused by leakage is different from that in oil pipelines and long gas pipelines and it has some differences in time domain and frequency domain. The signal is often overwhelmed by the complex noise, the SNR is low and the characteristic of the signal is not obvious. As mentioned above, most traditional methods are short of detectability to leakage signal in city gas pipelines and it is difficult to extract singularity of feature wave and locate the leakage point.
In this work, the acoustic technique with instantaneous energy distribution and correlative analysis were used to identify leakage in city gas pipelines. Firstly, the basic theory of leakage detection and location was introduced. Secondly, the physical relationship between instantaneous energy and structural state variation of a system was analyzed theoretically. With HHT, the instantaneous energy distribution of an unstable pressure signal was obtained, and according to the relative contribution method of the instantaneous energy, its noise was eliminated. Furthermore, the leakage detection model with instantaneous energy distribution was established, and with correlation analysis, the correlation coefficients of instantaneous energy distribution characteristics were computed. Finally, the method and model were tested in field experiment samples and some results and conclusions were obtained.
2 Leakage detection using acoustics
When crack occurs in a gas pipeline, the huge pressure difference between inside and outside will make a sudden escape of gas and generate a pressure wave propagating both upstream and downstream in the pipeline with a constantly changing velocity. After some time the signals will be received by acoustic signal sensors installed at the both ends of the pipeline. By appropriate signal processing and analysis, it is possible to determine whether there is a leak along the pipeline or not, and locate the leakage position according to the acoustic wave velocity and the time difference [6]. The schematic diagram is shown in Fig. 1.
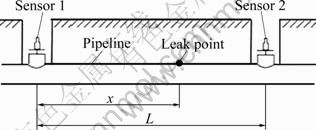
Fig. 1 Schematic diagram of detection method
Assuming that the time accepted by sensors in the pipeline ends is t1 and t2, respectively, the velocity of acoustic wave in the pipeline is v, the flow velocity of fluid in the pipeline is u and the length of the pipeline is L, then the leakage site from upstream x is
![]() (1)
(1)
If the fluid velocity is neglected, Eq. (1) can be simplified as
![]() (2)
(2)
where the propagation velocity v of acoustic wave is decided by the liquid elasticity, density and tubing elasticity factor and so on. Location accuracy may be enhanced by means of rectifying the velocity of propagation wave [7].
The key problem to locate the leakage is to obtain the time difference of the acoustic signal generated by the leakage, that is, the time of signals with leakage features which propagate from leakage point to upstream and downstream end must be caught precisely. Then the next work is to make analysis for the corresponding feature points.
3 Instantaneous energy distribution based on HHT
HILBERT-HUANG transform (HHT) is a new method proposed by HUANG et al [8]. The key idea of this method is that the signal can be decomposed into several intrinsic mode functions (IMF) according to the time scale characteristics of the data, and in order to obtain instantaneous frequency and amplitude analytical signal of every modal component, they are constructed with HHT transform. The main purpose is to obtain the local characteristics of the signal.
HHT includes HILBERT transform and empirical mode decomposition (EMD) [9]. The aim of EMD is to decompose complex signal into intrinsic mode function with good performance of HILBERT transform and ensure that the signal with HILBERT transform has clear meaning of instantaneous amplitude and instantaneous frequency. Assuming x(t) is the collected signal, it may be decomposed into intrinsic mode function (IMF) and remainder [10] as follows:
![]() (3)
(3)
where r(t) is the remainder with monotonicity of x(t).
Transfer IMF component of cj(t) in Eq. (3) with HILBERT transform and then we obtain
![]() (4)
(4)
Thus, the analytic signal and envelope function of cj(t) is
![]() (5)
(5)
where![]() is the instantaneous amplitude and ��j(t) is instantaneous phase.
is the instantaneous amplitude and ��j(t) is instantaneous phase.
The corresponding instantaneous energy distribution is
![]() (6)
(6)
According to EMD with filtering function, the noise with high SNR, c1(t), c2(t), ��, cn(t) can be ignored [11]. Compute relative contribution value of the remaining IMF components, ignore the value with minor contribution, and then the instantaneous energy in main frequency is obtained as follows
![]() (7)
(7)
where E(t) is the instantaneous energy value of the main frequency band at any moment of t. It describes the energy transferring and volatility of signal of the system and it reflects the real state of the internal structure of the system changes.
For the urban gas pipeline system, there is a direct correlation between the different conditions including leakage and the change of instantaneous energy of the system. Signal is the vector of system information and it could express the change of the system state. The study of instantaneous energy distribution for gas pipeline system could be used not only to identify the operations of pipelines, but also to describe the change of conditions with time. Therefore, it helps to improve the accuracy of fault diagnosis. In this work, a new instantaneous energy distribution (IED) characteristics extraction method based on HILBERT-HUANG transformation (HHT) was presented.
4 Leakage detection with IED and correlation
4.1 Feature extraction based on IED
The leakage characteristic in the gas pipeline is different with that in oil pipeline. The experimental study shows that because of high pressure in pipelines and strong liquidity of gas, there is obvious characteristic of vibration in signal. The vibration will be delivered to the ends of pipelines with pressure wave. When leakage characteristic of negative pressure wave was not obvious and part information is lost, leakage can be detected effectively with instantaneous energy distribution.
The technical flow of leakage detection in gas pipelines is shown in Fig. 2. The content in solid line box of the figure is the feature extraction method based on instantaneous energy distribution which is also the focus of this work, while the content in dotted line box is the mode construction of instantaneous energy distribution feature in different operations and training of support vector machine (SVM) [12-13], which will be studied in further work and the content in stipple line box is leakage identification in practical work.
The leak detection based on instantaneous energy distribution characteristics is as follows.
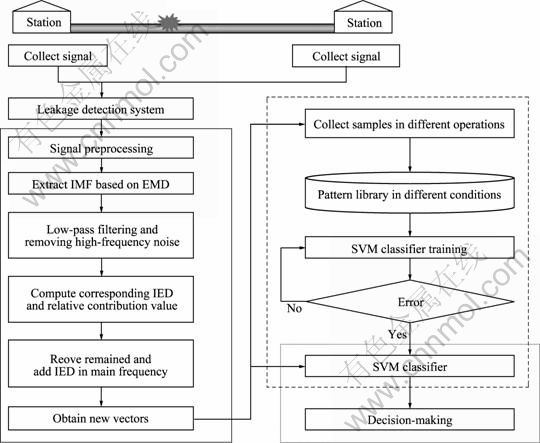
Fig. 2 Technical flow of training and leakage detection
1) Collect the signal of pressure in the frequency of fs in different states of valve transferring, compressor transferring and simulation leakage.
2) Decompose every signal into different states with EMD and several IMF components, c1(t), c2(t), ��, cn(t) are obtained. Note that under different conditions, the numbers of IMF components are ranged and the follow-up work should be analyzed with experiments.
3) Use the low-pass filtering function of EMD to remove h high-frequency components, c1(t), c2(t), ��, ch(t) previously and eliminate effects of noise to instantaneous energy distribution characteristics of signal.
4) With HILBERT transform, transfer the low-pass filter IMF components of ch+1(t), ch+2(t), ��, cn(t) and according to Eq. (6), instantaneous energy distribution E(i,l,j)(t) (i=1, 2, ��, m) are obtained, where m is the number of samples of every state, l (=1, 2, 3) represents the state of gas pipelines and j (=h+1, h+2, ��), n is the number of the IMF component. Compute the relative contribution value g(E(i,l,j)(t)) of every instantaneous energy distribution component E(i,l,j)(t) in every pressure signal. Ignore the component with small relative contribution value and add IMF components of main frequency to describe instantaneous energy distribution component E(i,l)(t).
5) Compute the correlation value ��(i,l)(t) between instantaneous energy distribution component E(i,l)(t) in every sample of every state and the other instantaneous energy distribution component in the same state to verify the reliability of instantaneous energy distribution characteristics as a typical signal eigenvectors of leakage.
6) Collect typical sample data of city gas pipelines and construct mode storehouse of instantaneous energy distribution. Input the eigenvector of instantaneous energy distribution to an established SVM classifier and after training the SVM classifier for typical faults are obtained. The test sample data are analyzed with the SVM classifier and then the operational status and fault type of a pipeline could be directly determined. If the target does not match, check or adjust the state of the pipeline to create a new state model. Input the test sample data into mode storehouse and re-train the SVM classifier. Thereby, a leakage detection system with fault identification and diagnosis is constructed to identify several operations of pipelines.
4.2 Signal correlation analysis
The cross-correlation technique is straightforward to detect similar signal [14]. Acoustic vibration in pipelines is measured using sensors at the two access points, and on either side a suspected leak would be detected to locate the leakage point. The signals from the sensors are transmitted to the leak noise correlator which computes the cross-correlation function of the two signals and presents the results to an operator. In the analysis, it is presented that the pipe is assumed to be of infinite length without reflecting discontinuities for the predominant fluid-borne wave and the velocity of acoustics is unaffected with that of the fluid in the pipelines. The data measured are two continuous random signals x1(t) and x2(t), which are assumed to be stationary. Setting the mean value of each signal to zero, the cross-correlation function is defined by CUI et al [15]:
![]() (8)
(8)
where �� is the lag of time; E[��] is the expectation operator. The argument �� that maximizes Eq. (8) provides an estimate of the time delay of ��leak. In practice, ![]() can only be estimated as signals that are always measured during a finite time interval. For example, if the two signals x1(t) and x2(t) are measured in a common time interval (0��x��T), the biased correlation estimator
can only be estimated as signals that are always measured during a finite time interval. For example, if the two signals x1(t) and x2(t) are measured in a common time interval (0��x��T), the biased correlation estimator ![]() is given by
is given by
 (9)
(9)
The required correlation estimator can be derived from the inverse Fourier transform of X1( f ) X2( f ) and scaled appropriately for normalization, where X1( f ) and X2( f ) are the Fourier transforms of x1(t) and x2(t), respectively.
It is useful to express the cross-correlation function in a normalized form, which has a scale from -1 to +1, namely the correlation coefficient ![]() can be defined as
can be defined as
![]() (10)
(10)
where ![]() and
and ![]() are the values of auto-correlation functions
are the values of auto-correlation functions ![]() and
and ![]() at ��=0.
at ��=0.
Figure 3 shows the implementation of the basic cross-correlation function.
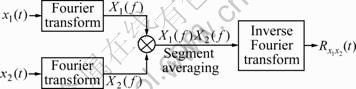
Fig. 3 Implementation of basic cross correlation function
5 Application examples
5.1 Experiment background and measurements
The experiment site was located in a gas pipeline in
Dongying City, China. The length of the pipeline was totally 9.5 km, which was composed of the upstream station, Erkuang, and the downstream station, measurement station. Figure 4 shows the leakage monitoring map. The site of leakage experiment was 4.5 km far away from upstream station which can be seen in Fig. 4 and there was a valve which could be operated. By opening the valve to give off gas with different speed, the different leakage could be simulated. In the test, three groups of leakage experiments were taken and the leak rates were 1, 5 and 10 m3/h, which represented small leakage, medium leakage and large leakage, respectively. In order to detect the identification ability of the method, we also took experiments of normal operation including valve operation and compressor operation and these operations were taken in the upstream station in Fig. 4. The valve operation experiment was to close one valve in upstream station. The compressor operating experiment was to reduce flow. The main experiment dates and methods are shown in Table 1.
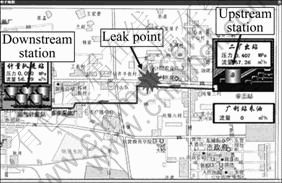
Fig. 4 Leakage monitoring map
Table 1 Experiment dates and methods
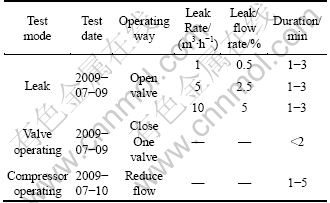
In order to obtain more abundant parameter signals, parameters were acquired at high speed with advanced acoustic sensors, OPC mode and four synchronical channels, and the sampling frequency was 1 MHz.
Thirty samples were collected in the three group modes of leakage, valve operation and compressor operation.
5.2 Signal processing and leakage detection
Compute 30 group samples in the three conditions with HHT transform and then obtain instantaneous energy distribution of every sample. In order to remove the effects of noise, the component with minor contribution was ignored. The IMF components after EMD decomposition are shown in Figs. 5-7.
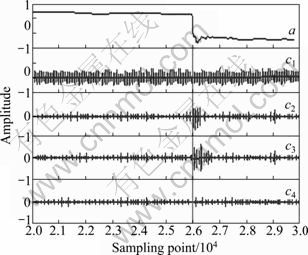
Fig. 5 Original signal and IMF components of valve operation
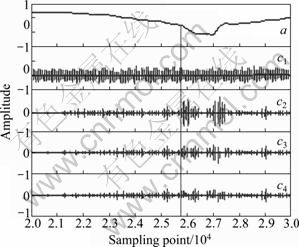
Fig. 6 Original signal and IMF components of compressor operation
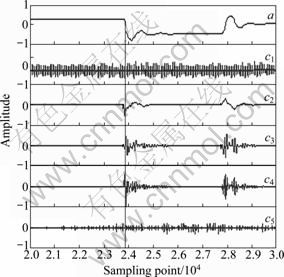
Fig. 7 Original signal and IMF components of leakage
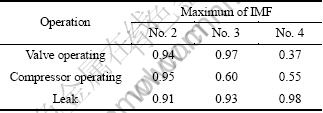
In Figs.5-7, a represents the original signal after normalization and c1, c2, c3 and c4 represent IMF components. In order to compare and compute all IMF components, they were normalized. From the figures, we can find that the component after EMD decomposition includes rich scale feature information, such as high- frequency noise, frequent multiplication and frequent division. Ignoring the obvious high-frequency noise component, c1(t), through experimental study, it is found that in the condition of valve operation, the instantaneous energy distribution was mainly determined by the second IMF component and then the trend items, c3(t) and c4(t), were ignored. In the condition of compressor operation, the instantaneous energy distribution was mainly determined by the second and third IMF components and then the trend item, c4(t), was ignored. In the leakage, the instantaneous energy distribution was mainly determined by the second, third and fourth IMF components and then the trend item, c5(t), was ignored. The relative contribution values of the IMF components in main frequency band of 90 samples in the three states are given in Table 2. From Table 2, we can see that the distribution of IMF components was different in the three conditions and they described the characteristic of energy distribution of original signal. With this reason, it could be determined whether the leakage occurred.
Table 2 Relative contribution values of IMF components in main frequency band
Compute the correlation coefficient of the instantaneous energy distribution of signal collected in the two ends of the pipeline in every condition. Table 3 gives the maximum of correlation coefficients of two samples in every two conditions including the same condition.
Table 3 Maximum of correlation coefficient
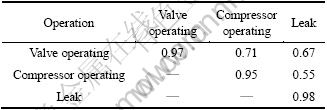
From Table 3, it is seen that in the same condition, the correlation coefficient value of the instantaneous energy distribution of signals collected in the two ends of the pipeline was high but the value was low in the different conditions. This shows that it is typical to take the instantaneous energy distribution as feature vectors and through it the change of pipelines could be judged.
5.3 Experiment results and analysis
The test results show that there is strong correlation between instantaneous energy distribution characteristics of signals of the two ends of city gas pipeline in the same operation. With this method, the changes of operations including normal operations and leakage could be detected.
In order to test the reliability of the method with IED, thirty experiments were taken in every group and the experiment results are present in Table 4.
Table 4 Experiment results based on IED
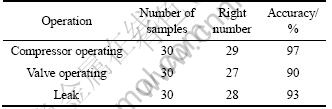
As given in Table 4, misjudged number of leakage samples is 2, and its classification accuracy is 93%. Misjudged number of closing valve samples is 3, and its classification accuracy is 90%. Misjudged number of compressor operating samples is 1, and its classification accuracy is 97%.
The results show that IED method has good generalization performance and high identification accuracy on abnormal samples for gas pipelines. The reason of high accuracy is that the frequency component in acoustics is largely unaffected by outside interference and noise. So, the IMF component extraction is the key problem. Although some previous studies are found in the literature, the whole area of leakage detection in cities is yet to be matured. In the same situation, the negative pressure wave method has been tried and the analysis shows that the leakage feature could not be extracted because of the signal attenuation of pressure wave.
6 Conclusions
1) With HHT, the instantaneous energy distribution feature of an unstable pressure signal is obtained. According to the relative contribution method of the instantaneous energy, its noise is eliminated. The leakage detection model with instantaneous energy distribution is established and with correlation analysis, the correlation coefficients of instantaneous energy distribution characteristics are computed. From calculation and experiments, in different pipeline states, the instantaneous energy (IE) distribution characteristics are different. The distribution difference of the IMF components could be used as feature vectors to identify the leakage for gas pipelines.
2) At the same time, the correlation coefficient of upstream and downstream is larger than others which can be used to identify leakage, valve operation and compressor operation. The test results show reliability and validity of this method and it provides an approach for fault diagnosis in city gas pipelines and this method may be used in other pipelines.
References
[1] GE C H, WANG G Z, YE H. Analysis of the smallest detectable leakage flow rate of negative pressure wave-based leak detection systems for liquid pipelines [J]. Computers and Chemical Engineering, 2009, 32(8): 1669-1680.
[2] FU Qiang, WAN Hong-jie, QIU Fu-peng. Pipeline leak detection based on fiber optic early-warning system [J]. Procedia Engineering, 2010, 7: 88-93.
[3] LAURENTYS C A, BOMFIM C H, MENEZES B R, CAMINHAS W M. Design of a pipeline leakage detection using expert system: A novel approach [J]. Applied Soft Computing, 2011, 11: 1057-1066.
[4] CHEN B,��WAN J W,��WU Y F. A pipeline leakage diagnosis for fusing neural network and evidence theory [J]. Journal of Beijing University of Posts and Telecommunications, 2009, 32(1): 5-9. (in Chinese)
[5] PENG Xing-yu, ZHANG Peng, CHEN Li-qiong, FAN Zhi-gang, YU Jian-sheng, LIU Zhou. Hazards evaluation on the fire and burst due to leakage of city gas pipelines [J]. Oil and Gas Storage and Transportation, 2007, 26(10): 28-31. (in Chinese)
[6] ZHAGN Jun. Statistical leak detection in gas and liquid pipelines [J]. Pipes and Pipelines International, 1993, 38(4): 101-112.
[7] ZHANG Lai-bin, CHEN Zhi-gang, LIANG Wei, WANG Ming-da. Research of leak detection and location method for heat oil pipelines [C]// Proceedings of the ASME International Pipeline Conference. Calgary, AB, Canada, 2008: 469-474.
[8] HUANG N E, SHEN Z, LONG S R, WU M C, SHIH H H, ZHENG Q, YEN N C, TUNG C C, LIU H H. The empirical mode decomposition and the Hilbert spectrum for nonlinear and non-stationary time series analysis [J]. Proceedings of the Royal Society of London, 1998, A454: 903-995.
[9] LOUTRIDIS S J. Damage detection in gear systems using empirical mode decomposition [J]. Engineering Structures, 2004, 26: 1833-1841.
[10] HUANG N E, WU M, LONG S R, SHEN S S, QU W, PER GLOERSEN, FAN K L. A confidence limit for the empirical mode decomposition and the Hilbert spectral analysis [J]. Proceedings of the Royal Society of London, 2003, A459: 2317-2345.
[11] LIU Qiang, ZHOU Rui-zhong, LIU Yu-han. Research on relation between instantaneous energy spectrum of earthquake ground motion and displacement response of structures [J]. Journal of Earthquake Engineering and Engineering Vibration, 2009, 29(5): 46-51. (in Chinese)
[12] CHAPELLE O, HAFFNER P, VAPNIK V N. Support vector machine for histogram-based image classification [J]. IEEE Trans on Neural Networks, 1999, 10(5): 1055-1064.
[13] ZHANG Hong-liang, ZOU Zhong, LI Jie, CHEN Xiang-tao. Flame image recognition of alumina rotary kiln by artificial neural network and support vector machine methods [J]. Journal of Central South University of Technology, 2008, 15: 39-43.
[14] DAI Guang, LI Wei, ZHANG Ying, LONG Fei-fei. An acoustic emission method for the in service detection of corrosion in vertical storage tanks [J]. Materials Evaluation, 2002, 60(8): 976-978.
[15] CUI Q, JIN S J, WANG L K. A new method of leak detection based on multi-scale correlation [J]. Journal of Electronic Measurement and Instrument, 2005, 19(5): 50-53, 62.
(Edited by HE Yun-bin)
Foundation item: Project(51004005) supported by the National Natural Science Foundation of China; Project supported by Open Research Fund Program of Beijing Engineering Research Center of Monitoring for Construction Safety (Beijing University of Civil Engineering and Architecture), China
Received date: 2011-06-21; Accepted date: 2011-10-28
Corresponding author: CHEN Zhi-gang, PhD; Tel: +86-10-68322103; E-mail: gangzi22@163.com
Abstract: For solving the difficult problem of leakage detection in city gas pipelines, a method using acoustic technique based on instantaneous energy (IE) distribution and correlation analysis was proposed. Firstly, the basic theory of leakage detection and location was introduced. Then the physical relationship between instantaneous energy and structural state variation of a system was analyzed theoretically. With HILBERT-HUANG transformation (HHT), the instantaneous energy distribution feature of an unstable acoustic signal was obtained. According to the relative contribution method of the instantaneous energy, the noise in signal was eliminated effectively. Furthermore, in order to judge the leakage, the typical characteristic of the instantaneous energy of signal in the input and output end was discussed using correlative analysis. A number of experiments were carried out to classify the leakage from normal operations, and the results show that the leakages are successfully detected and the average recognition rate reaches 93.3% among three group samples. It is shown that the method using acoustic technique with IED and correlative analysis is effective and it may be referred in other pipelines.
