
J. Cent. South Univ. Technol. (2008) 15(s1): 280-283
DOI: 10.1007/s11771-008-363-6
![]()
Moving behavior of pellets in a pellet shaft furnace
LIANG Ru-quan(����ȫ), HE Ji-cheng(�ռ���)
(Laboratory of Electromagnetic Processes of Materials, Northeastern University, Shenyang 110004, China)
Abstract:
The downward moving behavior of pellets in a 8 m2 pellet shaft furnace with an internal vertical air channel and a drying bed was studied by means of a visualized model (1?15) and a top model (1?1). The visualized model experiment shows that the downward movement of pellets can be regarded as plug flow approximately inside the furnace except for the lower region of cooling zone due to the influence of the drained hopper. The top model experiment reveals that the pellet sizes increase along the moving direction because of the percolation phenomenon, which results in a decrease of the resistance coefficient and an increase of the gas flow rate from the furnace wall toward the furnace center.
Key words:
pellets; pellet shaft furnace; visualized experiment; top model experiment; moving behavior��
1 Introduction
The pellet shaft furnace with an internal vertical air channel(IVAC) and a drying bed is a unique pellet roasting equipment in China, which has dominated the production of acidic pellets used for iron making. The pellet shaft furnace is also a kind of countercurrent reactive equipment between fixed and fluidized beds, and its structure is very complex. After being charged into the furnace, the pellets undergo sloping movement for two times, drop into the hearth and then move downward at a speed of 1.0-1.7 m/s. The most important phenomenon occurred in the pellet shaft furnace is the heat exchange between pellets and furnace gases. Pellets exchange heat with hot roasting gases produced from combustion chambers in the roasting zone, and then the roasted pellets are cooled by cooling air in the cooling zone. There are mainly two factors affecting the heat transfer between pellets and gases. One is the gas flow distribution, and the other is the moving behavior of pellets in the furnace. CAI et al[1] studied the gas flow distribution in pellet shaft furnace through thermal test, cold state experiment, analysis and simulation of thermal process. They reported that the operating and constructional parameters were the main factors affecting gas flow distribution in pellet shaft furnace. Among the operating parameters, the inflow ratio was the main factor affecting gas distribution. The greater the inflow, the smaller the upward cooling air flow rate and the greater the downward roasting gas flow rate. DWARAPUDI et al[2] predicted the iron ore pellet strength using artificial neural network model. The cold compression strength was found to be more sensitive to variation in bentonite, basicity, FeO and green pellet moisture. WANG et al[3] developed a new self-heating reduction method of iron ore-coal pellet in the concurrent shaft furnace based on the laboratory experiment of reducing iron ore-coal pellet in oxidizing atmosphere. The studies on the pellet shaft furnace carried out so far were mainly about the gas flow distribution in the pellet shaft furnace[4-8]. However, few studies have been carried out so far for the investigation of the moving behavior of pellets in the furnace.
In this work, the downward moving behavior of pellets in a 8 m2 pellet shaft furnace with an internal vertical air channel and a drying bed was studied experimentally by means of a visualized model (1?15) and a top model (1?1) to understand the moving behavior of pellets as well as its impact on the gas flow rate, which had great impact on the distribution of temperature and reactive zone in the furnace.
2 Characteristics of downward motion
2.1 Visualized model experimental apparatus and procedure
The experimental model apparatus is shown in Fig.1. The model apparatus was made of organic glass. The width and height of the model were 1/15 of those of the 8 m2 pellet shaft furnace, respectively, and the thickness of the model was 85 mm. The model apparatus could be separated into two parts along the centre in order to observe the traceable particles. The experimental
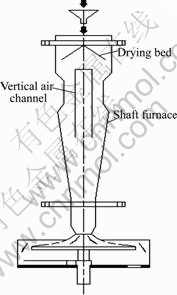
Fig.1 Visualized experimental apparatus
apparatus were equipped with table feeder, and its turning velocity could be regulated. The particles with an average diameter of 1.0 mm were used to simulate pellets in the furnace, and the particle diameter was also 1/15 of the average diameter of actual pellets. To start an experiment, particles were charged into the model apparatus from the top, and the speed of the table feeder was adjusted to the level of delivering speed in the pellet shaft furnace. After the downward state of particles became stable, a layer of traceable particles were charged into the model once every time. When the first layer traceable particles had reached the vicinity of the hopper, the table feeder was stopped. After that, the gelatin was poured into the model slowly and then put the model aside. When the gelatin solidified, the model was separated into two parts along the centre. So, it was possible to observe the distribution of the traceable particles and take photographs.
2.2 Experimental results and discussion
Five traceable particle curves obtained under the average downward velocity U=0.8��10-3 m/s are shown in Fig.2. It took 2, 5, 8, 10, 15 min, respectively. Because of the friction between furnace wall and pellets, low velocity shear region was formed in the vicinity of the furnace wall. The shear region developed greatly in the inclined burden surface and then became stable. Because of the influence of drained hopper, the shear region developed again. The shear region was narrow in roasting, soaking zones and the upper part of cooling zone. The downward motion of pellets could be regarded as plug flow approximately. The moving pattern of ��V�� was formed under the inlet of the internal vertical air
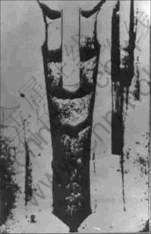
Fig.2 Photograph of time lines of particles
channel. It was imaginable that the lower part of internal vertical air channel could be pressed greatly by pellets.
3 Characteristics of burden distribution
3.1 Burden distribution experimental apparatus and procedure
Pellets charged into the furnace by the automatic feeding vehicle moved downward to the furnace wall on the inclined drying bed. After that, pellets changed the moving direction and moved toward the furnace center along the inclined burden surface.
The top model apparatus is shown in Fig.3. It was used to simulate the upper part of the furnace. The model apparatus had the same scale with the 8 m2 pellet shaft furnace in width and its thickness was 150 mm. The angle of the bottom plate was 30?, which was approximately equal to that of the nature piling up. A layer of pellets was charged on the bottom plate in advance. To start experiment, two charging controllers 1 and 2 were shut down, and the pellets were charged into the hopper. Then the charging controller 2 was raised in certain speed and pellets attended into the model apparatus in the moving state, which was similar to that happened in actual pellet shaft furnace. After the sample box was filled fully with pellets, sample plates 1-8 were inserted into the sample box from the bottom plate once every 100 mm, respectively. Finally, the charging controller 1 was opened, and pellets between the charging controller 1 and the sample plate 1 were taken out. Then the sample plate 1 was pull down, and pellets between the sample plate 1 and 2 were taken out. Sample plates 2-8 were also pulled down respectively, as described above, until all pellets between any two sample plates were taken out, respectively, and then the 9 group pellets were measured.
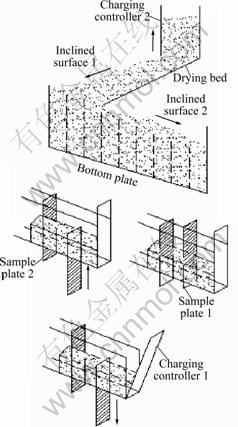
Fig.3 Burden distribution experimental apparatus
3.2 Experimental results and discussion
Fig.4 shows the distribution of pellet sizes on the burden surface. In Fig.4 X is the distance away from the wall of the internal vertical air channel; X0 is the distance from wall of the internal vertical air channel to the furnace wall; D is the pellet diameter, and the ![]() is the average pellet diameter on the burden surface. The dotted line corresponds to the region from furnace wall to the border of the drying bed, and pellets change moving direction and pile up in this region. The solid line corresponds to the distance from the border of the drying bed to the wall of the internal vertical air channel. It was found that the number of large size pellets increased rapidly from the border of the drying bed to the wall of the internal vertical air channel with the increase of pellet moving distance on the burden surface (inclined burden surface 2). The dotted line shows the same moving pattern on the burden surface of the drying bed (inclined burden surface 1). Fig.5 shows the weight ratio distribution of pellets with diameters less than 11 mm. From Fig.5, it was found that the weight ratio of smaller size pellets was low in the vicinity of the wall of the internal vertical air channel. This meant that the larger size pellets located mainly at the vicinity of the wall of the internal vertical air channel, that is, the furnace center. Because the larger size pellets had better rolling ability, they rolled across smaller size pellets continuously. This kind of percolation phenomenon made larger pellets piled up toward the furnace center.
is the average pellet diameter on the burden surface. The dotted line corresponds to the region from furnace wall to the border of the drying bed, and pellets change moving direction and pile up in this region. The solid line corresponds to the distance from the border of the drying bed to the wall of the internal vertical air channel. It was found that the number of large size pellets increased rapidly from the border of the drying bed to the wall of the internal vertical air channel with the increase of pellet moving distance on the burden surface (inclined burden surface 2). The dotted line shows the same moving pattern on the burden surface of the drying bed (inclined burden surface 1). Fig.5 shows the weight ratio distribution of pellets with diameters less than 11 mm. From Fig.5, it was found that the weight ratio of smaller size pellets was low in the vicinity of the wall of the internal vertical air channel. This meant that the larger size pellets located mainly at the vicinity of the wall of the internal vertical air channel, that is, the furnace center. Because the larger size pellets had better rolling ability, they rolled across smaller size pellets continuously. This kind of percolation phenomenon made larger pellets piled up toward the furnace center.
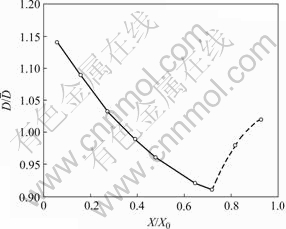
Fig.4 Distribution of pellet sizes on burden surface
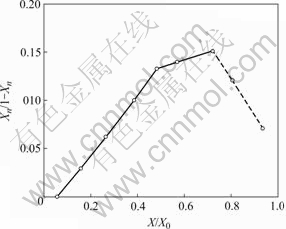
Fig.5 Distribution of pellets with diameter less than 11 mm
3.3 Estimation of gas flow resistance
The gas flow resistance at the furnace cross section was also investigated by analyzing the experimental results of pellet size distribution. The width of the shaft furnace was divided into several equal parts. The relation between gas flow rate Ggi and resistance coefficient of gas flow Ki is given by
![]() (1)
(1)
where ![]() is the average gas flow rate;
is the average gas flow rate; ![]() is the average resistance coefficient of gas flow.
is the average resistance coefficient of gas flow. ![]() is given by
is given by
![]() (2)
(2)
where Si is the cross section area of a part. The average resistance coefficient ![]() and the resistance coefficient ratio
and the resistance coefficient ratio ![]() are given as
are given as
![]() (3)
(3)
![]() (4)
(4)
where ST is whole cross section area. In the case of pellets, Ki is calculated by the following statistics formula
![]() (5)
(5)
where D5 is the average diameter of pellets with diameters larger than 5 mm; ![]() is the diameter range of pellets with diameter large than 5 mm; F is the percentage of pellets with diameter less than 5 mm. The resistance coefficient of gas flow
is the diameter range of pellets with diameter large than 5 mm; F is the percentage of pellets with diameter less than 5 mm. The resistance coefficient of gas flow ![]() can be obtained by using Eqn.(5) and the experimental data of pellet size distribution in every sample zone, and the average resistance coefficient
can be obtained by using Eqn.(5) and the experimental data of pellet size distribution in every sample zone, and the average resistance coefficient ![]() can be calculated by using Eqn.(3). Therefore, the resistance coefficient and gas flow rate distributions can be obtained. Fig.6 shows the resistance coefficient distribution of the gas flow. The dotted line corresponds to the region from furnace wall to the border of the drying bed, and the solid line corresponds to the distance from the border of the drying bed to the wall of the internal vertical air channel. From Fig.6, it was found that the resistance coefficient of the gas flow was the largest at the border of the drying bed and decreased from the border of the drying bed toward the wall of the internal vertical air channel. The resistance coefficient of gas flow decreased also from the border of the drying bed toward the furnace wall. This
can be calculated by using Eqn.(3). Therefore, the resistance coefficient and gas flow rate distributions can be obtained. Fig.6 shows the resistance coefficient distribution of the gas flow. The dotted line corresponds to the region from furnace wall to the border of the drying bed, and the solid line corresponds to the distance from the border of the drying bed to the wall of the internal vertical air channel. From Fig.6, it was found that the resistance coefficient of the gas flow was the largest at the border of the drying bed and decreased from the border of the drying bed toward the wall of the internal vertical air channel. The resistance coefficient of gas flow decreased also from the border of the drying bed toward the furnace wall. This
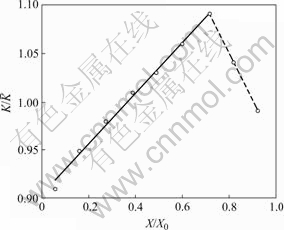
Fig.6 Distribution of resistance coefficient of gas flow on furnace cross section
kind of resistance coefficient distribution of the gas flow could be attributed to the distribution of pellet sizes as shown in Fig.4 and resulted in an increase of the gas flow rate from the border of the drying bed toward the wall of the internal vertical air channel.
4 Conclusions
1) In the upper zone of the furnace, the downward movement of pellets could be regarded as plug flow approximately. Because of the influence of drained hopper, the downward movement of pellets was non-uniform in the lower part of the cooling zone.
2) Because larger size pellets had better rolling ability, they rolled across smaller size pellets continuously. So, pellet sizes increased along the moving direction, which resulted in resistance coefficient decrease and gas flow rate increase from furnace wall toward the furnace center.
3) The formula given in the present work can be used to forecast the distribution of gas flow rate in the pellet shaft furnace.
References
[1] CAI Jiu-ju, DONG Hui, WANG Guo-sheng, YANG Jun. Gas flow distribution in palletizing shaft furnace [J]. J Iron Steel Research, Int, 2006, 13(6): 16-20.
[2] DWARAPUDI S, GUPTA P K, RAO M H. Prediction of iron ore pellet strength using artificial neural network model [J]. J ISIJ Int, 2007, 47(1): 67-72.
[3] WANG Q, YANG Z X, TIAN J M, SUN J F. Fundamental study on new method of reducing iron ore-coal pellet in concurrent shaft furnace [J]. J Iron Steel Research, Int, 1999, 6(1): 19-22.
[4] DONG Hui, CAI Jiu-ju, WANG Guo-sheng, et al. Experimental study on gas flow distribution laws in palletizing shaft furnace [J]. J Northeastern Univ, 2004, 25(5): 435-438.
[5] DONG Hui, CAI Jiu-ju, WANG Guo-sheng, et al. Experomental study on gas flow distribution affected by constructional parameters of pelletizing shaft furnace [J]. J Northeastern Univ, 2004, 24(6): 563-566.
[6] DONG Hui, WANG Guo-sheng, CAI Jiu-ju, et al. Experimental study on gas flow distribution influenced by layer situation pf packed beds in pelletizing shaft furnace [J]. J Sintering Pelletizing, 2004, 29(2): 1-4. (in Chinese)
[7] WANG Guo-sheng, DONG Hui, CAI Jiu-ju. Aanlysis and simulation of thermal process in palletizing shaft furnace [J]. J Iron Steel, 2004, 39(4): 60-63. (in Chinese)
[8] WANG Guo-sheng, DONG Hui, FANG Yu-tian, et al. Heat and energy survey on Jinan steel No. 2 pellet furnace [J]. J Sintering Pelletizing, 2002, 27(6): 1-4. (in Chinese)
Foundation item: Projects(59374166, 58974155) supported by the National Natural Science Foundation of China
Received date: 2008-06-25; Accepted date: 2008-08-05
Corresponding author: LIANG Ru-quan, Professor; Tel: +86-24-83685996; E-mail: liang@epm.neu.edu.cn
