
Trans. Nonferrous Met. Soc. China 23(2013) 2374-2382
Numerical simulation of residual stress field in green power metallurgy compacts by modified Drucker-Prager Cap model
Rui ZHOU, Lian-hong ZHANG, Bai-yan HE, Yu-hong LIU
Tianjin Key Laboratory of Equipment Design and Manufacturing Technology, Tianjin University, Tianjin 300072, China
Received 30 July 2012; accepted 30 October 2012
Abstract:
Compaction process simulation and residual stress prediction of green PM compact were carried out with elasto-plastic 3D FEA based on the modified Drucker-Prager Cap model in Abaqus. The model parameters of the investigated powder Distaloy AE were determined as functions of relative density through typical mechanical property tests of powder. The model was implemented as a user subroutine USDFLD. Single sided compaction of a d20 mm��5 mm disk green compact of Distaloy AE was simulated, and the residual stress of the disk after ejection was predicted with FEA. The FEA results of the compaction process and the residual stress of the disk show good agreement with compaction experiments and X-ray diffraction measurements, which validates the model and its parameters. The results indicate that the compressive residual stresses exist mainly in a thin layer on the side surface, but the residual stresses are very small on the top and bottom surfaces.
Key words:
residual stress; green compacts; numerical simulation; modified Drucker-Prager Cap model;
1 Introduction
Powder metallurgy (PM) is an effective process of manufacturing near net shape products of complicated parts. It offers many advantages, including high productivity, low production costs, less energy consumption and environmental friendship [1,2]. The conventional compaction process in PM is closed die pressing, which leads to a cohesive component called green compact. Pressing and ejection stages are essential to quality of green compacts, which may introduce such defects as non-homogeneous density distribution and consequent residual stress or cracks.
Residual stress in green compacts first occurs after the releasing action due to non-uniform deformation during the compaction process, which may cause lamination crack in the ejection stage. Furthermore, the residual stresses still exist after ejection, which influences the post-compaction processes and leads to dimensional distortions, changes in mechanical properties and even failure of the final products. Therefore, accurate prediction of the residual stress is fundamental to process and quality control of PM products. Finite element analysis (FEA) [3,4] as an effective numerical simulation technique can give a better understanding of the phenomena in PM by considering nonlinearity in geometry, material, and boundary condition.
Over the years, several yield models have been successfully implemented in FEA to character the flow behavior of metal powder. KANG et al [5] validated the finite element results with experimental data based on the yield function of Shima-Oyane model during cold stepped compaction. YAZICI et al [6] described the complex forming behavior of PM gear teeth during surface densification with modified Gurson mode. KHOEI et al [7] used a combination of the Mohr-Coulomb and elliptical yield cap model to reflect the stress state and relative density distribution during powder compaction process. ANDERSSON et al [8] discussed the influence from punch geometry on the stress distribution with constitutive model presented by Brandt and Nilsson. In these studies, most models of the compaction process predict similar levels of porosity, but different levels of residual stress. Thus residual stress is more discriminating in identifying the most appropriate compaction model. Moreover, most models mentioned above were both based on the two dimensional finite element, which could not provide more comprehensive understanding in green compact characteristics and no exact experimental data to validate the residual stress in green compact.
In this work, a detailed understanding of the residual stress, single sided compaction simulation and residual stress prediction were carried out with elasto-plastic 3D FEA based on the modified Drucker-Prager Cap model. The model parameters for powder Distaloy AE were determined as functions of relative density through typical mechanical property tests of powder. The model was implemented as a user subroutine of Abaqus. The FEA results of the compaction and the residual stress of the disk were validated by compaction experiments and X-ray diffraction measurements.
2 Modeling
2.1 Constitutive model
The constitutive model is a key factor in simulation of powder compaction which typically has been developed by continuum mechanics approach. The generally used models have been divided into two categories. The models [9], such as Kuhn, Green, Shima-Oyane, Doraivelu, Gurson, and Lee-Kim governed primarily by ellipsoids, were expanded from the classical von Mises model and satisfied the plasticity theory. While the models such as modified Cam-Clay, DiMaggio-Sandler, and Drucker-Prager Cap, were originally developed from soil mechanics.
Though it is effective in modeling porous materials, the first category of model or the ellipsoid model fails to capture the shearing phenomenon in powder which is extremely important during unloading and ejection of powder compaction. In contrast, the second category of model or the caps model has better performance because of the presence of a shear yield surface in addition to an elliptical cap of the yield surface.
In this work, a density-dependent modified Drucker-Prager Cap model was used to simulate the compaction and predict the residual stress state in green compacts. The model [10] is derived by addition of a cap yield surface to the Drucker-Prager model, as shown in Fig. 1. The Drucker-Prager shear yield surface, providing dominantly shearing flow, is written as Eq. (1):
 (1)
(1)
where �� and d represent the angle of friction of the material and its cohesion, respectively, and can depend on other predefined fields; p=-trac(��)/3 is the hydrostatic pressure. The deviatoric stress measure t is defined as Eq. (2):
 (2)
(2)
where q is the von Mises equivalent stress; r is the third stress invariant; K is a material parameter that controls the dependence of the yield surface on the value of the intermediate principle stress (Fig. 2). The yield surface is defined so that K is the ratio of the yield stress in triaxial tension to the yield stress in triaxial compression. K=1 implies that the yield surface is the von Mises circle in the deviatoric principal stress plane, thus t=q. To ensure that the yield surface remains convex, it is required 0.778��K��1.0.
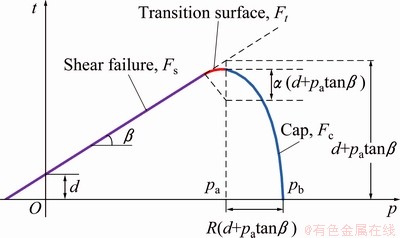
Fig. 1 Yield surfaces in p-t plane [10]
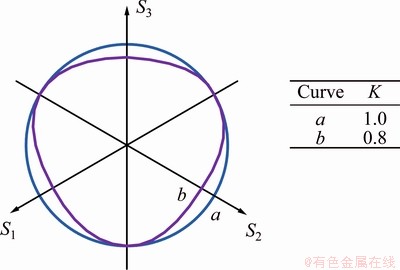
Fig. 2 Yield surfaces in deviatoric plane [10]
The cap yield surface provides an inelastic hardening mechanism to account for plastic compaction and helps to control volume dilatancy when the material yields in shear, which is written as Eq. (3):

 (3)
(3)
where R is a material parameter (0.0001��R��1000) that controls the eccentricity of the cap, �� is a small number used to define a smooth transition surface between the shear yield surface and the cap, and pa is an evolution parameter given in Eq. (4):
 (4)
(4)
where pb is the hydrostatic compression yield stress as a user-defined piecewise linear function of volumetric plastic strain  .
.
The transition surface which provides a smooth connection purely for facilitating the numerical implementation is defined as Eq. (5):

 (5)
(5)
The plastic flow is defined by a flow potential that is associated in the cap region and nonassociated in the failure surface and transition regions. The flow potential surface in the meridional plane is depicted in Fig. 3. It is made up of an elliptical portion in the cap region that is identical to the cap yield surface as expressed in Eq. (6):
 (6)
(6)
The associated flow potential is expressed as Eq. (7):
 (7)
(7)
where d�� is a positive scalar denoting the magnitude of plastic deformation.

Fig. 3 Flow potential in p-t plane [10]
The nonassociated flow component in the model is defined as Eq. (8):
 (8)
(8)
The two elliptical portions form a continuous and smooth potential in the p��t plane.
The nonlinear elasticity assumption is suitable to model the behavior of metal powder during unloading according to the experiments. In this model, the elastic modulus E can be expressed as a function of the axial stress (��z) and the relative density (��) by Eq. (9) [11]. The Poisson ratio (��) is defined as Eq. (10) [12].
 (9)
(9)
 (10)
(10)
Furthermore, the volumetric plastic strain can be expressed as Eq. (11):
 (11)
(11)
where �� is the current relative density and ��0 is initial relative density.
2.2 Model parameters identification
In this study, the model parameters, ��, d, K, pa, R, pb and �� for metal powder Distaloy AE, were identified through experiments. In addition, two elastic parameters, elastic modulus E and Poisson ratio ��, are needed to describe the elastic behavior of metal powder. All the parameters were functions of relative density except K and �� which are 1 and 0.02, respectively.
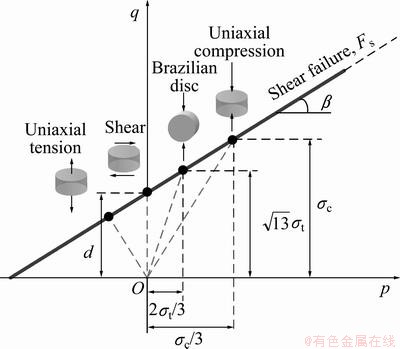
Fig. 4 Determination of shear yield line from green strength tests
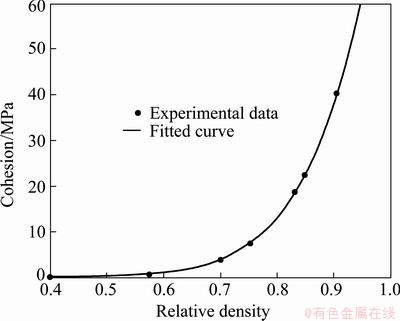
Fig. 5 Relationship between cohesion and relative density
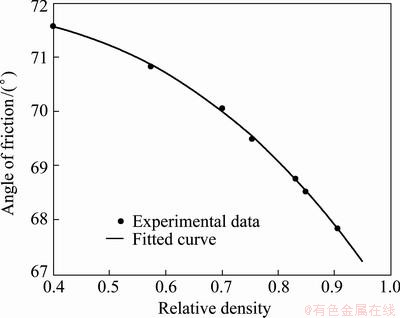
Fig. 6 Relationship between angles of friction and relative density
The success of the model not only depends on the accuracy of its material parameters but also the methods used to determine them. The friction angle �� and cohesion d which control the Drucker-Prager shear failure surface could be determined by assuming the nonlinear segment of the unloading curve in a die compaction test [13]. But the powder would result in excessive axial dilation during decompression in simulation when material parameters were calibrated by this method. The reason for this phenomenon may be due to the fact that the unloading path hits the shear failure line. Here, another method [14] was employed to determine the Drucker-Prager shear failure surface by any two of four experiments including uniaxial compression, diametral compression or Brazilian disc, uniaxial tension and pure shear test. In Fig. 4, four maximum loading points were plotted in the p��q plane, and any two could determine a straight line as the shear failure line. The slope of the line gives �� and the intercept with the q axis gives the cohesion strength d. If ��c and ��t are the fracture strength obtained in the uniaxial compression and Brazilian disc test respectively, the corresponding values of p and q are calculated as follows. For the uniaxial compression test, p=-��c/3 and q=-��c. For the Brazilian disc test, p=2��t/3 and q= ��t. Consequently, the friction angle �� and cohesion d are expressed as
 (12)
(12)
 (13)
(13)
Figures 5 and 6 illustrate the identified parameters, d and ��, of shear failure line from green strength tests. The fitted curves for d and �� were given by formulas (14) and (15), respectively. The value of d is considered to be zero when �� is equal to initial relative density, while the maximum value of �� is about 71.6�� according to formula (13).
 (14)
(14)
 (15)
(15)
The cap eccentricity parameter R can be obtained using triaxial compression test. The experimental data were reported as shown in Fig. 7 [15]. Here, the fitting function of relative density is given by formula (16), and the value is almost constant as ��<0.6 for assuring that the value of R is not less than zero in a low density region.
 (16)
(16)
where R1=0.2311, R2=0.8558, k=31.478, and ��c=0.721.
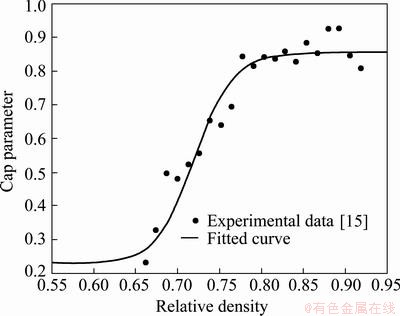
Fig. 7 Relationship between cap parameter and relative density
The evolution parameter pa is defined by Eq. (17) [15]. Here, the die compaction test is employed to measure the axial stress ��z and displacement of the punch. The hydrostatic compression yield stress pb is obtained by solving Eq. (4) and the result is shown in Fig. 8. The fitted curve is given by formula (18).
 (17)
(17)
 (18)
(18)
Elastic modulus E was calculated using Eq. (9) with the experimental data of unloading of compaction test mentioned above in identification of parameter pa. The calibrated elastic modulus is demonstrated in Fig. 9, and the fitted function of relative density can be expressed in the form (19):
 (19)
(19)
where c0, c1 and c2 are 13.16, 0.063, and 8.538 respectively.
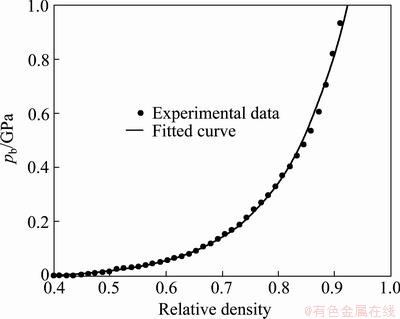
Fig. 8 Curve of evolution parameter versus relative density
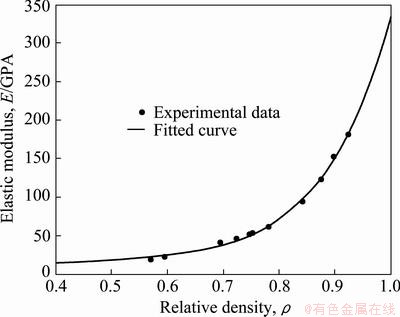
Fig. 9 Elastic modulus as function of relative density
2.3 Finite element modeling
The single sided die compaction of a d20 mm��5 mm disk green compact of metal powder Distaloy AE was simulated to predict the residual stress. The mechanical behavior of metal powder was characterized by the elasto-plasticity with the density-dependent modified Drucker-Prager Cap model of section 2.1, which was implemented with user subroutines (USDFLD) in finite element code Abaqus. A 3D 1/4 FE model for the compaction of the disk developed as shown in Fig. 10.
The inner and outer diameters of the die are 20 mm and 80 mm, respectively. The initial relative density of the powder was 0.4. The fill height of the powder was 11 mm and the powder was then pressed by the upper punch to a final height of 5 mm. In unloading, the lower punch was released from the powder compact and then removed from the die. Afterwards, the upper punch moved downward to eject the compact out of the die. The simulation of the above processes was considered quasi-static and governed by controlling the displacements of the upper and lower punches. The friction at the interface between the powder and tools was defined by Coulomb friction law with the friction coefficient of 0.15.
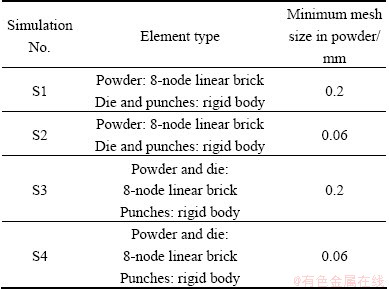
In order to predict the residual stress of the green compacts more accurately and to understand the influence of the mesh size and element type on simulation results, four cases of simulation were designed and carried out, as shown in Table 1. The minimum mesh size in Table 1 was determined by referring the experiments from Ref. [16], which states that the residual stress on the surface of the green compact from die is compressive while the residual stress is tensile at about 200 ��m below the surface. In the current simulations, the mesh, which is close to the die, of the finite element model was refined to the minimum size as shown in Fig. 10(b). The die was assumed linear elastic, whose mechanical property corresponded to tungsten carbide. The elastic modulus E is 710 GPa and Poisson ratio �� is 0.28.
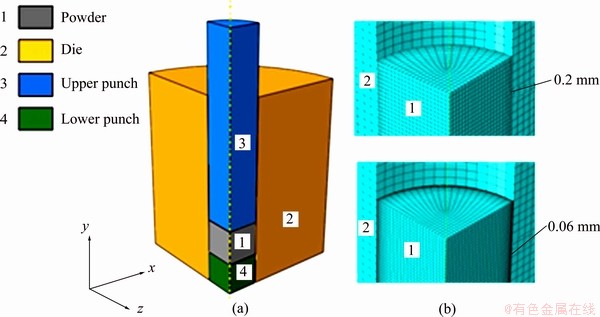
Fig. 10 Three dimensional finite element model (a) and minimum mesh of powder (b)
Table 1 FE model parameters
3 Experimental
In this study, two experiments were implemented: the die compaction test was used to calibrate the global mechanical response of powder compaction process, and the X-ray diffraction test was used to measure the residual stress of green compact after ejection from the die.
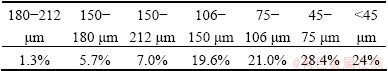
The powders Distaloy AE supplied by  were used in the experiments. The chemical properties and sieve analysis are shown in Table 2 and Table 3. The apparent density of Distaloy AE is 3.08 g/cm3 and flow hall is 27 s/50 g and the theoretical density is around 7.76 g/cm3.
Table 2 Chemical composition of Distaloy AE (mass fraction, %)
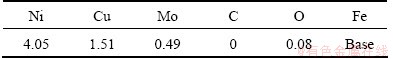
Table 3 Sieve analysis of Distaloy AE
First, the die compaction experiment was carried out in a 30 t laboratory hydraulic press under 600 MPa pressure to prepare the d20 mm��5 mm disk green compact. The die cavity was lubricated with zinc stearate dissolved in ethanol. The load of the press and the displacement of the punch were recorded for subsequent analysis.
And then, the X-ray diffraction experiment was performed in equipment Proto iXRD to measure the residual stress of green compact, which employed the latest European and American standard. The new calculating method [17] adopted the complete stress equation assuming the presence of the shear stress and ellipse fitting, which was considered to determine the residual stress more accurately avoiding the systematic errors. In this test, the radiation was Cr K�� and the reflection {211} was selected. The aperture of incident beam was 1 mm. The stress measurements on green compact were conducted at different points on the all surfaces (Fig. 11). The points were measured in the radial and hoop directions on the both top and bottom surfaces, and the points on the side surface were measured in axial and hoop directions.
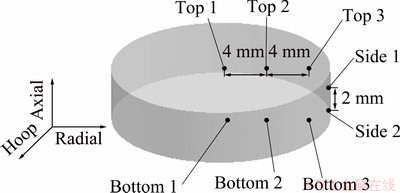
Fig. 11 Measurement locations and coordinates on green compact
4 Results and discussion
4.1 Die compaction process of green compact
A comparison between experimental and numerical simulated loading curves is drawn in Fig. 12. The FEA results of simulation cases S1 to S4 all match well with the experimental data. The experimental maximum pressing force was 188.4 kN. The corresponding FE simulated pressing force was 193 kN. The comparison validated the selected powder plasticity model and its parameters.
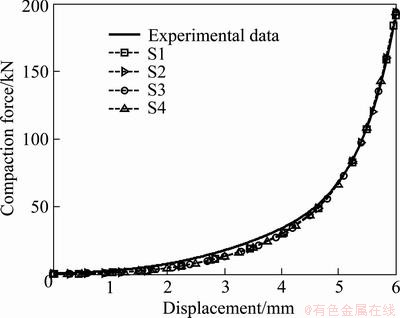
Fig. 12 Curves of pressing force vs displacement
Figure 13 gives experimental and numerical curves of ejection force versus displacement. The FE results in simulation cases S3 and S4 are in good agreement with experimental data. While simulation cases S1 and S2 fail
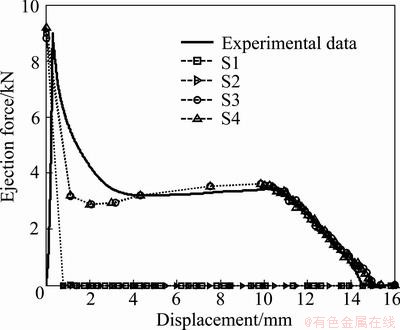
Fig. 13 Curves of ejection force vs displacement
to simulate the ejection process because of the rigid body definition of the die. The reason is that the ejecting force is due to the interaction between the die and the compact, while the rigid body definition of the die will cause loss of the interaction. Figure 14 shows the relative density distribution of green compact ejected from the die in S1-S4. There are no obvious differences among the four simulation cases. The highest density was found in the upper right corner and the lowest density was found in the lower right corner. This indicates that the element type of the die and the mesh size of the powder have less influence on the relative density since powder densification is dominated by deformation of the powder during pressing.
4.2 Residual stress of green compact
The origin of residual stress is non-uniform deformation. In the case of powder compaction, the residual stress is mainly caused by die friction and non-uniform densification. Figure 15 shows the FE simulated axial residual stress of the green compact after ejection. Simulation cases S3 and S4 are featured of a layer of axial compressive residual stress. The layer thickness of the axial compressive residual stress in simulation case S4 is 0.057-0.198 mm, which is in agreement with the results of neutron diffraction measurement [16]. This illustrates the benefit and necessity of fine mesh size to residual stress simulation. Residual stresses of simulation cases S1 and S2 are several MPa in magnitude, which is too far from the experimental results. This is because of the same reason as the simulation of the ejection process. Meanwhile, the significant differences of simulation cases S1 and S2 against S3 and S4 also present the effect of the ejection on the residual stress.
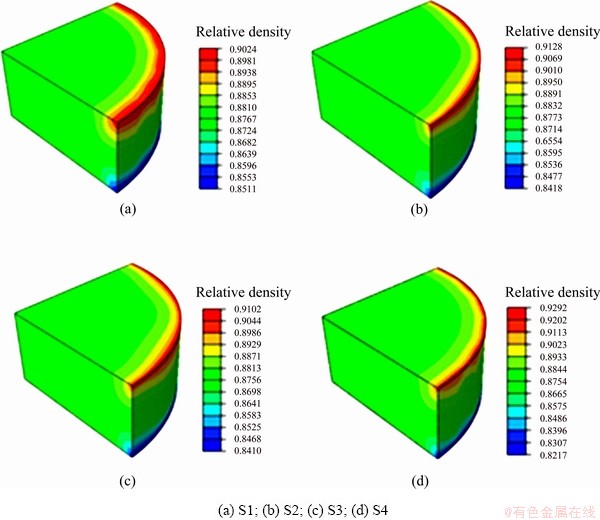
Fig. 14 Relative density distribution after ejection in S1-S4
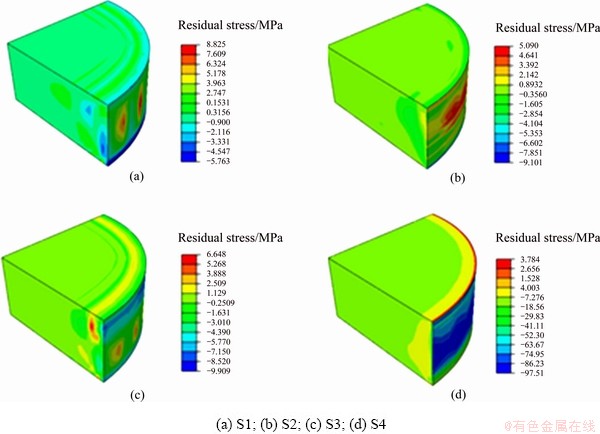
Fig. 15 Axial residual stress ��y distribution in S1-S4
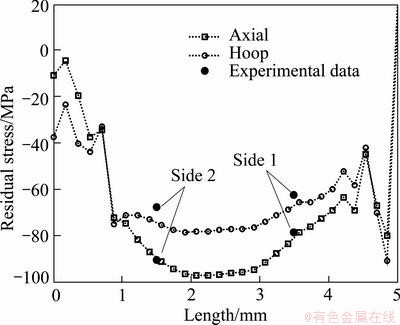
Fig. 16 Residual stress on side surface
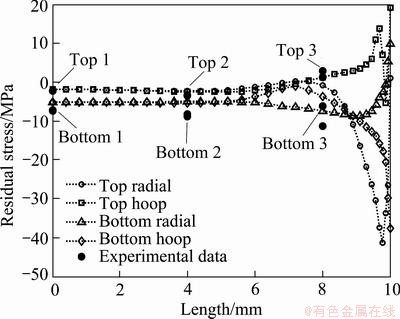
Fig. 17 Residual stress on top and bottom surfaces
Figures 16 and 17 present the residual stress of simulation case S4 and X-ray diffraction measurement. Figure 16 shows the axial and hoop residual stresses along the height on the side surface of the compact. Figure 17 illustrates the radial and hoop residual stresses along the radius on the top and bottom surface of the compact. As can be found in the figures, the residual stresses from FE simulation are consistent with those from the X-ray diffraction measurement, the residual stress exists mainly in the side surface layer and the axial compressive stress is a dominant residual stress component of the green compact. The maximum axial and hoop compressive residual stresses on the side surface of simulation case S4 are -97.5 MPa and -90.93 MPa, separately. The FE simulated residual stresses on the central top and bottom surfaces are several MPa in magnitude, most of the radial and hoop residual stresses are between -10 and 10 MPa, except the corner ones.
5 Conclusions
1) A modified density-dependent Drucker-Prager Cap yield model and corresponding flow equation were proposed for modeling of powder compaction process and residual stress of green PM compact. Parameters of the yield model for Distaloy AE steel powder were identified from typical tests of mechanical properties of powder compacts.
2) FE elasto-plastic modeling of single sided powder compaction of Distaloy AE was conducted based on the modified Drucker-Prager Cap model. The simulated results on pressing force, ejecting force and residual stress show good agreement with experiments, which validate the plasticity model and its parameters for powder compaction.
3) The residual stresses exist mainly in a thin layer on the side surface and the axial compressive residual stresses prevail in the green PM compact. The FE simulated maximum axial and hoop compressive residual stresses on the side surface are -97.5 MPa and -90.93 MPa, respectively. The residual stresses on the central top and bottom surfaces are only several MPa and may be negligible.
4) Rigid body definition of the die should be avoided in modeling and simulating the ejection process and the residual stress of the green PM compact. To get higher simulation accuracy, finer mesh size is recommended within the available computational power of computers.
Acknowledgments
The authors are grateful for the X-ray diffraction measurement of this work benefited from Proto iXRD at National Project Laboratories in China Petroleum Pipeline Bureau. The authors are also grateful to Mr Xue-quan YAO for his great help in the X-ray diffraction measurement of residual stress.
References
[1] HUANG Pei-yun. Powder metallurgical theory [M]. Beijing: Metallurgical Industry Publishing Press, 2011: 1-7. (in Chinese)
[2] LI Yuan-yuan, ZHAO Wei-bin, ZHOU Zhao-yao, CHEN Pu-qing. Coupled mechanical and thermal simulation of warm compaction [J]. Transactions of Nonferrous Metals Society of China, 2006, 16(2): 311-315.
[3] CHTOUROU H, GUILLOT M, GAKWAYA A. Modelling of the metal powder compaction process using the cap model. Part I: Experimental material characterisation and validation [J]. Int J Solids Struct, 2002, 39(4): 1059-1075.
[4] HE Zhao, WANG He-nan, WANG Meng-jun, LI Guang-yao. Simulation of extrusion process of complicated aluminium profile and die trial [J]. Transactions of Nonferrous Metals Society of China, 2012, 22(7): 1733-1737.
[5] KANG C S, LEE S C, TIM K T. Densification behavior of iron powder during cold stepped compaction [J]. Materials Science and Engineering A, 2007, 452-453(2): 359-366.
[6] YAZICI B A, KRAFT T, RIEDEL H. Finite element modelling of PM surface densification process [J]. Powder Metallurgy, 2008, 51(3): 211-216.
[7] KHOEI A R, AZAMI A R, AZIZI S. Computational modeling of 3D powder compaction processes [J]. Journal of Materials Processing Technology, 2007, 185(1-3): 166-172.
[8] ANDERSSON D C, LARSSON P, CADARIO A LINDSKOG P. On the influence from punch geometry on the stress distribution at powder compaction [J]. Powder Technology, 2010, 202(1-3): 78-88.
[9] CHTOUROU H, GAKWAYA A, GUILLOT M. Modelling of the metal powder compaction process using the cap model. Part II: Numerical implementation and practical applications [J]. Int J Solids Struct, 2002, 39(4): 1077-1096.
[10] SIMULIA Inc. Abaqus 6.9.1 theory manual [M]. Providence, USA: Software Corporation, 2009: 115-120.
[11] WU C Y, HANCOCK B C, MILLS A, BENTHAM A C, BEST S M, ELLIOTT J A. Numerical and experimental investigation of capping mechanisms during pharmaceutical tablet compaction [J]. Powder Technology, 2008, 181(2): 121-129.
[12] TU Ting-sheng, LIN Da-wei. A comment on the Poisson��s ratio model of sintered metal powder materials [J]. Metal Forming Technology, 2001, 19(2): 4-8. (in Chinese)
[13] WU C Y, RUDDY O M, BENTHAM A C, HANCOCK B C, BEST S M, ELLIOTT J A. Modelling the mechanical behavior of pharmaceutical powders during compaction [J]. Powder Technology, 2005, 152(1-3): 107-117.
[14] PROCOPIO A T, ZAVALIANGOS A, CUNNINGHAM J C. Analysis of the diametrical compression test and the applicability to plastically deforming materials [J]. Journal of Materials Science, 2003, 38(17): 3629-3639.
[15] COUBE O, RIEDEL H. Numerical simulation of metal powder die compaction with special consideration of cracking [J]. Powder Metallurgy, 2000, 43(2): 123-131.
[16] ERICSSON T, LARSSON C, PENG R L. Studies of residual stress, microcracks, hardness and microstructure of cold compacted metallic green bodies [C]//ENGELSKA M A. Materials Research Society Symposium Proceedings. Boston: ASM International, 2003: 53-64.
[17] BS EN 15305:2008. Non-destructive testing��test method for residual stress analysis by X-ray diffraction [S].
��������Drucker-Prager Capģ�͵Ľ�����ĩѹ������Ӧ����ֵ����
�� ������飬�ΰ��ң������
����ѧ �����װ����������켼���ص�ʵ���ң���� 300072
ժ Ҫ������������ Drucker-Prager Capģ�ͽ��������Ա���ģ�ͣ�������ά����Ԫģ�ͶԷ�ĩѹ�ƹ��̼�ѹ����ģ��ѹ���IJ���Ӧ�����з�����������ü������͵���ѧ���ܲ���ʵ��ȷ����ĩDistaloy AE��ģ�Ͳ�����ģ��ͨ���û��ӳ���USDFLDʵ�֣��Է�ĩDistaloy AE��ģѹ���̼���ģ��ѹ��(d20 mm��5 mm)�IJ���Ӧ������Ԥ�����������Ԫ���������ģѹʵ���X����ʵ���������Ǻϣ���֤��ģ�͵���Ч�ԡ����������ѹ���IJ�������һ�������IJ���ѹӦ������ѹ���ϱ�����±���IJ���Ӧ��ֵ���С��
�ؼ��ʣ�����Ӧ����ѹ������ֵ���棻����Drucker-Prager Capģ��
(Edited by Xiang-qun LI)
Foundation item: Project (2009ZX04004-031-04) supported by the National Science and Technology Major Project of the Ministry of Science and Technology of China
Corresponding author: Bai-yan HE; Tel: +86-22-27405294; E-mail: hebaiyan@tju.edu.cn
DOI: 10.1016/S1003-6326(13)62744-2
Abstract: Compaction process simulation and residual stress prediction of green PM compact were carried out with elasto-plastic 3D FEA based on the modified Drucker-Prager Cap model in Abaqus. The model parameters of the investigated powder Distaloy AE were determined as functions of relative density through typical mechanical property tests of powder. The model was implemented as a user subroutine USDFLD. Single sided compaction of a d20 mm��5 mm disk green compact of Distaloy AE was simulated, and the residual stress of the disk after ejection was predicted with FEA. The FEA results of the compaction process and the residual stress of the disk show good agreement with compaction experiments and X-ray diffraction measurements, which validates the model and its parameters. The results indicate that the compressive residual stresses exist mainly in a thin layer on the side surface, but the residual stresses are very small on the top and bottom surfaces.
