

J. Cent. South Univ. (2021) 28: 1244-1254
DOI: https://doi.org/10.1007/s11771-021-4692-z

Constitutive model and numerical simulation for injection molding of MgTiO3 ceramic parts
GU Xing-jian(���ǽ�)1, LIU Kai(����)1, 2, HU Jia-ming(������)1,DU Yan-ying(����ӭ)3, SUN Hua-jun(�ﻪ��)1, 2
1. School of Materials Science and Engineering, Wuhan University of Technology, Wuhan 430070, China;
2. State Key Laboratory of Silicate Materials for Architectures, Wuhan University of Technology,Wuhan 430070, China;
3. School of Logistics Engineering, Wuhan University of Technology, Wuhan 430070, China
 Central South University Press and Springer-Verlag GmbH Germany, part of Springer Nature 2021
Abstract:
In order to predict the powder flow law of the injection molding process of MgTiO3 ceramic parts with complex structures, a constitutive model and numerical simulation method for MgTiO3 ceramic injection molding were established based on the Hunt method. The material parameters of MgTiO3 such as elastic modulus, Poisson ratio, glass transition temperature, thermal conductivity and specific heat capacity were measured. Based on the fitting curve and the material parameters measured, the cross-WLF viscosity model and P-V-T model required for MgTiO3 ceramic injection molding were optimized. Furthermore, the influence of process parameters on mold filling flow and distribution of parts defects was researched. It was found that the gate position, injection speed and melt temperature have greater influence on mold filling flow and the packing process has an obvious effect on parts�� defects. On this basis, the MgTiO3 ceramic parts injection molding experiment verification was carried out. By comparing the experimental results with the simulated results, it is found that the deformation error is within 1.5% and the density error is within 1%. Therefore, this research provided theoretical guidance for the engineering application of MgTiO3 ceramic parts fabricated by injection molding.
Key words:
MgTiO3; ceramic injection molding; constitutive model; process parameters��
Cite this article as:
GU Xing-jian, LIU Kai, HU Jia-ming, DU Yan-ying, SUN Hua-jun. Constitutive model and numerical simulation for injection molding of MgTiO3 ceramic parts [J]. Journal of Central South University, 2021, 28(4): 1244-1254.
DOI:https://dx.doi.org/https://doi.org/10.1007/s11771-021-4692-z1 Introduction
Due to the characteristics of high quality factor, high dielectric constant, low microwave loss, and small temperature coefficient, MgTiO3 ceramic is increasingly used as main material of 5G filters [1]. Filter parts generally have many complex structures such as holes and grooves. The traditional fabricating methods of MgTiO3 parts mainly include CNC machining and dry pressing. Because of high hardness and low material utilization, it is difficult and expensive to obtain filter parts by CNC machining. In addition, dry pressing has limited plastic forming capacity at room temperature, which is not suitable for complex structures. At the same time, dry pressing method has the problem of uneven density distribution in the final molded body due to the relatively large friction between the upper and lower molds during the molding process. Therefore,powder injection molding (PIM) technology is increasingly used to prepare ceramic parts with high dimensional accuracy, complex shape and high density.
Ceramic injection molding (CIM), as one of important ceramic forming technologies, is suitable for fabricating ceramic parts with high dimensional accuracy, complex shape and high density [2]. In the molding process, ceramic powder and thermoplastic organic binder were mixed and heated to be molten, and then injected into a mold with a relatively low temperature. After cooling and solidification in the mold, the green body was finally ejected and demolded. KIHARA [3] found that the quality of the injection body was affected by the fluidity of the feed, which was influenced by ceramic powder size and particle shape. TSENG et al [4] proposed that the molding process is mainly affected by the molding parameters. The injection machine barrel temperature, plunger thrust, molding time, demolding time interval, and mold temperature may cause unqualified molding samples in actual production. TOSELLO et al [5] presented a comprehensive characterization and material modeling method for simulation validation of zirconia ceramics injection molding. YAN et al [6] used the material database of CAE software to simulate and analyze the injection molding process of ceramic screw components, and established the best gate scheme and the best technological parameters. At present, scholars mainly focus on the research of experimental parameters optimization and simulation of ceramic injection molding. However, so far, there is no study on constitutive model and numerical simulation for injection molding of MgTiO3 ceramic parts.
In this research, the filling process and injection defects of ceramic injection molding were analyzed based on Hunt method. The cross-WLF viscosity model and P-V-T model required for MgTiO3 ceramic injection molding were optimized.This work laid a foundation for the research on powder evolution law of ceramic injection molding and the improvement of products�� percent of pass.
2 Material parameters and models
The research plan for MgTiO3 ceramic injection molding numerical simulation in this paper is shown in Figure 1.
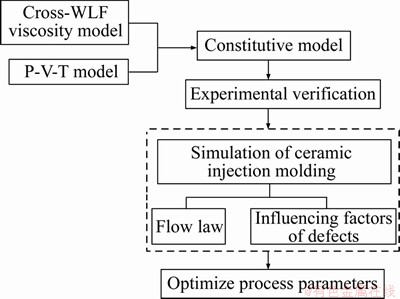
Figure 1 Research route for MgTiO3 ceramic injection molding numerical simulation
2.1 Material parameters
The present simulating work was carried out in finite element software Moldflow. The CIM material database built in Moldflow does not have MgTiO3 ceramics. Therefore, the parameters of MgTiO3 material, including the elastic modulus, Poisson ratio, solid density, melt density, glass transition temperature, thermal conductivity and specific heat capacity at 25 ��C were tested, which were not built in material database of Moldflow.
The average particle size of the MgTiO3 powder used is about 1 ��m. The organic adhesives includes 55 wt% paraffin wax, 10 wt% polyethylene (PE) and 35 wt% stearic acid. The non-contact full-field strain test system DIC was utilized to test the elastic modulus and Poisson ratio of the MgTiO3 injection material. Archimedes method was used to measure the solid density and melt density of the injection material, and the DTA method (DSC) was used to measure the glass transition temperature Tm of the injection material. Thermal conductivity tester (QTM-500) and microcalorimeter (C80) were used to measure the thermal conductivity and specific heat capacity of MgTiO3 injection material at room temperature. Material parameters were tested as shown in Table 1.
Table 1 Basic parameters of injection material

2.2 Constitutive model
To establish the simulation of MgTiO3 ceramic injection molding, two important theoretical models are indispensable. One is the cross-WLF viscosity model [5], which is the default model of many simulation softwares and is often used to describe the viscosity and shear thinning effects of polymers. This model combines the Newtonian fluid zone under low shear rate and the power law fluid zone (non-Newtonian fluid zone) under high shear rate, and describes the relationship between viscosity and shear rate in a larger range. The cross-WLF viscosity model can be expressed as the following equation:
 (1)
(1)
where �� is the melt viscosity (Pa��s); ��0 is the zero shear viscosity, or ��Newton limit�� (in this case, when the shear rate is very low, the viscosity is close to a constant);  is the shear rate (1/s); ��* represents the critical stress level during shear thinning, which is determined by curve fitting; n represents the power law exponent in the high shear rate method, which is determined by curve fitting.
During the injection and filling processes, the shape of the feed undergoes a solid-melted-solid change with temperature. Therefore, temperature should be considered in the viscosity model. After consulting related literature, the Williams-Landel-Ferry (WLF) equation can be applied to the zero shear rate viscosity in order to introduce the viscosity dependence on temperature. The zero shear rate viscosity can be expressed as:
 (2)
(2)
where T is the temperature; T* is the glass transition temperature, which is determined by curve fitting; P is the pressure (Pa); D1, A1,
  and D3 are the coefficients of the fitting data [7].
A high-pressure capillary rheometer was used to measure the relationship between viscosity and shear rate, and the fitted viscosity curve is shown in Figure 2.
In addition to the viscosity model, another theoretical model that is very important for CIM simulation analysis is the P-V-T model [8, 9]. It describes the data of material specific volume (1/density) as a function of temperature and pressure.
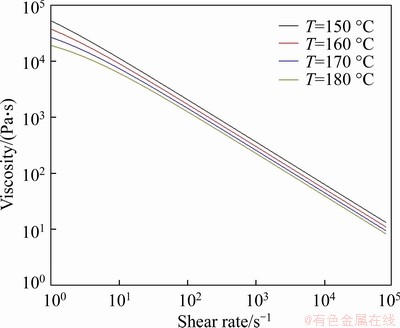
Figure 2 Fitted cross-WLF viscosity curve of MgTiO3 injection material
The P-V-T model describes the temperature-pressure relationship of the injection material in the entire processing range, and its description curve is generally given by the modified Tait model of the two-phase region:
 (3)
(3)
where C=0.0894, which is a constant. The solid phase and the molten phase divided by the glass transition temperature Tm are dual domains, where the glass transition temperature Tm is expressed as:
 (4)
(4)
In the area where the injection material is solid phase, that is, temperature T��Tm (low temperature area), the unknown function in Formula (3) is as follows:

 (5)
(5)
On the contrary, in the area where the injection material is in the molten phase, that is, the temperature T>Tm (high temperature area), the unknown function in Formula (3) is as follows:

 (6)
(6)
The unknowns b1s, b2s, b3s, b4s, b1m, b2m, b3m, b4m, b5, b6, b7, b8 and b9 in Formulas (4)-(6) are fitting coefficients [5, 8-10].
We used the PVT-500 tester to measure the relationship among pressure, volume, and temperature by iso-pressure method as shown in Figure 3.

Figure 3 Fitted P-V-T curve of MgTiO3 injection material
3 Results and discussion
The structure of MgTiO3 part simulated in the research is a rectangular block with four through holes and two blind holes symmetrically distributed on the upper surface of the block. The length, width and height are 55 mm, 20 mm and 5 mm, respectively. The diameter of the six holes is 4 mm, and the depth of the blind hole is 2 mm. The three-dimensional diagram is shown in Figure 4:
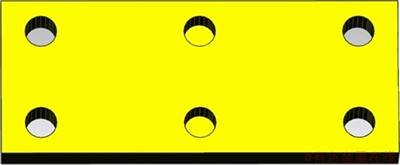
Figure 4 Three-dimensional diagram of standard sample
3D model of the part was established by using modeling software UG or Pro/e and then imported into Moldflow for meshing and subsequent mold flow analysis.
3.1 Influence of process parameters on CIM
3.1.1 Gate location
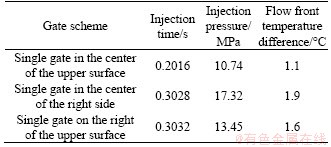
This simulation study designed four gate options for comparison: 1) single gate in the center of the upper surface; 2) single gate in the center of the right side; 3) single gate on the right of the upper surface. The temperature analysis results of the flow front are shown in Figure 5 and Table 2.
In Figure 5 and Table 2, it is concluded that the single gate at the center of the upper end face is the most suitable gate solution because the injection pressure and the temperature difference of the flow front are the smallest among the three gates. In particular, the temperature difference at the flow front will affect such defects as shrinkage, warping and deformation [11].
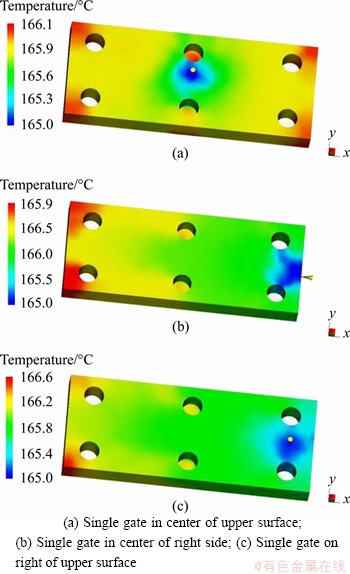
Figure 5 Temperature cloud map of flow front of different gate schemes:
Table 2 Injection time, injection pressure, and flow front temperature difference of each gate plan
3.1.2 Injection speed
In this simulation, we selected injection speed of 10, 20, 30, 40, 50, 60, 70, 80, 90 and 100 cm3/s to compare and study its influence on the CIM process and molding defects.
The shrinkage deformation of the standard sample is corrugated with the gate position as the center, and reaches the maximum at the edge from Figure 6. It can be seen from the graph of Figure 7 that the shrinkage deformation at the edge decreases with the increase of the injection speed, and a sudden change occurs when the injection speed is 90 cm3/s.
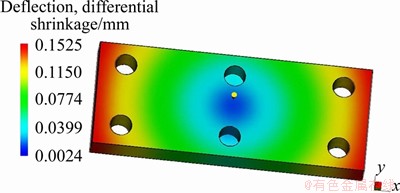
Figure 6 Shrinkage deformation of sample when injection speed is 50 cm3/s
The air traps of the injection-molded standard sample are mainly concentrated at the hole wall and the corners of the rectangular block, and their number will decrease with the increase of the injection speed (especially the inner hole wall). The number of weld lines will also be reduced, but the reduction is not as obvious as air traps, as shown in Figure 8.
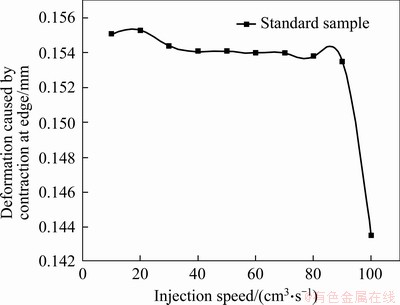
Figure 7 Shrinkage deformation at edge of standard specimen at different injection speeds
It can be seen from Figure 9(a) that as the injection speed increases, the filling time of the CIM is reduced accordingly. It can be seen from Figures 9(b) and (c) that as the injection speed increases, the injection pressure increases, but the temperature difference at the flow front decreases sharply and then slowly increases. When the injection speed is 10 cm3/s, the filling time and the temperature difference of the flow front are very large, indicating that the injection speed is too low, and the melt may stagnate during the CIM process, resulting in underfilling. When the injection speed reaches 80 cm3/s, the filling time shortens not as much as before. Similarly, the injection pressure also stabilizes after the injection speed reached 80 cm3/s, at about 14.5 MPa. The reason for this phenomenon is that the injection material used in ceramic injection molding is a non-Newtonian fluid, which has a shear thinning effect. It can be seen from Figure 9(d) that as the injection speed increases, the shear strain rate of the melt also increases. Due to the decrease of viscosity led by shear thinning characteristics, the injection pressure required decreases accordingly.

Figure 8 Air traps and weld line distribution of standard specimens at different injection speeds:

Figure 9 Effect of injection speed on filling time (a), injection pressure (b), flow front temperature difference (c) and shear rate (d)
3.1.3 Melt temperature
The melt temperature during injection also plays a vital role in the CIM process [12]. In this study, 6 sets of temperatures higher than the glass transition temperature of the feed were selected for simulation analysis, and the air traps distribution obtained is shown in Figure 10.
It can be seen from Figure 10 that within 150-175 ��C, the number of air traps in the MgTiO3 ceramic structure increases first and then decreases as the melt temperature increases during injection. However, the air traps at the eight vertices of the structural parts are not reduced. This may be because the corners are the last places where the melt flows in the cavity, and the entrained gas forms air traps because the melt temperature is too low to be discharged [13, 14].
Figure 11 shows the relationship between the warpage deformation simulation results of the MgTiO3 ceramic structure and the melt temperature.

Figure 10 Air traps distribution at different injection temperatures
It can be seen that the warpage deformation reaches the minimum when the melt temperature is 175 ��C. At the same time, we can find that the warping deformation of structural parts mainly exists in the x direction, followed by the y direction, and the z direction has the smallest deformation (The length direction of the ceramic structure is x direction, width direction is Y direction, and height direction is z direction, where x and y directions are perpendicular to the injection direction, and z direction is parallel to the injection direction).
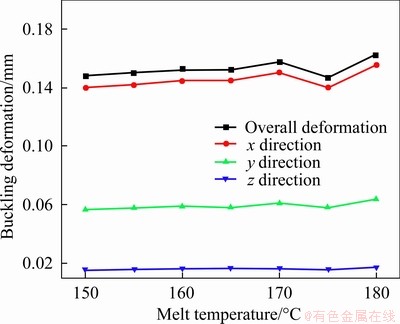
Figure 11 Relationship curve between melt temperature and warpage
3.1.4 Pressure holding process
The influence of two factors of holding pressure on the CIM process of MgTiO3 ceramic structure was studied. One is the holding pressure and the other is the holding time [15, 16]. From Figures 12 and 13, it can be found that the effect of holding pressure on CIM warpage is similar to that of melt temperature. That is, the deformation mainly exists in the x direction, the y direction is the second, and the z direction is the least, and the deformation is the largest at the edge of each direction.
Figure 14 shows the relationship between the packing pressure and the density of the MgTiO3 ceramic structure after packing. The fitted curve is a linear function curve. The mathematical equation of the fitted curve is y=0.000654645x+3.3564. The density of the parts after holding pressure increases with the increase of holding pressure, and the relationship between density and holding pressure is linear.
Figures 15 and 16 show the simulation results of the influence of holding time on the CIM of MgTiO3 ceramic part [17]. It can be found that as the holding time becomes longer, the buckling deformation of the part does not change significantly, but the influence of the deformation in each direction on the total deformation and the holding pressure is akin. Figure 16 shows that as the holding time increases, the density of the parts increases, and it hardly increases after 10 s. The reason for this phenomenon is that as the holding pressure progresses, the melt fills the cavity, and the density of the part is difficult to increase after reaching 2.352 g/cm3, and increasing the holding pressure time is just a waste of energy [18, 19].
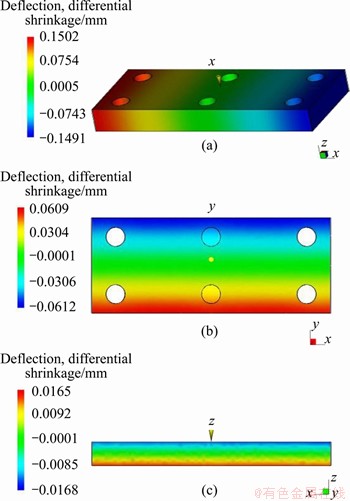
Figure 12 Deformation in x, y, z directions when holding pressure is 5 MPa
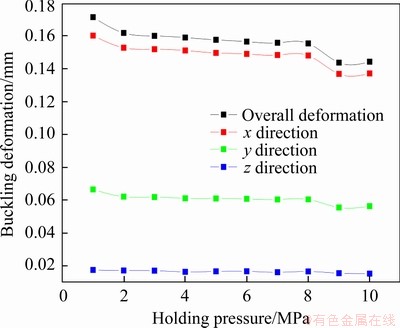
Figure 13 Relationship curve between packing pressure and warpage
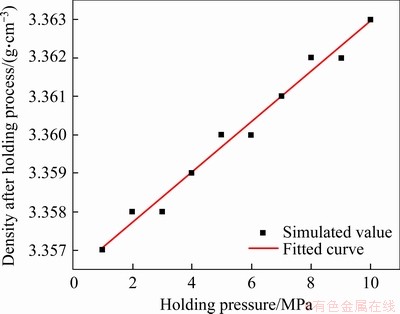
Figure 14 Relationship between packing pressure and density
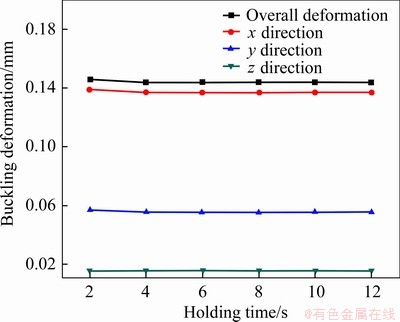
Figure 15 Relationship curve between holding time and buckling deformation

Figure 16 Relationship between hold time and density
3.2 Injection test verification
The experiment under the condition of a single gate at the center of the upper surface, the injection speed of 50 cm3/s, the injection temperature of 175 ��C, the holding pressure of 9 MPa, and the holding time of 10 s was carried out to verify the constitutive model. The deformations of the sample in x, y and z directions were measured by using a helical micrometer [20-22]. The resulting sample is shown in Figure 17. The comparison between simulation results and verification results is shown in Table 3.
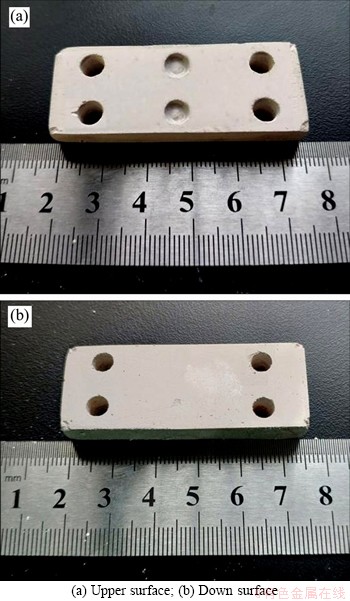
Figure 17 Sample diagram:
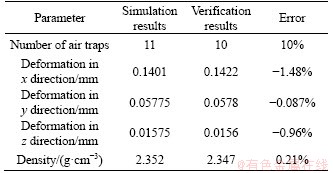
Table 3 Comparison between simulation results and verification results
Comparing Figure 17 with Figure 8, the distribution of defects such as air traps on the standard sample used to verify the accuracy of the constitutive model is basically consistent with the simulation results. For example, small air traps were found at the eight corners and through holes in the lower left corner of the sample.
In Table 3, there is a relatively large error between the simulation results of the number of air traps and the results verified by experiments. On the contrary, the deformation in x, y, z directions and the density obtained by the simulation have a high accuracy, which are not much different from the results obtained by the experiments.
4 Conclusions
In this paper, with the help of Moldflow software, the injection molding process of MgTiO3 ceramic structure is simulated. We first proposed the test method of material parameters, and then constructed the constitutive model of injection molding of MgTiO3 ceramic structural parts based on the obtained material parameters. Finally, we discussed the influence of process parameters on injection molding buckling deformation and air traps defects. The main conclusions are as follows:
1) The single gate in the center of the upper surface is most suitable for this kind of symmetrical MgTiO3 ceramic structure, and the temperature difference and injection pressure of the flow front are the smallest.
2) The injection speed, melt temperature and packing pressure have a great influence on the buckling deformation, and the buckling shrinkage deformation is corrugated with the gate position as the center, and the edge reaches the maximum value, which is about 0.155 mm.
3) From the verified experimental results, there are 10 tiny air traps on the sample. The deformation in the x direction is 0.1422 mm, the deformation in the y direction is 0.0578 mm, and the deformation in the z direction is 0.0156 mm. The density of the sample is 2.347 g/cm3.
4) In general, the numerical simulation of MgTiO3 ceramic injection molding has a high accuracy, and the margin of error is mostly within 1%, which has a great guiding significance for the actual manufacturing.
Contributors
The overall research goals were formulated by LIU Kai, GU Xing-jian, DU Yan-ying and SUN Hua-jun. GU Xing-jian, HU Jia-ming and DU Yan-ying established a model and performed simulations. GU Xing-jian, LIU Kai and SUN Hua-jun analyzed the simulation results. The first draft of the manuscript was written by GU Xing-jian and HU Jia-ming. All authors responded to the reviewers�� comments and revised the final version.
Conflict of interest
GU Xing-jian, LIU Kai, HU Jia-ming, DU Yan-ying, and SUN Hua-jun declare that they have no conflict of interest.
References
[1] GONG Wei. Phase stability and anti-reduction sintering of magnesium metatitanate microwave dielectric ceramics [D]. Wuhan: Huazhong University of Science and Technology, 2018. (in Chinese)
[2] ZHOU Gang, FENG Long-biao, ZHOU Zhi-yong, XIAO Heng, LI Xiao-hui. Ceramic powder injection molding technology and research progress [J]. Materials Research and Application, 2018, 12(2): 75-81. (in Chinese)
[3] KIHARA J. Powder-binder flow simulation in injection moulding [J]. Antioxidants & Redox Signaling, 2000, 2(4): 739-752.
[4] TSENG W J, CHIANG D. Influence of molding variables on defect formation and mechanical strength of injection-molded ceramics [J]. Journal of Materials Processing Technology, 1998, 84(1-3): 229-235.
[5] TOSELLO G, MARHOFER D M, ISLAM A, MULLER T, PLEWA K, PIOTTER V. Comprehensive characterization and material modeling for ceramic injection molding simulation performance validations [J]. The International Journal of Advanced Manufacturing Technology, 2019, 102: 225-240.
[6] YAN Zhi-yun, YAN You-lan. Powder injection molding simulation analysis of ceramic screw [J]. Plastics Manufacture, 2010(4): 89-92. (in Chinese)
[7] KIHARA S, GOUDA T, MATSUNAGA K, FUNATSU K. Numerical simulation of three-dimensional viscoelastic flow within dies [J]. Polymer Engineering and Science, 1999, 39(1): 152-163.
[8] HUNT K N, EVANS J R G, WOODTHORPE J. Computer modelling of the origin of defects in ceramic injection moulding [J]. Journal of Materials Science, 1991, 26(19): 5229-5238.
[9] HUNT K N, EVANS J R G, WOODTHORPE J. Computer modelling of the origin of defects in ceramic injection moulding [J]. Journal of Materials Science, 1991, 26(19): 5229-5238.
[10] HUNT K N, EVANS J, WOODTHORPE J. Computer modelling of the origin of defects in ceramic injection moulding-Part I Measurement of thermal properties [J]. Journal of Materials Science, 1991, 26(2): 285-291.
[11] KWON T H, PARK J B. Finite element analysis modeling of powder injection molding filling process including yield stress and slip phenomena [J]. Polymer Engineering & Science, 1995, 35(9): 741-753.
[12] HWANG C J, KWON T H. A full 3D finite element analysis of the powder injection molding filling process including slip phenomena [J]. Polymer Engineering & Science, 2010, 42(1): 33-50.
[13] HU Peng-cheng. Ceramic injection molding technology and research progress [J]. China Ceramic Industry, 2018, 25(5): 14-18. (in Chinese)
[14] ATTIA U M, ALCOCK J R. Fabrication of ceramic micro-scale hollow components by micro-powder injection moulding [J]. Journal of the European Ceramic Society, 2010, 30(6): 1199-1204.
[15] RUH A, HANEMANN T, HELDELE R, PIOTTER V, RITZHAUPT-KLEISSL H J, HAUSSELT J, HANEMANN T, HELDELE R, HAUSSELT J. Development of two-component micropowder injection molding (2C MicroPIM): Characteristics of applicable materials [J]. International Journal of Applied Ceramic Technology, 2011, 8(1): 194-202.
[16] GERMAN R M, HENS K H. Identification of the effects of key powder characteristics on powder injection moulding [J]. Metal Powder Report, 1992, 47(10): 55.
[17] DENG Li-jian, QIAO Liang, ZHENG Jing-wu,YINGYao, YU Jing, LI Wang-chang, CHE Sheng-lei, CAI Wei. Injection molding, debinding and sintering of ZrO2 ceramic modified by silane couping agent [J]. Journal of the European Ceramic Society, 2019, 40(4): 1566-1573.
[18] ENRIQUEZ E, BERGES C, FUERTES V, GALLEGO A, NARANJO J A, HERRANZG, FERNANDEZ J F. Ceramic injection Moulding of engineered glass-ceramics: Boosting the rare-earth free photoluminescence [J]. Ceramics International, 2020, 46(7): 9334-9341.
[19] ESCOBAR C F, DOS SANTOS L A. New eco-friendly binder based on natural rubber for ceramic injection molding process [J]. Journal of the European Ceramic Society, 2015, 35(13): 3567-3575.
[20] LENZ J, ENNETI R K, ONBATTUVELLI V, KATE K, MARTIN R, ATRE S. Powder injection molding of ceramic engine components for transportation [J]. JOM, 2012, 64(3): 388-392.
[21] HNATKOVA E, HAUSNEROVA B, FILIP P. Evaluation of powder loading and flow properties of Al2O3 ceramic injection molding injection materials treated with stearic acid [J]. Ceramics International, 2019, 45(16): 20084-20090.
[22] XIAO Jie, ZENG Xiao-yuan, LI Mian, DONG Peng, WU Hao, XU Ming-li, LIN Yan, LIU Jiang, XIE Yong-min. Effect of pre-calcined ceramic powders at different temperatures on Ni-YSZ anode-supported SOFC cell/stack by low pressure injection molding [J]. Ceramics International, 2019, 45(16): 20066-20072.
(Edited by HE Yun-bin)
���ĵ���
MgTiO3�մ����ע����ͱ���ģ�ͼ���ֵģ��
ժҪ��Ϊ��Ԥ��ṹ���ӵ�MgTiO3�մ����ע��������еķ�ĩ�������ɣ����Ļ���Hunt����������MgTiO3�մ�ע����͵ı���ģ�ͺ���ֵģ�ⷽ����������MgTiO3�IJ��ϲ������絯��ģ�������ɱȡ�������ת���¶ȡ�����ϵ���ͱ����ݡ�����������ߺͲ�õIJ��ϲ������Ż���MgTiO3�մ�ע����������Cross-WLFճ��ģ�ͺ�P-V-Tģ�͡����⣬�о��˹��ղ�����ע�����������������ȱ�ݷֲ���Ӱ�졣������֣�����λ�á�ע���ٶȺ������¶ȶ�ע��������������Ӱ����������̶������ȱ�������Ե�Ӱ�졣�ڴ˻����ϣ�������MgTiO3�մ������ע�����ʵ����֤��ͨ����ʵ������ģ�������бȽϣ����ֱ��������1.5%���ڣ��ܶ������1%���ڡ����о�ΪMgTiO3�մ����ע����͵ĵĹ���Ӧ���ṩ������ָ����
�ؼ��ʣ�MgTiO3���մ�ע����ͣ�����ģ�ͣ����ղ���
Foundation item: Project(2018CFB439) supported by the Hubei Province Natural Science Foundation, China
Received date: 2020-12-04; Accepted date: 2021-02-04
Corresponding author: DU Yan-ying, PhD, Lecturer; Tel: +86-13349918973; E-mail: 2422951672@qq.com; ORCID: https://orcid.org/ 0000-0002-8410-3714
Abstract: In order to predict the powder flow law of the injection molding process of MgTiO3 ceramic parts with complex structures, a constitutive model and numerical simulation method for MgTiO3 ceramic injection molding were established based on the Hunt method. The material parameters of MgTiO3 such as elastic modulus, Poisson ratio, glass transition temperature, thermal conductivity and specific heat capacity were measured. Based on the fitting curve and the material parameters measured, the cross-WLF viscosity model and P-V-T model required for MgTiO3 ceramic injection molding were optimized. Furthermore, the influence of process parameters on mold filling flow and distribution of parts defects was researched. It was found that the gate position, injection speed and melt temperature have greater influence on mold filling flow and the packing process has an obvious effect on parts�� defects. On this basis, the MgTiO3 ceramic parts injection molding experiment verification was carried out. By comparing the experimental results with the simulated results, it is found that the deformation error is within 1.5% and the density error is within 1%. Therefore, this research provided theoretical guidance for the engineering application of MgTiO3 ceramic parts fabricated by injection molding.
