
J. Cent. South Univ. Technol. (2011) 18: 1962-1968
DOI: 10.1007/s11771-011-0929-6![]()
Development of two-axis control index table driven by direct drive motors
KIM Jae-hyun, LEE Choon-man
School of Mechatronics, Changwon National University, Changwon 641-773, Korea
? Central South University Press and Springer-Verlag Berlin Heidelberg 2011
Abstract:
The stability and reliability of a tilting index table should be considered at the design stage. A design method for the lightweight and improvement of the stability of the structure in a tilting index table was proposed using a commercial analysis program, ANSYS Workbench 12, by analyzing the static-thermal characteristics of the developed high-accuracy tilting index table at its design stage. The results of the performed structural analysis show that the maximum stress is generated at the stock tail part. An optimum design for the stock tail part was carried out to reduce the maximum stress and deformation. Also, the design variables were determined by considering the support of the stock tail part for the C-axis body. In the comparison of the results before and after the optimization, the maximum deformation and stress are improved by 2.8% and 8%, respectively.
Key words:
tilting index table; structural analysis; modal analysis; thermal analysis; optimum design��
1 Introduction
A tilting index table is a high accuracy machine that can operate a two-axis machining center, which consists of rotation and tilt axes, and can build a four-axis or five-axis machining center by installing it to a computer numerical control (CNC) machine tool. Thus, such a tilting index table has been largely used in the machining process for important machine parts, such turbine blades [1], impellers [2], aircraft parts [3], molds, and dies [4]. Recently, there are limited studies on the tilting index table like a field of accuracy analysis. PARK et al [5] applied an optical laser measuring device as a new method for performing the analysis and compensation of geometric errors in the tilting index table. Also, LEE et al [6] established a numerical model for the geometric error in the tilting table and analyzed the model. JUNG et al [7] performed a study on the development of the post processing of the recently developed tilting table. Also, SORBY et al [8] performed an analysis for the inverse kinematics of a five-axis machine tool by applying the tilting index table.
However, although the tilting index table is a core unit in CNC machining centers for improving their function and performance, there are few studies on the lightweight design and high accuracy for the tilting index table [9-10].
In the recent machine tools, although developments for the high speed and miniaturization in machine tools have been achieved, some structural disadvantages are recognized due to the heavy weight and large size machining centers. Figure 1 depicts the first tilting index table developed in this work where it requires lightweight and high stiffness designs. Thus, it is necessary to verify the static-thermal characteristics which affect the machining accuracy in machining processes. The design for improving the static-thermal stability is to be considered from the design stage by estimating these characteristics precisely.
In this work, a design method for the lightweight and improvement of the stability of the structure in the tilting index table is presented by analyzing the static-thermal characteristics of the developed high- accuracy tilting index table at its design stage. Also, the validity of the optimum design for the tilting index table is also verified by applying it to the overall system.
2 Design of tilting index table
The development of a tilting index table for five- axis machining center applies direct drive (DD) motors by changing the operation mechanism applied to the existing high-accuracy worm gears or reduction mechanisms [9-10]. As DD motors are applied to a tilting index table, there are no problems of causing backlash and torque loss compared to the conventional reducers. In addition, there are no problems in maintaining it for wear and lubrication. Thus, DD motors can be applied to perform high accuracy and high speed positioning and that leads to present a small variation in loads [11].
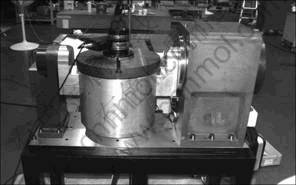
Fig.1 Fabricated tilting index table
Figure 2 represents a three-dimensional (3D) model for the structure of the tilting index table with motors performed by using CATIA V5 R17. The 3D model is modeled to maximally present its actual figure. The tilting index table consists of several parts, such as A-axis body, C-axis body, stock tail, plate, and table parts. The A-axis body and C-axis body parts include the DD motors.
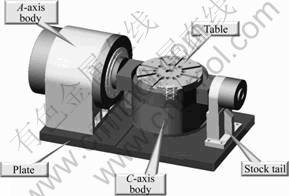
Fig.2 Structure of tilting index table
In this work, the tilting index table applied the DD motor with the maximum rotation angle of 150�� for the A-axis and the maximum rotation speed of 82 r/min. Also, the DD motor that has the maximum rotation angle of 360�� and the maximum rotation capability of 140 r/min was applied to the C-axis. The maximum load capability for this tilting index table was determined as 80 kg.
3 Finite element analysis
For verifying the design stability of the designed tilting index table, a 3D finite element analysis was applied to the structure. A finite element analysis tool, ANSYS Workbench V12, was used to perform the finite element analysis. Figure 3 shows that the finite element model that has 305 421 nodes and 98 891 elements. Table 1 shows the properties of the materials used in the tilting index table.
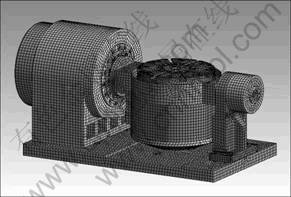
Fig.3 Finite element model
3.1 Structural analysis
A structural analysis was performed for the established finite element model. In the statistic structural analysis, the constraint condition was applied as a boundary condition in order to avoid certain rotations and movements at joint sections in each part. The bottom section contacted to the ground was fixed to prevent movements. In load conditions, the net weight was considered to the entire structure. Also, it was assumed that the maximum pay load capability, 800 N, would be applied to the tilting index table.
Figure 4 shows the distribution of the maximum deformation as the maximum live load, 800 N, was applied to the tilting index table. The maximum deformation was 0.84 ��m and generated at the lower section of the housing of the C-axis DD motor. A relatively large load was applied to the C-axis cover because the body of the C-axis DD motor was supported at both sides as the maximum live load was applied to the tilting index table. Figure 5 shows the maximum equivalent stress. The maximum stress was 1.61 MPa and generated at the stock tail part, which is the right side supporter. It is considered that there was no perfect symmetry between supporters of both sides because the stock tail part applied as the right side supporter was relatively small compared with the A-axis part applied as the left side supporter. For considering the yield strength of the material, 250 MPa, used in the stock tail part, the results of the structural analysis showed the safety of its design as the safety ratio for the maximum stress was 155.3.
Table 1 Material properties of tilting index table
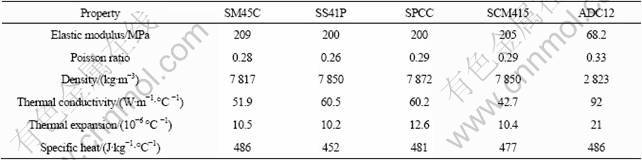
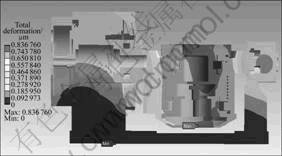
Fig.4 Deformation distribution of tilting index table
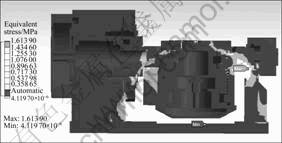
Fig.5 Stress distribution of tilting index table
Figure 6 represents the results of the maximum stress and deformation as the live loads varied as 200, 400, 600, and 800 N.
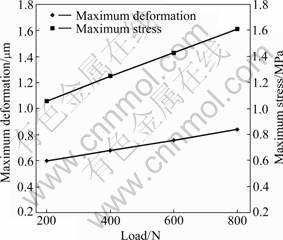
Fig.6 Maximum stress and deformation according to change in loads
3.2 Modal analysis
Vibrations are generated in all machine parts, and the influences of these vibrations are to be considered in their designs. In particular, if there is a resonance between the natural frequency and the external vibration in a structure, it will cause severe noises and vibrations and that leads to destroy even a strong structure. Therefore, a modal analysis was applied to verify the stability in its design whether it can avoid such a resonance region. Regarding the finite element model, a modal analysis was performed using the same model as that of the static structural analysis. In the boundary condition, the bottom section connected to the ground was fixed to prevent possible movements, and then the modal analysis was performed.
Based on the results of the modal analysis, in the verification of the system stability, the system can be safely operated from the resonance as the natural frequency region of the system is designed as a higher level than the operation region [10].
The maximum number of rotation and the frequency of the DD motor used in this tilting index table were 140 r/min and 2.3 Hz, respectively. It is recognized that this system is safe because it is operated at a very lower region than a frequency of 485.9 Hz determined as the frequency of the first mode. In addition, this system shows a very stable structure, which shows a large width and a low structure, because it is supported by a plate, which is fixed to the ground. Figure 7 represents the natural frequency in the sixth mode.
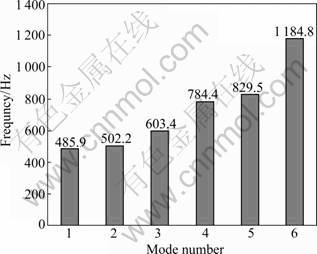
Fig.7 Modal frequency of tilting index table
3.3 Thermal analysis
It is important to accurately estimate the thermal characteristics that affect the precise positioning in order to ensure the stability of the tilting index table. Also, the analysis of the influence caused by heat is very important. Thus, a thermal analysis was performed to investigate the changes in temperature and thermal deformation caused by heat in the tilting index table by considering the A-axis and C-axis DD motors.
To implement the thermal analysis of this tilting index table, it was assumed that the heat source was determined by the A-axis DD motor in the tilting part and C-axis DD motor in the index part. In general, it is possible to estimate the entire heat generation rate of the DD motor based on the power consumption of the motor. Also, it is necessary to analyze the heat generation rate by dividing the motor into rotor and stator parts in order to more precisely estimate the heat transfer characteristics caused by heat generation [12]. Regarding the condition for convections, the heat transfer type was determined as a natural convection because there were no violent air flows in the boundary exposed to the air. Thus, the convection heat transfer coefficient was determined as 16 W/(m2��K). In addition, it was assumed that there were no thermal resistances in the contact sections between parts. In the analysis of heat distribution, the initial temperature of the tilting index table was determined as a uniform distribution for the entire system, and then the temperature was determined as 18 ��C as the same as ambient temperature. The heat generation in DD motors was also assumed as a heat generation rate with respect to the maximum rotation capability of the motors. Also, it was assumed that the bottom of the tilting index table was fixed at the ground and showed a condition of insulation.
The way of the heat transfer in DD motors is a type of thermal conductivity that transfers heat from a neighbor part to the next neighbor part. The heat generation rate in DD motors can be calculated using the Fourier thermal conductivity law presented in Eq.(1) as:
 (1)
(1)
where k is thermal conductivity rate.
Table 2 gives the heat generation rate of the motors by considering the power loss in the cooling jacket of the motors.
Table 2 Heat generation rate of DD motor
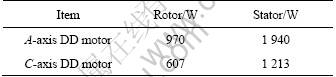
Figure 8 represents the temperature distribution of the tilting index table based on the results of the thermal analysis. The temperature measured at the stator of the A-axis DD motor was 52.644 ��C, and there were almost no influences of the heat generation caused by the DD motor on the table, which supports a workpiece.
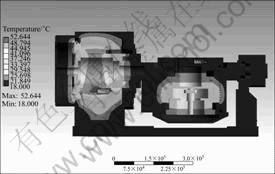
Fig.8 Temperature distribution of tilting index table
Figure 9 shows the deformation distribution of the tilting index table based on the results of the thermal-structure ductile analysis.
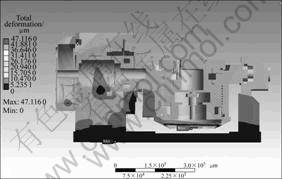
Fig.9 Deformation distribution of tilting index table
The deformation based on the thermal-structural ductile analysis was estimated as 47.43 ��m at the lower housing section of the C-axis DD motor.
3.4 Suggestion of an optimum design of stock tail part for stability
An optimum design for the stock tail part was considered for ensuring the stability of the tilting index table. The optimum design is an issue that finds the design variables for minimizing values in its objective function within the range that satisfies the given constraint condition. It can also be expressed by Eq.(2) [13] as
Min X(b)
s.t. ![]() (2)
(2)
where Nhc means the number of equality constraints, Ngc means the number of inequality constraints, X means the design variables (��1, ��2).
In the consideration of the results of the previously performed structural analysis, the maximum stress was generated at the stock tail part. It is considered that there was no perfect symmetry in this tilting index table and that leads to the maximum stress at the stock tail part because the A-axis body was relatively larger than the stock tail part. Therefore, an optimum design for the stock tail part was proposed to reduce the maximum stress and deformation of the stock tail part. The objective function in the optimum design was configured as the maximum stress and deformation of the stock tail part. Also, the design variables were determined by considering the support of the stock tail part for the C-axis body. Figure 10 shows the design variables employed in the stock tail part.
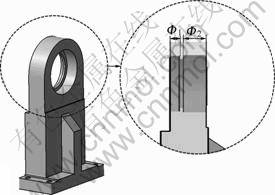
Fig.10 Design variables of stock tail part
The ranges of the design variables were configured within ��3 mm in order not to interfere the internal structure. The optimum design was obtained using the product engineering optimizer function of a commercial integration solution program, CATIA V5 R17.
Table 3 gives the comparison of the results before and after the optimization. In the optimum design, the design variable of ��1 increased from 7 mm to 9.575 mm, by 36%, and the design variable of ��2 decreased from 27 mm to 24.036 mm, by 13%. In addition, a structural analysis was performed using the same boundary and load conditions as the previously performed structural analysis applied by using the design variables employed in the optimum design. In the results, the maximum deformation that only considers the stock tail part decreased from 0.471 1 to 0.458 3, by 2.8%, and the maximum stress decreased from 1.613 9 MPa to 1.494 3 MPa, by 8%. Figure 11 shows the maximum deformation and stress values obtained by applying the design variables.
Table 3 Comparison of initial model with optimized model
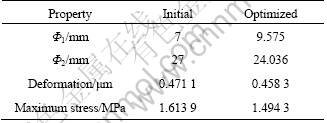
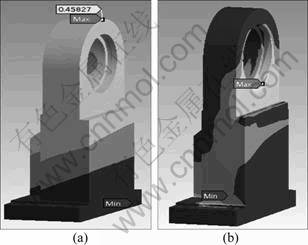
Fig.11 Results of optimized stock tail part: (a) Maximum deformation; (b) Maximum stress
4 Finite element analysis using optimum design
4.1 Structural analysis
A structural analysis for the tilting index table was performed by applying the same boundary condition as the existing analysis model. Figures 12 and 13 show the results of the structural analysis of the optimized tilting index table.

Fig.12 Deformation distribution of optimized tilting index table
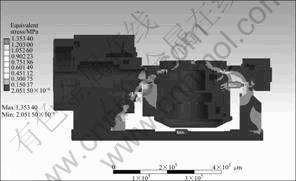
Fig.13 Stress distribution of optimized tilting index table
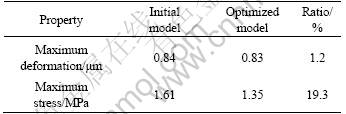
Table 4 gives the comparison of the structural analyses of the initial and optimized models. The maximum deformation decreased from 0.84 ��m to 0.83 ��m, by 1.2%, and the maximum stress decreased from 1.61 MPa to 1.35 MPa, by 19.3%.
Table 4 Comparison of structural analyses of two models
4.2 Modal analysis
A modal analysis for the tilting index table was performed by applying the same boundary condition as the existing analysis model. Figure 14 represents the mode shapes of the natural frequency of the model from the first model to the sixth mode on the basis of the optimum model.
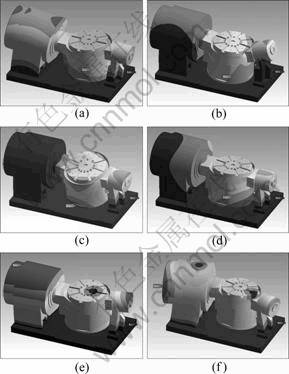
Fig.14 Mode shapes of optimized tilting index table: (a) 1st mode; (b) 2nd mode; (c) 3rd mode; (d) 4th mode; (e) 5th mode; (f) 6th mode
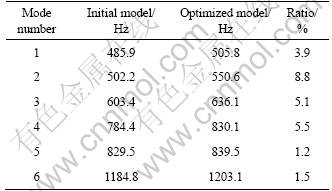
In the results of the modal analysis, the first mode showed a shape that was tilted to the stock tail part for the X-axis direction. The second mode showed a shape in which the table was tilted to the Y-axis direction. The third mode showed a twisted shape in which the X and Y axes were simultaneously tilted due to the translation motion and vibration. Table 5 gives the comparison of the results of the modal analyses of the initial and optimized models. In the model applied in this model, the maximum rotation and frequency of the DD motor were 140 r/min and 2.3 Hz, respectively. As it is operated at a very lower region than the frequency of the first mode, 505.8 Hz, this system can be considered as safe. In the comparison of the initial and optimized models, the frequency of the first mode increased from 485.9Hz to 505.8Hz, by 3.9%. Regarding the comparison of the entire results, all modes from the first to the sixth modes showed increases in the natural frequency after performing the optimization. Thus, it was verified that the optimized model is a very safe model from possible resonances.
Table 5 Comparison of modal frequencies of two models
5 Conclusions
1) The maximum deformation is presented at the lower section of the C-axis DD motor housing in the structural analysis. Based on the results, it is verified that these two cases are safe structures.
2) The tilting index table is operated within the operation speed range from the first to the sixth modes in the modal analysis. It is verified that it is safe from possible vibrations.
3) The heat generated by the DD motor does not affect the upper section of the table in the thermal analysis. It is considered that it is thermally safe.
4) An optimum design of the stock tail part was proposed. In the comparison of the system before and after the optimization, the maximum deformation and stress are improved by 2.8% and 8%, respectively.
5) In the comparison of the modal analyses before and after the optimization, it is possible to obtain a more stable model in all regions from the first to the sixth modes.
6) It is verified that the proposed optimum design is very adaptable. It is expected that the finite element analysis and optimization performed will be used as very useful data in the preliminary design stage for the tilting index table in future studies.
References
[1] MING L, BAOHAI W, DINGHUA L, SHAN L, YING Z. An efficient method for five-axis spiral NC machining of blade parts [J]. Journal of Mechanical Science and Technology, 2008, 27(7): 917-921.
[2] HEO E Y, KIM D W, KIM B H, JANG D K, CHEN F F. Efficient rough-cut plan for machining an impeller with a 5-axis NC machine [J]. Journal of Computer Integrated Manufacturing, 2008, 21(8): 971-983.
[3] KISHWAY H A, BECZE C E, MCLNTOSH D G. Tool performance and attainable surface quality during the machining of aerospace alloys using self-propelled rotary tools [J]. Journal of Materials Processing Technology, 2004, 152(3): 266-271.
[4] CHOI B K, KO K. C-space based CAPP algorithm for freedom die-cavity machining [J]. Journal of Computer Aided Design, 2003, 35(2): 179-189.
[5] PARK S R, HOANG T K, YANG S H. A new optical measurement system for determining the geometrical errors of rotary axis of a 5-axis miniaturized machine tool [J]. Journal of Mechanical Science and Technology, 2010, 24(1): 175-179.
[6] LEE J H, LIU Y, YANG S H. Accuracy improvement of miniaturized machine tool: Geometric error modeling and compensation [J]. International Journal of Machine Tools & Manufacture, 2006, 46(12): 1508-1516.
[7] JUNG H C, HWANG J D, PARK K B, JUNG Y G. Development of practical postprocessor for 5-axis machine tool with non-orthogonal rotary axes [J]. Journal of Central South University of Technology, 2011, 18 (1): 159-164.
[8] SORBY K, Inverse kinematics of five-axis machines near singular configurations [J]. International Journal of Machine Tools & Manufacture, 2007, 47(2): 299-306.
[9] DAEGU Machinery Institute of Components & Materials Foundation. Development of high-speed and intelligent machine tools used for cutting mold [R]. The Ministry of Knowledge Economy, 2008: 1-4.
[10] CHOI U D, High accuracy CNC index table development [M]. Sung Rim Co. Ltd., 2001: 1-9.
[11] LEE M J, LEE C M, A study on structural analysis and optimum shape design of tilting index table [J]. Journal of Korean Society Precision Engineering, 2009, 27(2): 86-93.
[12] KIM M S, KIM S R. Topology of a PCB substrate considering mechanical constraints and heat conductivity [J]. Journal of Mechanical Science and Technology, 2007, 21(12): 2041-2047.
[13] KIM H S, KEE Y S, Optimization design technique for reduction of sloshing by evolutionary methods [J]. Journal of Mechanical Science and Technology, 2008, 22(1): 25-33.
(Edited by DENG L��-xiang)
Foundation item: Project(70004782) supported by the Regional Strategic Technology Development Program of the Ministry of Knowledge Economy(MKE) of Korea; Project(2011-0017407) supported by the National Research Foundation of Korea (NRF) Funded by the Korea Government (MEST)
Received date: 2011-04-26; Accepted date: 2011-10-10
Corresponding author: LEE Choon-man, Professor, PhD; Tel: +82-55-213-3622; E-mail: cmlee@changwon.ac.kr
Abstract: The stability and reliability of a tilting index table should be considered at the design stage. A design method for the lightweight and improvement of the stability of the structure in a tilting index table was proposed using a commercial analysis program, ANSYS Workbench 12, by analyzing the static-thermal characteristics of the developed high-accuracy tilting index table at its design stage. The results of the performed structural analysis show that the maximum stress is generated at the stock tail part. An optimum design for the stock tail part was carried out to reduce the maximum stress and deformation. Also, the design variables were determined by considering the support of the stock tail part for the C-axis body. In the comparison of the results before and after the optimization, the maximum deformation and stress are improved by 2.8% and 8%, respectively.
