
J. Cent. South Univ. Technol. (2009) 16: 0987-0993
DOI: 10.1007/s11771-009-0164-6
![]()
Quantitative analysis of geological ore-controlling factors and
stereoscopic quantitative prediction of concealed ore bodies
MAO Xian-cheng(ë�ȳ�)1,2, ZOU Yan-hong(����)1,2, LU Xiao-qin(¬����)1,
WU Xiang-bin(�����)1,2, DAI Ta-gen(������)1,2
(1. School of Geoscience and Environmental Engineering, Central South University, Changsha 410083, China;
2. Key Laboratory of Metallogenic Prediction of Non-ferrous Metals of Ministry of Education,
Central South University, Changsha 410083, China)
Abstract:
To address the issues for assessing and prospecting the replaceable resource of crisis mines, a geological ore-controlling field model and a mineralization distribution field model were proposed from the viewpoint of field analysis. By dint of solving the field models through transferring the continuous models into the discrete ones, the relationship between the geological ore-controlling effect field and the mineralization distribution field was analyzed, and the quantitative and located parameters were extracted for describing the geological factors controlling mineralization enrichment. The method was applied to the 3-dimensional localization and quantitative prediction for concealed ore bodies in the depths and margins of the Dachang mine in Guangxi, China, and the 3-dimensional distribution models of mineralization indexes and ore-controlling factors such as magmatic rocks, strata, faults, lithology and folds were built. With the methods of statistical analysis and the non-linear programming, the quantitative index set of the geological ore-controlling factors was obtained. In addition, the stereoscopic located and quantitative prediction models were set up by exploring the relationship between the mineralization indexes and the geological ore-controlling factors. So far, some concealed ore bodies with the resource volume of a medium-sized mineral deposit are found in the deep parts of the Dachang Mine by means of the deep prospecting drills following the prediction results, from which the effectiveness of the predication models and results is proved.
Key words:
geological ore-controlling factor; concealed ore body; stereoscopic prediction��
1 Introduction
With the rapid and continuous growth of the Chinese economy, the replaceable resources of mines have been confronted with severe situations. The available mineral reservoirs are rapidly decreasing and even exhausting in many leading mines while the incremental reservoirs come into temporary shortage. Without enough replaceable resources being provided in time, these mines suffer from being closed in the near future. Obviously, this problem will exact significant pressure on the economic development and the social stability of China. Consequently, the issues about crisis mines have become the most prominent problem to restrict the sustainable development of mineral resources in China, which is crying for proposing new technology and method to effectively perform the prediction and assessment of mineral resources and the prospecting of the deep and margin parts in crisis mines[1-2].
The quantitative prediction and assessment methods of mineral resources were applied to the prospecting and evaluation work of regional mineral resource from 1970s to 1980s. By the end of the 1980s and the beginning of the 1990s, consummate theory and methodology of quantitative assessment had come into form. The most famous methods are the weights of evidence method proposed by BONHAM-CARTER and AGTERBERG [3-4], and the ��three parts�� resource evaluation method advocated by the US Geological Survey (USGS)[5]. In China, ZHAO[6] put forward a series of theories and methods for deposits statistical prediction. WANG et al [7] proposed the integrated information exploring model and method. The theories on quantitative prediction and assessment of mineral resources can be summed up as follows: theory for analogy and comparison, theory for anomaly seeking, and theory for quantitative com- bination of ore-controlling factors[6]. In recent years, with the development of information technology, digital mineral prospecting has become the main trend of metallogenic prediction[8]. On the basis of spatial database and GIS spatial analysis technology, the digital prediction and assessment methodology of mineral resources has been set up, whose core process is the��integrating multiple geo-spatial data��extracting and integrating multiple metallogenic information��mapping the potential of mineral resources��[9-21]. The theories and methods, however, have been evolved mainly from the prospective prediction and assessment of regional mineral resources. They cannot still be fully acclimatized to the new requirements that the prospecting target area of replaceable resources has been developed to the 3rd space, i.e. the depth and margin space, in crisis mines and old mines. Consequently, it is urgent to establish innovative prospecting systems and novel theories, techniques and methods for mineral resource evaluation, which are suitable for prospecting in the depth, margin and outside of crisis mine.
To address the issues about prospecting for replaceable resources of crisis mines, the research on the geological database[22-23], the quantitative analysis of geological ore-controlling effects and the 3-dimensional quantitative localization predication for concealed ore bodies was made by taking the Dachang Tin-polymetallic Deposit in Guangxi as an example in this work. Based on the geological, geophysical and geochemical raw data, the geological research achievements and the mine-prospecting experiences accumulated over the past years, a new evaluation method was constructed, which could be adaptable to prospecting replaceable resources in the depth, margin and outside of crisis mines. This method would make the prediction of concealed ore bodies 3-dimensional, locatable, quantitative and accurate, and ultimately provide accurate quantitative prediction results and exact 3-dimentional target locations for the prospecting in the deep and margin parts of crisis mines, which would help to significantly decrease the prospecting risk.
2 Quantitative analysis of ore-controlling geological factors
To predict the concealed ore bodies in the depth and the margin of a crisis mine, it is necessary to investigate the quantitative relation between the mineralization distribution and the ore-controlling geological conditions. It is an approach for performing a theoretical analysis on ore-formation process to analyze the ore-formation geological thermodynamic conditions and to deduce the ore-formation physical chemistry procedure. Some geologists made significant contributions to the field [24-25]. However, taking into account the complexity of geological effects and ore-formation procedures, the long-term geological reconstruction and destructive effects after ore-formation, accompanied with the hoary geological history, it is extraordinarily difficult for a geologist to accurately reproduce all the historical data of ore-formation procedures in the geological historical period, such as various physical-chemistry parameters and boundary conditions. As a result, these difficulties significantly bar the deduction method based on continuous ore-formation physical-chemistry equations from working out quantitative mineralization distribution models that could be applied to predicting the concealed ore bodies.
Modeling the ore-formation of physical-chemistry procedure is difficult. At the mean time it is very urgent to build models to predict concealed ore bodies. To address this dilemma, a new method was brought forward in this work. The new method, aiming at the demand for building models of predicating ore bodies, was designed only for finding some gross models that could approximately describe the integrated distribution and ore-controlling effects of the ore-formation physical- chemistry processes in geological space by directly analyzing the ore-controlling effects of geological conditions, instead of seeking the strict deduction of the ore-formation physical-chemistry procedures in the geological age.
The distributions of a geological ore-controlling factor in a geological space are actually the effects that the corresponding geological body brings on the geological surroundings over the special geological age. These effects are related with the distribution of the geological body itself. From the viewpoint of the field theory, a field model is appropriate to describe the influence of an object on the surrounding space, so field models could be applicable to express and analyze the distribution of geological ore-controlling effects. After working out the field models of geological ore-controlling effects, by discretizing the models, the associated relationship between the distribution of geological ore-controlling effects and the mineralization distribution could be analyzed by dint of the statistic analysis methods. Sequentially, the quantitative relationships between the geological conditions and the mineralization distribution control could be opened out.
2.1 Field models of geological ore-controlling effects
Following the types of geological ore-controlling factors, the field models from the geological ore-controlling effects were categorized into multiple classes. Taking the Dachang Tin-polymetallic Deposit in Guangxi as an example, there are five types of field models for the geological ore-controlling effects, involving magmatic rock field models, strata and lithology field models, fault field models, fold field models and mineralization distribution models. In the following, the discussion will mainly be focused on the magmatic rock ore-controlling field models of the Dachang Tin-polymetallic Deposit.
Dachang Tin-polymetallic Deposit is a typical polygenetic compound deposit, which initialed with an exhalative sedimentary mineralization, and then came into being at a late stage magmatic-hydrothermal superimposion-reformation. Consequently, the ore- controlling effect of the magmatic rock was represented as the energy-and-power being supplied for the mineralization and superimposion-reformation in the upper geological space. This energy-and-power is the integrated field with which the magma made effects on the geological space in the geological age. To simplify the field models, the Euclidean distance, i.e., the shortest distance between the magmatic body and a point in the geological space, and other related measurements were used to approximate the field models of the magmatic rock ore-controlling effects.
Let (xv, yv, zv) denote the coordinate of the central point of a cubic cell (voxel) in the geological space. The magmatic rock ore-controlling field model could be obtained as follows.
(1) The distance to the top surface of the magmatic body (the shortest distance between one point and the magmatic body) is:
![]() (1)
(1)
(x, y, z)��G: z=f(x, y)
where G: z=f(x, y) denotes the curved surface equation of the top surface of magmatic body.
(2) The first-order amplitude of the top surface of the magmatic body is:
r1G=R1(xmin, ymin) (2)
where R1 is the first-order amplitude equation of the top surface of the magmatic body, which is a simple trend equation acquired by the decomposition method of geological variables. (xmin, ymin, zmin) is the solution of ![]() .
.
(3) The second-order amplitude of the top surface of the magmatic body is:
r2G=R2(xmin, ymin) (3)
where R2 denotes the second-order amplitude equation of the top surface of the magmatic body.
2.2 Quantitative analysis of geological ore-controlling effects
The solving of the field models of geological ore-controlling effects described above, in nature, is a problem of nonlinear programming. If the curved surface equation defining the top surface of a magmatic body was a high-order one, it would be very difficult to directly solve it. The solutions are likely not to be convergent, even by means of various numerical solutions, such as Newton iterative method. As a consequence, a method of discretizing the continuous models to solve the above equations was introduced as follows.
(1) Discretize the magmatic body (namely voxelization), and then get a 3-dimensional grid model denoting the magmatic rock body.
(2) Calculate the Euclidean distance (dgi) between the central point of a voxel and all the voxels of the magmatic body. If there are n voxels in the magmatic body grid model, n distances could be worked out, denoted as dg1, dg2, ��, dgn.
(3) Find out the minimum one among the n distances, defined as min(dg1, dg2, ��, dgn). It is just the shortest distance between the central point of the voxel and the magmatic body.
Obviously, although this shortest distance is only an approximate solution of the aforementioned field models, it is feasible to be implemented with computer algorithm.
The shortest distances of all the voxels in the geological space of the research area could be calculated. At the mean time, from the sampling and assay data obtained from the exploration engineering, various mineralization indexes of the voxels, such as average grades of the samples, CSn, CZn, CCu, CPb and CSb, could also be acquired.
With the mineralization indexes of a voxel CSn, CPb (%) and the distance dG (m) between the voxel and the magmatic body serving as couples of variables, the scatter diagrams could be figured out to show the relationships of the couples (Fig.1).
As shown in Fig.1, there exists an associated relationship between the mineralization indexes CSn, CZn, CCu, CPb, CSb and the distance ore-controlling variable of the magmatic rock dG. However, this relationship is nonlinear instead of linear. To solve such nonlinear relationship and then to accurately locate the inside and outside mineralization zones, a nonlinear model was constructed as follows:
 (4)
(4)
where ��0, ��1, di and do are unknown parameters to be solved, and �� is a random variable whose mathematical expectation is zero.
Solving the above nonlinear regression equation with Newton iteration method, all di parameters were calculated in the corresponding equations of CSn, CZn and CCu. These di parameters are close, and then the di parameters are assigned an approximate value, viz. 650.0 m. Similarly, all do parameters in the corresponding equations of CPb and CSb are also close, and then the do parameters are assigned an approximate value 900.0 m.
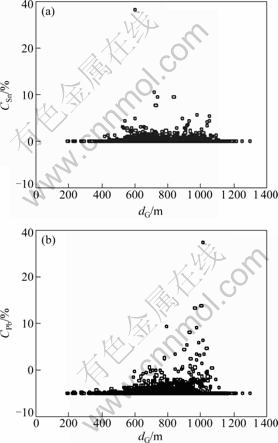
Fig.1 Scattered point diagrams of CSn��dG (a) and CPb��dG (b)
In other words, the distances between the inside outside mineralization zones and the nearest point of the top surface of magmatic body are respectively 650.0 and 900.0 m.
2.3 Extracting indexes from ore-controlling geological factors
With the aforementioned nonlinear models, the indexes CSn, CZn, CCu and CPb, CSb should have respectively negative linear correlations with |dG-650.0| and |dG-900.0|. So, variables diG and doG could be defined, which indicates the magmatic rock��s controlling the distribution of inside and outside mineralization zones, as the following equations:
![]() (5)
(5)
Thus, the space cross-correlation coefficients of the mineralization indexes (CSn, CZn, CCu, CPb and CSb) and the variables (diG and doG) were worked out. In addition, the F tests against the linear regression models were performed. The results are listed in Table 1.
From Table 1, it can be found that diG and doG show respectively significant linear correlations with CSn, CZn, CCu and CPb, while the correlation between doG and CSb is not significant. Upon that, a conclusion could be drawn that diG and doG have remarkable contributions or controlling effects on the spatial distribution of the mineralization. Therefore, diG and doG can serve as indexes to measure the ore-formation advantage degree of the geological factors. So, diG and doG were used as the indexes of the distance ore-controlling factors of the magmatic rock. In the meantime, index diG has more remarkable correlation with the mineralization variables than index doG, which indicates that the magmatic rock has more powerful controlling effects on the near-distance mineralization.
Similarly constructed were the ore-controlling factor indexes for the top surface amplitude of the magmatic body (wr1G and r2G), the strata and lithologies (c01R, c02R, c03R, c05R, c06R, c07R, c08R, c09R), the fault (dF1), and the folds (swr1R, swr2R, wgR).
3 Stereoscopic quantitative prediction of concealed ore bodies
According to the above quantitative analysis results of ore-controlling geological factors, it can be found that the mineralization indexes have certain association relation with the ore-controlling geological factors. With a proper model, this relation can be describable. Thus, based on the distribution of the geological ore-controlling effects in the geology space, the mineralization distribution was inferred, and then the concealed ore bodies located in the geological space could be evaluated.
Table 1 Correlation coefficient and regression effectiveness of mineralization indexes CSn, CZn, CPb, CSb and CCu with magmatic distance factors diG and doG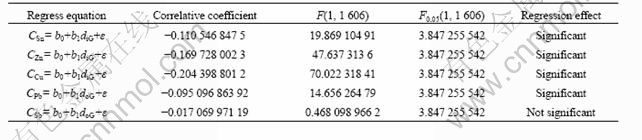
3.1 Prediction model
The mineralization distribution was actually referred to the mineralization indexes�� distribution in the 3-dimensional geological space. The variables describing these indexes were named as mineralization variables, including the voxel contents of CSn, CZn, CPb, CSb and CCu.
The geological ore-controlling factor indexes were used to describe the ore-formation advantage degree of the geological factors, while reflecting the distribution of the geological ore-controlling effects in the 3-dimensional geological space. So, the indexes were also named as ore-controlling variables, including (1) the ore-controlling factor index of the fault F1(dF1), (2) the distance ore-controlling factor index of the magmatic rock in the inside mineralization zone (diG), (3) the distance ore-controlling factor index of the magmatic rock for the outside mineralization zone (doG), (4) the first-order amplitude ore-controlling factor index of the magmatic rock (r1G), (5) the the second-order amplitude ore-controlling factor index of the magmatic rock (r2G), (6) the ore-controlling factor indexes of the strata and lithologies (c01R, c02R, c03R, c05R, c06R, c07R, c08R and c09R), (7) the first-order amplitude ore-controlling factor index of the folds (swr1R), (8) the second-order amplitude ore-controlling factor index of the folds (swr2R), and (9) the gradient ore-controlling factor index of the folds (wgR).
In the mathematical sense, the association relation between the mineralization indexes and the ore-controlling factors indexes could be defined as a mapping from the ore-controlling variable space to the mineralization variable space. This mineralization variable space is a bounded real number domain, so the mapping could be treated as a functional. This functional relation would be expressed by functions with multivariate regression, factor score, discriminant analysis, and others. The function expression model mapping from the geological ore-controlling effects to the mineralization distribution, i.e. Mv=f(Gv), was named as the mineralization mathematical model.
As the quantitative analysis results of ore-controlling geological factors showing above, the extracted ore-controlling geological factor indexes have remarkable linear correlation with the mineralization indexes. Thus, the functional model was instantiated as an ordinary multivariate linear function model listed as follows.
![]() (6)
(6)
The random factors of ore-formation effects are taken into account in this model, where Mvk denotes the ore-formation variables CSn, CZn, CPb, CSb, and CCu in Mv; Gvj represents the ore-formation variables dF1, diG, doG, wr1G, r2G, c01R, c02R, c03R, c05R, c06R, c07R, c08R, c09R, swr1R, swr2R, wgR in Gv; Bk0, Bk1, ��, Bkp are the parameters to be
Table 2 Solution results of mineralization model
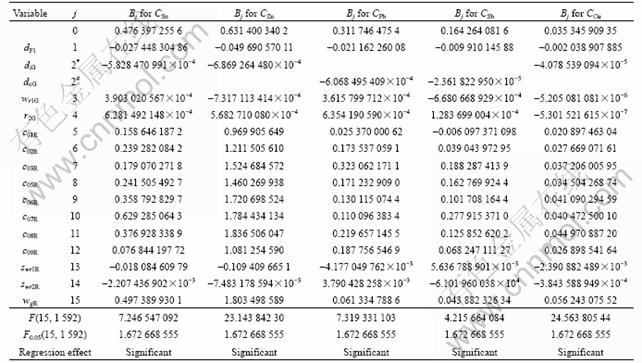
Note: ��*�� denotes that CSn, CZn and CCu use diG as ore-controlling variable to calculate regression coefficient B2; ��#�� denotes that CPb and CSb use doG as ore-controlling variable to calculate regression coefficient B2.solved for the linear function. Parameters Bk0, Bk1, ��, Bkp were retrieved by performing the multivariate linear regression analysis on Gv and Mv with quantitative data of the discretized voxels in the control region of the geological space.
The solution results of the mineralization functional model built with the regression analysis are listed in Table 2. The statistical test (F test) indicates that the linear function relationship between the mineralization variables (CSn, CZn, CPb, CSb and CCu) and the ore-controlling variables (dF1, diG, doG, wr1G, r2G, c01R, c02R, c03R, c05R, c06R, c07R, c08R, c09R, swr1R, swr2R and wgR) is significant.
The mathematical mineralization model revealed the associated relationship between the geological ore-controlling variable space and the mineralization variable space. It could be used to estimate the mineralization indexes CSn, CZn, CPb, CSb and CCu of all the 3-dimensional voxels in the research area.
3.2 Prediction results
Based on the above prediction model, mineralization indexes (CSn, CZn, CPb, CSb and CCu) and the ore-bearing index (Iore) of the unknown area��s voxels that meet the boundary conditions were estimated. The prediction results were stored in the topic database for the 3-dimensional quantitative prediction of the concealed ore bodies.
In order to represent the real 3-dimensional prediction results with a planar map readable for a geological personnel, the complanation of the 3-dimensional results was performed. The complanation procedure is stated as follows. Firstly, the 3-dimentional voxels were hierarchically divided along the vertical direction according to the voxel size (50 m). Then, a series of voxel layers with a height of 50 m, came into being. Finally, the complanation of the real 3-dimentional prediction results was achieved, which was consistent with the methods of the level geological planar maps, exploration section maps and other 2-dimentional maps describing a 3-dimentional mines. With the VBA secondary development function of AutoCAD, the prediction results were read from the topic database for prediction, and then the grid of the voxels in a certain level layer was rendered according to the horizontal coordinates of the voxels by level. At every voxel lattice on the grid map, the known values (only for the know voxels) and the estimated values (for both known and unknown voxels) of the mineralization indexes (CSn, CZn, CPb, CSb and CCu), the estimated values (ore-bearing voxels and non-ore-bearing voxels) of the ore-bearing index (Iore) and the codes of the strata and lithologies were labeled. According to the rendering method, 19 maps with the layered voxel grids and prediction results were drawn, which were named as voxel mineralization index prediction map for the cubic quantitative prediction of the concealed ore bodies, or voxel prediction map for short.
3.3 Engineering verification
According to the above prediction results, No.215 Geological Brigade of Guangxi Autonomous Region put in practice some deep prospecting projects (pit drills) within the sections (the deep parts of Changpo section and the deep parts of Tongkeng section) where the prediction values of the mineralization indexes are the most favorable. Large amounts of tin-polymetallic ore bodies within the depth of Changpo section were found. The Sn, Zn and Sb resources all reached the scale of a medium-sized deposit. They also found No.125 tin-polymetallic ore bodies below No.92 ore bodies in the depth of Tongkeng section. In the second half of 2007, three pit drills were also dug deeply in the depth of Tongkeng section. Two out of the three drills revealed two stratiform-skarn-type Zn-Cu ore bodies which belong to a new ore deposit type found in the studied area. The distance between the ore-intersecting holes is 400 m while the ore-intersecting thicknesses are respectively 4.25 and 8.2 m. The grades of Zn are respectively 5.59% and 6.54%. The boundary of ore bodies is still not controlled by now.
The verification results and prospecting achievements by the deep prospecting projects in the case study mine indicated that the models and quantitative analysis method for geological ore-controlling effects and the stereoscopic prediction model met the need for 3-dimensional located and quantitative prognosis in the deep prospecting of crisis mines, and the models and methods could be promoted to apply in middle and large crisis mines. The models and methods were built in the real 3-dimensional geological space, which broke though the limitation of the GIS techniques and software mainly being 2-dimensional or 2.5-dimensional on which the quantitative appraisal of mineral resources is currently relying. The breakthrough is helpful to the theory and method of metallogenic information extraction making forward to the 3-dimensional goal. Meanwhile, the models also revealed quantitatively the correlations of the ore-controlling factors and the mineralization distribution, which is useful to deepening the understanding of metallogenic regularities in the case study mine.
4 Conclusions
(1) The field models quantitatively describe the ore-controlling effects of the magmatic rock, strata and lithologies, faults and folds, along with the spatial distribution of the mineralization. The field models for geological ore-controlling effects are solved by discretizing the continuous models.
(2) There exists an associated relationship between the mineralization indexes and the ore-controlling geological factors indexes, which is the foundation of the 3-dimensional quantitative prediction model of the concealed ore bodies. With the predication model, the 3-dimensional localization and quantitative prediction results for concealed ore bodies in the depths and margins of the Dachang Mine are acquired.
(3) In the light of the prediction results, the deep prospecting drill holes are designed and put into practice, which results in that new concealed ore bodies are found in the depth of the Tongkeng and Changpo sections in the Dachang mine. These cases prove the effectiveness of the prediction models and results.
References
[1] LIU Liang-ming, PENG Sheng-lin. Key strategies for predictive exploration in mature environment: Model innovation, exploration technology optimization and information integration[J]. J Cent South Univ Technol, 2005, 12(2): 186-191.
[2] PENG Sheng-lin, YANG Mu, LIU Liang-ming. Approaches to location prognosis of concealed ore deposits (bodies) of productive mines[J]. J Cent South Univ Technol, 2002, 9(2): 112-117.
[3] BONHAM-CARTER G F, AGTERBERG F P, WRIGHT D F. Weights of evidence modelling: A new approach to mapping mineral potential[J]. Geological Survey of Canada, 1990, 89(9): 171-183.
[4] AGTERBERG F P. Combining indicator patterns in weights of evidence modeling for resource evaluation[J]. Nonrenewable Resources, 1992, 1(1): 39-50.
[5] SINGER D A. Basic concepts in three-part quantitative assessments of undiscovered mineral resources[J]. Nonrenewable Resources, 1993, 2(2): 69-81.
[6] ZHAO Peng-da. Theories, principles, and methods for statistical prediction of mineral deposits[J]. Journal of Mathematical Geology, 1992, 24(6): 589-595.
[7] WANG Shi-chen��CHEN Yong-liang, XIA Li-xian. Theory and method of mineral prediction using integrated information[M]. Beijing: Science Press, 2000: 65-180. (in Chinese)
[8] ZHAO Peng-da. Three-component quantitative resource prediction and assessments: Theory and practice of digital mineral prospecting[J]. Earth Science��Journal of China University of Geosciences, 2002, 27(5): 482-489. (in Chinese)
[9] XIAO Ke-yan, ZHU Yu-shen, SONG Guo-yao. GIS quantitative assessments of mineral resources[J]. Geology in China, 2000, 27(7): 29-32. (in Chinese)
[10] HARRIS J R, WILKONSON L, GUNSKY E C. Effective use and interpretation of lithogeochemical data in regional mineral exploration programs: Application of Geographic Information Systems (GIS) technology[J]. Ore Geology Reviews, 2000, 16(3/4): 107-143.
[11] ASADI H H, HALE M. A predictive GIS model for mapping potential gold & base metal mineralization in Takab area, Iran[J]. Computers & Geosciences, 2001, 27(8): 901-912.
[12] CHEN Y. MRPM: Three visual basic programs for mineral resource potential mapping[J]. Computers & Geosciences, 2004, 30(7): 969-983.
[13] HARRRIS J R, SANBORN-BARRIE M, PANAGAPKO D A, SKULSKI T, PARKER J R. Gold prospectivity maps of the Red Lake greenstone belt: Application of GIS technology[J]. Canadian Journal of Earth Sciences, 2006, 43(7): 865-893.
[14] WANG Zhi-jing, CHENG Qiu-ming. GIS-based (W+-W-) weight of evidence model and its application to gold resources assessment in Abitibi, Canada[J]. Journal of China University of Geosciences, 2006, 17(1): 71-78.
[15] LI Q, CHENG Q. VisualAnomaly: A GIS-based multifractal method for geochemical & geophysical anomaly separation in Walsh domain[J]. Computers & Geosciences, 2006, 32(5): 663-672.
[16] YE Tian-zu, XIAO Ke-yan, YAN Guang-shen. Methodology of deposit modeling and mineral resource potential assessment using integrated geological information[J]. Earth Science Frontiers, 2007, 14(5): 11-19. (in Chinese)
[17] ZHOU W, CHEN G, LI H, LUO H, HUANG S L. GIS application in mineral resource analysis��A case study of offshore marine placer gold at Nome, Alaska[J]. Computers & Geosciences, 2007, 33(6): 773-788.
[18] FORD A, BLENKINSOP T G. Combining fractal analysis of mineral deposit clustering with weights of evidence to evaluate patterns of mineralization: Application to copper deposits of the Mount Isa Inlier, NW Queensland, Australia[J]. Ore Geology Reviews, 2008, 33 (3/4): 435-450.
[19] CASSARD D, BILLA M, LAMBERT A, PICOT J C, HUSSON Y, LASSERRE J L, DELOR C. Gold predictivity mapping in French Guiana using an expert-guided data-driven approach based on a regional-scale GIS[J]. Ore Geology Reviews, 2008, 34(3): 471-500.
[20] CARRANZA E J M, RUITENBEEK F J A, HECKER C, MEIJDE M, MEER F D. Knowledge-guided data-driven evidential belief modeling of mineral prospectivity in Cabo de Gata, SE Spain[J]. International Journal of Applied Earth Observation and Geoinformation, 2008, 10(3): 374-387.
[21] WANG Gong-wen, CHEN Jian-ping. Mineral resource prediction and assessment of copper multi-mineral deposit based on GIS technology in the north of Sanjiang Region, China[J]. Earth Science Frontiers, 2008, 15(4): 27-32. (in Chinese)
[22] MAO Xian-cheng, DAI Ta-gen, ZOU Yan-hong, WU Xiang-bing. Research and system development of geological mineral database of the Dachang orefield[J]. Geology and Prospecting, 2003, 39(5): 72-76. (in Chinese)
[23] ZOU Yan-hong, MAO Xian-cheng. Establishment and application of geological survey database[J]. J Cent South Univ: Science and Technology, 2004, 35(3): 463-467. (in Chinese)
[24] CEN Kuang, YU Chong-wen. Mass and energy transport in ore forming processes of sulfide deposits in Tongling district[J]. Geochimica, 2001, 30(6): 533-539. (in Chinese)
[25] ZHAO C B, PENG S L, LIU L M, HOBBS B E, ORD A. Effective loading algorithm associated with explicit dynamic relaxation method for simulating static problems[J]. J Cent South Univ Technol, 2009, 16(1):125-130.
Foundation item: Project(2007CB416608) supported by the National Basic Research Program of China; Project(2006BAB01B07) supported by the National Science and Technology Pillar Program during the 11th Five-Year Plan Period
Received date: 2009-03-22; Accepted date: 2009-05-27
Corresponding author: MAO Xian-cheng, Professor, PhD; Tel: +86-731-88877571; E-mail: xcmao@126.com
