

J. Cent. South Univ. (2019) 26: 256-264
DOI: https://doi.org/10.1007/s11771-019-3998-6

Effects of asphalt pavement texture on hydroplaning threshold speed
Mohammad Hosein DEHNAD, Ali KHODAII
Department of Civil & Environmental Engineering, Amirkabir University of Technology,15875-4413, Tehran, Iran
 Central South University Press and Springer-Verlag GmbH Germany, part of Springer Nature 2019
Abstract:
Hydroplaning speed can be affected by pavement texture depth, thickness of water film, tire pressure and tread depth. In this study, to understand the influence of pavement texture on the hydroplaning speed, a new lab-scale apparatus has been designed and manufactured. The lack of proportion between linear movement of vehicle shaft and the wheel rotation was found to be a good index to determine hydroplaning threshold.A 5% drop in the ratio of wheel-to-axle rotation has been assumed as an index to determine hydroplaning threshold. Based on the measures, a simplified model was developed that is able to predict the hydroplaning speed depending on pavement��s texture characteristics. The results indicated that a 77% increase in mean texture depth cause 9% increase in hydroplaning threshold speed.
Key words:
asphalt pavement; hydroplaning; surface texture; hydroplaning test machine��
Cite this article as:
Mohammad Hosein DEHNAD, Ali KHODAII. Effects of asphalt pavement texture on hydroplaning threshold speed [J]. Journal of Central South University, 2019, 26(1): 256�C264.
DOI:https://dx.doi.org/https://doi.org/10.1007/s11771-019-3998-61 Introduction
Hydroplaning occurs when a film of water is built up between the tires of a vehicle and the road surface that leads to lack of contact between tire and pavement and loss of friction. This phenomenon reduces braking capability and steering control by the driver [1]. The speed at which hydroplaning occurs is known as the hydroplaning speed. The higher the hydroplaning speed, the lower the hydroplaning potential [2]. Hydroplaning speed is recognized to differ over a range of tire slipping conditions from free rolling to full skidding [3].
Hydroplaning speed modeling can be classified into experimental/empirical and analytical/numerical approaches that involve deriving relationships to relate hydroplaning speed with different parameters. Numerous studies have been conducted to determine methods to improve the threshold of hydroplaning. Major models derived from different experimental and numerical studies are summarized in Table 1.
ONG et al [2] presented a numerical model to simulate hydroplaning phenomena for a locked wheel sliding on a flooded pavement surface. They found that hydroplaning speed increases with increasing tire pressure and load.
Furthermore the decrease in water thickness can increase hydroplaning speed [2]. In another study,two extreme conditions of hydroplaning were simulated for a fully rolling tire (0% slip) and a fully locked tire (100% slip) for a range of tire inflation pressure and water depth conditions [3].
Macro-texture of the pavement is known to be another factor that has a major impact on hydroplaning speed by providing drainage channels that expel rainwater between tire and pavement [12�C14].
Table 1 Some studies and models for prediction of hydroplaning speed
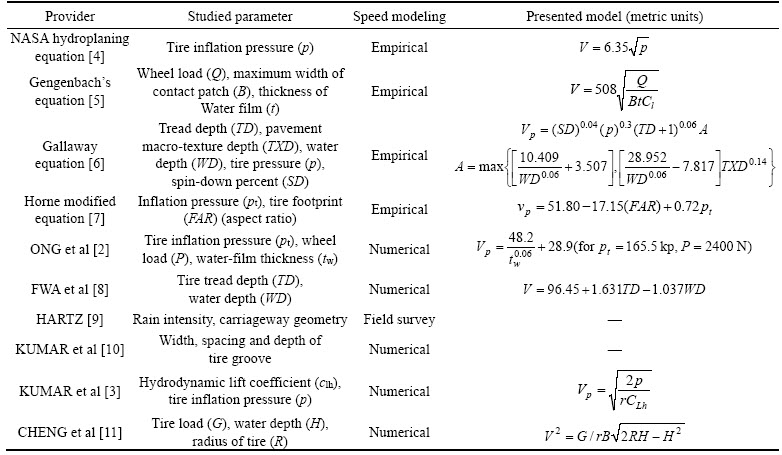
An example is the study by GALLAWAY et al [6] who performed experiments utilizing spin-down technique for rolling tires and proposed an experimental model dependent on mean texture depth (MTD) of pavement.
MTD is found to be a very good indicator of wet and dry pavement friction, having a similar level of correlation to skid tire tests. The sand patch method (ASTM E965 2006) has been historically used as the main technique for measuring MTD [13].
BALMER et al [15] suggested that pavements with coarse surface texture could enhance wet traction and increase hydroplaning speed. Studies conducted by HORNE et al [4] also showed that a rough textured surface required a higher depth of water for hydroplaning occurrence. LUO et al [16] applied an open-graded friction course (OGFC) to pavement surfaces to enhance driving safety under wet conditions, and reduce tire-pavement noise. In another study, CHEN et al [17] showed that the tire-polishing action plays the critical roles in the micro texture, and the evolution of friction of aggregate is governed by the micro texture variations.
FWA et al [18] made an attempt to derive an analytical simulation model to investigate the relative effectiveness of pavement grooving and tire grooving in reducing vehicle hydroplaning risk. CHU et al [19] presented a framework to incorporate pavement skid resistance and hydroplaning risk considerations in asphalt mixture design. Their proposed framework includes three main parts: a lab-accelerated wear and polishing testing of mixture designs, estimation of field terminal skid resistance from laboratory-measured conclusions, and an analytical simulation part that derives the skid resistance and hydroplaning performance of the mixture.
ZHOU et al [20] investigated the effect of different tire tread pattern grooves surface on anti-hydroplaning performance by using computational fluid dynamics (CFD). Their results demonstrated that bionic V-riblet non-smooth structure could efficiently increase hydroplaning speed and enhance tire anti-hydroplaning performance.
2 Methodology
According to a review of previous research, the lack of an indoor apparatus that can appraise the influence of different parameters affecting hydroplaning is apparent. In the present study, to understand how the pavement texture characteristics could affect the hydroplaning potential, a new lab-scale apparatus has been designed and manufactured, called hydroplaning test machine (HTM), and laboratory experiments were conducted on different asphalt samples.
In the hydroplaning test machine, a wheel supported by a linear suspension system and under specified vertical load is connected to a central axle through an arm and moves with an electromotor. Water could be sprayed by a pre-defined pressure between tire and asphalt pavement surface through a water nozzle, which is mounted in front of the tire. Two tachometers were located on the wheel and central axle. The difference between linear speed of vehicle shaft and the wheel rotational speed showed a change dramatically due to hydroplaning. Based on this change, the hydroplaning phenomenon is evaluated in different situations.
A magnetic brake is connected to wheel shaft to apply different friction factors and negative torque, which provides the capability of continuous range operation of brake changes. In addition, to observe the output of HTM, a software was applied which can demonstrate the value of rotational speed of the wheels and central shaft revolution per minute (r/min) on monitor momentarily while setting revolution frequency and speed in certain intervals.
Using HTM, it is possible to compact different asphalt mixtures in the mold and evaluate the effect of pavement surface texture on hydroplaning initiation [21]. The speed of rotation is registered by two tachometers momentarily. Comparing these values in dry and wet conditions of pavement surface, hydroplaning occurrence can be detected. In other words, the drop in proportion between the number of wheel rotation and the amount of longitudinal movement of the wheel is considered as an index to identify the occurrence of this phenomenon. This is comparable to the slide of moving vehicle, which does not roll its wheel the same amount of the space, which has moved, and some portion of rolling has been transferred to the wheel skid. The overview of manufactured machine is shown in Figure 1.
3 Material
Variables including mean texture depth (related to mix type and grading), frequency (related to electro-motor rotation and wheel speed),surface condition of pavement (dry, wet, water film thickness) and coefficient of brake friction are the input parameters when conducting tests.Six types of aggregate gradations have been selected including four dense graded aggregates from fine to course, a gap and an open graded aggregate. The different aggregate gradation results in creation of different textures in the asphalt mixture. The used aggregate types were siliceous and limestone crushed with 80% and 95% broken in two faces respectively and the bitumen was selected 60/70 penetration grade (PG 64-16) obtained from a local refinery. The bitumen specific gravity of bitumen in 25 �� C was 1.014, based on ASTM D70. In addition, the degree of penetration at 25 ��C was 60 mm/10 according to ASTM D5. The softening point was measured 49 ��C and the ductility was more than 100 cm.

Figure 1 Overview of hydroplaning test machine
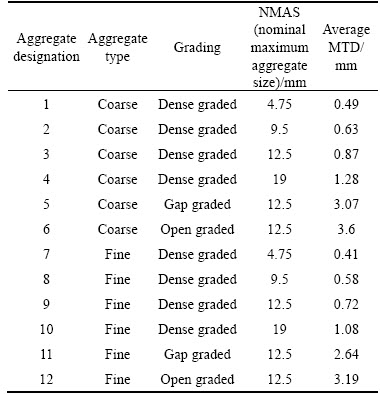
Therefore, 12 different asphalt mixtures are used in the experiments. Aggregate types, grading, nominal maximum aggregate size (NMAS) and average mean texture depth (MTD) were selected. The levels for each factor is shown in Table 2. Each sample was poured in a 10-part steel molds and every sample required 40 kg asphalt mixture. Aggregates were mixed with optimum bitumen content and compacted with the roller mounted on the apparatus.
In order to prepare asphalt samples, the weights of the aggregates with different dimensions were determined according to the selected gradation. After mixing aggregates together, the aggregates were placed inside the oven to reach a temperature of 140 �� C. Then, the optimum bitumen content is added (this optimum bitumen content was 6% for mixtures with dense grading). The bitumen was mixed with hot aggregates on an indirect heat source to provide HMA. Then, the asphalt mixture was poured into molds. Afterwards, using the roller on the machine, the asphalt compaction was performed to reach the target void. In Figure 2, asphalt sample is shown on the molds of HTM using sand patch method (ASTM E965 2006). The average value of this parameter is shown in the last column of Table 2.
Table 2 Characteristics of aggregates
It should be noticed that, the average MTD parameter for each mixture is measured. In order to apply different wheel speeds, the machine has the ability to operate at the desired frequency and a set electromotor rotation. In this study, the frequency ranges of 15 to 35 Hz with steps of 2.5 Hz have been considered to check the effect of increasing speed. The electromotor is located in the lower part of the HTM and the central axis moves through the conveyor belt as shown in Figure 3(a).
To transfer water from reservoir to the surface between the wheel and asphalt mixture, a system, shown in Figure 3(b), has been used. Rotary joint on the central axis allows movement from steady mode to rotary mode. Water is sprinkled with a certain pressure through a nozzle located opposite the wheel. Experiments were conducted in dry (t=0) and wet conditions of the surface pavement with a water film thickness of 1 mm.
In the HTM, a magnetic brake connected to the wheel was used, which affects the test condition by applying negative torque to the wheel. The coefficient of brake friction (B) in the machine is entered in percentages. In this study, the values of variable B are 0, 15% and 30% percent. The hydroplaning test machine, consisting of mechanical part, electrical part, water transfer system and asphalt mixtures, are shown in Figures 3(b) and (c). As illustrated in Figure 3(d), output data including machine performance comprises wheel rotation (rotational speed), axle rotation (longitudinal speed) and the ratio of wheel/axle rotation are shown on the monitor.
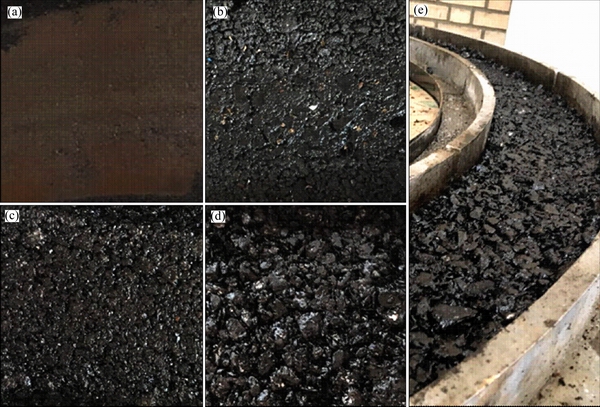
Figure 2 Samples of asphalt mixtures
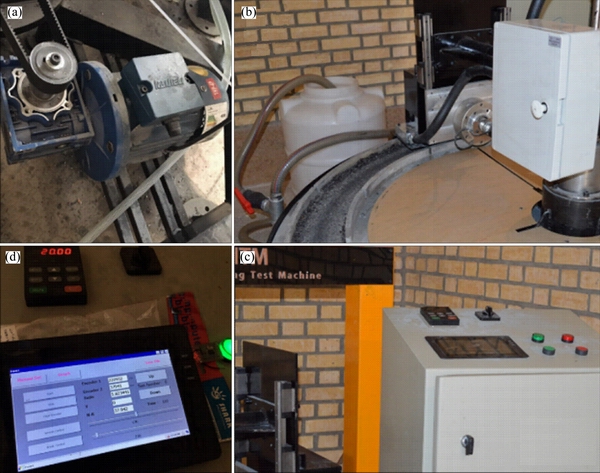
Figure 3 Electromotor and conveyor belt (a), water transferring system (b), parts of hydroplaning test machine (c) and monitor of results (d)
4 Results and discussion
Experimental results on six different asphalt mixtures with limestone aggregates in dry and wet conditions of pavement surface are shown in Figure 4. In all samples, the wheel/axle rotation ratio is almost the same in the dry condition of the pavement surface and there is only a slight difference in the various frequencies and for different mixtures.
When water is sprayed with a certain thickness and pressure between the wheel and the asphalt surface, a drop in the wheel/axle rotation ratio occurs at a certain frequency during the test. The value of this frequency (speed) differs for various mixtures depending on the asphalt surface texture. In Figure 5, the wheel/axle rotation ratio versus frequency is presented for various mixtures under wet condition when water is sprayed under the wheel.
As the roughness in asphalt surface increases, the amount of drop in wheel/axle rotation ratio decreases. In mixture No. 1 with MTD=0.49, the highest reduction in wheel/axle rotation ratio is observed, and in mixture No. 6 with MTD=3.6, the lowest drop was observed. In addition, as MTD increases, the frequency was rising at which the wheel/axle rotation ratio was significantly reduced.
In mix No. 1, by increasing frequencies from 15 to 25 Hz, no transition in proportion of wheel/axle rotation ratio was observed.By increasing frequency up to 35 Hz, this value was decreased by about 9.3% (Figure 5).
This decreased value was due to the lack of proportion of wheel rotation to its linear displacement compared to dry condition of the pavement surface. In other words, in a section of the wheel movement, some part of rolling was converted into skid by increasing speed. In fact, in this situation and at this frequency, the phenomenon of hydroplaning began showing its effect.
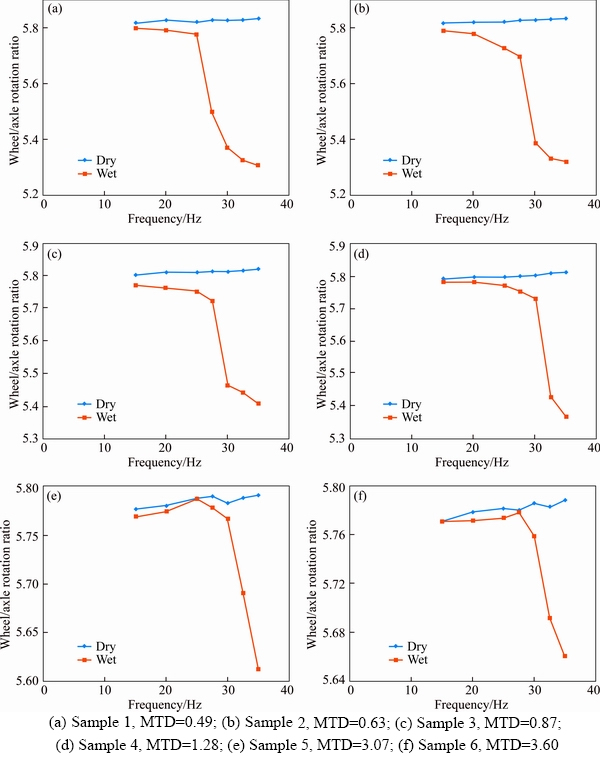
Figure 4 Wheel/axle rotation ratio in dry and wet condition in different samples:

Figure 5 Wheel/axle rotation ratio versus frequency in various mixtures under wet surface condition
Partial transition in the wheel/axle rotation ratio was observed in Mix No. 2 up to 27.5 Hz. However, in 30 Hz frequency, this proportion increases by about 5.8% compared to 25 Hz. In Mix No. 6, no considerable transition has occurred in this ratio by increasing frequency up to 35 Hz and hydroplaning was not observed. Obtained results proved that the potential of hydroplaning occurrence decreased by increasing pavement surface texture.
Regarding the trend of changes in the wheel/axle rotation ratio in different samples, it was observed that at a point where there is a 5% drop in the rotational ratio, there is a turning point that can be considered as a sign that shows the start of hydroplaning. As stated in the literature, for full scale tests, if the level of slip ratio is more than 10%, a considerable reduction in friction will occur and hydroplaning will happen [22]. Considering the specifications and dimensions of the present apparatus and behavior of the samples in reducing the slip ratio, a 5% drop in wheel/axle rotation ratio at various frequencies was assumed to be the threshold for hydroplaning occurrence. Thus, from the graphs, the speed at which hydroplaning occurs was found.
Figure 6 shows the hydroplaning speed versus MTD for various mixtures with a linear regression equation fitted. In addition, results of the tests when no brake is applied and when the brake friction coefficient is 15% and 30%, are shown in this figure.

Figure 6 Hydroplaning threshold frequency versus MTD in different brake friction coefficients
As can be seen, accelerated hydroplaning speed occurs by increasing the friction coefficient of the brake. A regression equation is derived based on observations and shown in Eq. (1). This equation correlates the hydroplaning frequency (F) to the mean texture depth (MTD) and the brake friction coefficient (B).
F=25.87+3.511MTD+0.152B (1)
This equation shows that increasing MTD and decreasing the brake friction coefficient leads to an increase in the hydroplaning frequency (speed). This equation can be used for prediction purposes within the limits of the experimental program.
In order to validate this proposed model, obtained results are compared with the Gallaway equation. As seen in the third row of Table 1, in this equation, the hydroplaning speed depends on tire tread depth (TD), pavement macro-texture depth (TXD), water depth (WD), tire pressure (p) and spin-down percent (SD). In the present study, the values of TD and WD is assumed equal to 0.5 and 1 mm respectively. In addition, for the laboratory set-up, the value of p has been replaced by the amount of load applied to the contact area of wheel and asphalt pavement.
In order to compare the results of the equations, the T-Test was performed. The T Stat and T Critical two-tail values were equal to 1.473 and 2.365, respectively. Since the t Stat is greater than �C2.365 and less than 2.365, it can be concluded that there is no statistically significant difference between the means. Therefore, the observed values and difference between the equation means is not convincing enough to say that the average number of results between the proposed model and Gallaway equation differ significantly.
5 Conclusions
For the expected operating speeds of the highway in wet weather, the pavement must be designed with a surface course asphalt mixture that provides an acceptable risk margin against hydroplaning. In this research effort, a study to analyze the effects of pavement texture and vehicle speed on hydroplaning is presented. These effects are measured with a new machine purposely designed and manufactured by the authors. The machine can apply different frequencies, coefficient of brake friction, mean texture depth (MTD), thickness of water film, rotation of wheel and rotation of axle. Using the data obtained from tests a simplified model is proposed. This model is able to predict speed of hydroplaning as a function of texture characteristics as measured by its MTD and the coefficient of brake friction. It should be noticed that the proposed relationship is valid only within the experimental limits. Comparison between model that was developed by GALLAWAY et al and the model proposed in this research shows that there is no statistically significant difference. This not only shows the similarity of models, but also it illustrates the ability of the machine in simulation of hydroplaning and obtaining valuable relationships that are often difficult to obtain in practice.
References
[1] SILLEM A. Feasibility study of a tire hydroplaning simulation in a monolithic finite element code using a coupled Eulerian-Lagrangian method [D]. Delft University of Technology, 2008.
[2] ONG G P, FWA T F. Study of factors influencing vehicle hydroplaning speed [C]// Proceedings of the Eastern Asia Society for Transportation Studies, The 7th International Conference of Eastern Asia Society for Transportation Studies, 2007. Tsukuba: Eastern Asia Society for Transportation Studies, 2007: 1958�C1972.
[3] KUMAR S S, ANUPAM K, SCARPAS T, KASBERGEN C. Study of hydroplaning risk on rolling and sliding passenger car [J]. Procedia-Social and Behavioral Sciences, 2012, 53: 1019�C1027.
[4] HORNE W B, DREHER R C. Phenomena of pneumatic tire hydroplaning [R]. Washington D C: NASA, 1963.
[5] Gengenbach, Experimental investigation of tires on wet pavements [J]. Automotive Technology Magazine, 1968, 70: 83�C89.
[6] GALLAWAY B, IVEY D L, HAYES G, LEDBETTER W B, OLSON R M, WOODS D L, SCHILLER R F Jr. Pavement and geometric design criteria for minimizing hydroplaning [R]. Federal Highway Admistration. 1979.
[7] HORNE W B, YAGER T J, IVEY D L. Recent studies to investigate effects of tire footprint aspect ratio on dynamic hydroplaning speed [M]// the Tire Pavement Interface. ASTM International. 1986,
[8] FWA T, KUMAR S, ONG G, HUANG C. Analytical modeling of effects of rib tires on hydroplaning [J]. Transportation Research Record: Journal of the Transportation Research Board, 2008, 2068: 109�C118.
[9] HARTZ B. Speed on German highways in heavy rain [C]// 4th International Symposium on Highway Geometric Design. Valencia, 2010: 01338157.
[10] KUMAR S S, KUMAR A, FWA T. Analyzing effect of tire groove patterns on hydroplaning speed [J]. Journal of the Eastern Asia Society for Transportation Studies, 2010, 8: 2018�C2031.
[11] CHENG G, ZHANG S, ZHAO G, CHENG Q, WANG Z, LIU N. Speed analysis of the radial tire on hydroplaning pavement [C]// Proceedings of the 3rd International Conference on Material, Mechanical and Manufacturing Engineering (IC3ME��15). Guangzhou: Atlantis Press, 2015: 1485�C1489.
[12] CEREZO V, GOTHI M, MENISSIER M, GIBRAT T. Hydroplaning speed and infrastructure characteristics [J]. Proceedings of the Institution of Mechanical Engineers, Part J: Journal of Engineering Tribology, 2010, 224(9): 891�C898.
[13] SEZEN H, FISCO N. Evaluation and comparison of surface macrotexture and friction measurement methods [J]. Journal of Civil Engineering and Management, 2013, 19(3): 387�C399.
[14] CHEN Y, WANG K J, ZHOU W F. Evaluation of surface textures and skid resistance of pervious concrete pavement [J]. Journal of Central South University, 2013, 20(2): 520�C527.
[15] BALMER G, GALLAWAY B. Pavement design and controls for minimizing automotive hydroplaning and increasing traction [M]// Frictional Interaction of Tire and Pavement. ASTM International, 1983.
[16] LUO S, QIAN Z D, XUE Y C. Performance evaluation of open-graded epoxy asphalt concrete with two nominal maximum aggregate sizes [J]. Journal of Central South University, 2015, 22(11): 4483�C4489.
[17] CHEN X H, STEINAUER B, WANG D W. Evolution of aggregate surface texture due to tyre-polishing [J]. Journal of Central South University of Technology, 2011, 18(1): 259�C265.
[18] FWA T, ANUPAM K, ONG G. Relative effectiveness of grooves in tire and pavement for reducing vehicle hydroplaning risk [J]. Transportation Research Record: Journal of the Transportation Research Board, 2010, 2155: 73�C81.
[19] CHU L, FWA T. Incorporating pavement skid resistance and hydroplaning risk considerations in asphalt mix design [J]. Journal of Transportation Engineering, 2016, 142(10): 04016039.
[20] ZHOU H C, WANG G L, YANG J, XUE K Y. Numerical simulation of effect of bionic V-riblet non-smooth surface on tire anti-hydroplaning [J]. Journal of Central South University, 2015, 22(10): 3900�C3908.
[21] DEHNAD M, KHODAII A. Evaluating the effect of different asphalt mixtures on hydroplaning using a new lab-scale apparatus [J]. Petroleum Science and Technology, 2016. 34(20): 1726�C1733.
[22] MARTINEZ J E, LEWIS J M, STOCKER A. A study of variables associated with wheel spin-down and hydroplaning [R]. Federal Highway Administration, 1972.
(Edited by HE Yun-bin)
���ĵ���
����·��ṹ�Ի�����ֵ�ٶȵ�Ӱ��
ժҪ��·��������ȡ�ˮĤ��ȡ���̥ѹ����̥����ȵ����ض���Ӱ����ٶȡ�Ϊ�˽�·��ṹ�Ի����ٶȵ�Ӱ�죬��Ʋ�������һ�����͵�ʵ��װ�á��о����֣������ֱ���˶��복�ֵ�ת��֮��û�б�����ϵ����ȷ��������ֵ��һ���ܺõ�ָ�ꡣ�ٶ�������ת���½�5%��Ϊȷ��������ֵ��ָ�꣬�ڴ˻����ϣ�������һ�ּ�ģ�ͣ���ģ�Ϳ��Ը���·�������������Ԥ�⻬���ٶȡ����������ƽ�������������77%���ɵ���ˮƽ����ֵ�ٶ�����9%��
�ؼ��ʣ�����·�棻ʪ·��̥������������ˮ�ϻ��в��Ի���
Received date: 2017-08-17; Accepted date: 2017-12-28
Corresponding author: Ali KHODAII, PhD, Professor; Tel: +98-21-66400243; Fax: +98�C21�C66414013; E-mail: khodaii@aut.ac.ir; ORCID: 0000-0002-6646-1817
Abstract: Hydroplaning speed can be affected by pavement texture depth, thickness of water film, tire pressure and tread depth. In this study, to understand the influence of pavement texture on the hydroplaning speed, a new lab-scale apparatus has been designed and manufactured. The lack of proportion between linear movement of vehicle shaft and the wheel rotation was found to be a good index to determine hydroplaning threshold.A 5% drop in the ratio of wheel-to-axle rotation has been assumed as an index to determine hydroplaning threshold. Based on the measures, a simplified model was developed that is able to predict the hydroplaning speed depending on pavement��s texture characteristics. The results indicated that a 77% increase in mean texture depth cause 9% increase in hydroplaning threshold speed.
