
J. Cent. South Univ. Technol. (2010) 17: 85-92
DOI: 10.1007/s11771-010-0015-5 ![]()
Online dynamic measurement of saturation-capillary pressure relation in sandy medium under water level fluctuation
LI Yan(����)1, 2, ZHOU Jin-feng(�ܾ���)3, XU Jun(���)4, KAMON M5
1. School of Marine Sciences, Sun Yat-sen University, Guangzhou 510275, China;
2. Key Laboratory of Aquatic Food Product Safety of Ministry of Education, Sun Yat-sen University,
Guangzhou 510275, China;
3. School of Environmental Science and Engineering, Sun Yat-sen University, Guangzhou 510275, China;
4. College of Hydrology and Water Resources, Hohai University, Nanjing 210098, China;
5. Takamatsu National College of Technology, Takamatsu, Kagawa 761-8058, Japan
? Central South University Press and Springer-Verlag Berlin Heidelberg 2010
Abstract:
An online dynamic method based on electrical conductivity probe, tensiometer and datataker was presented to measure saturation-capillary pressure (S-p) relation in water-light nonaqueous phase liquid (LNAPL) two-phase sandy medium under water level fluctuation. Three-electrode electrical conductivity probe (ECP) was used to measure water saturation. Hydrophobic tensiometer was obtained by spraying waterproof material to the ceramic cup of commercially available hydrophilic tensiometer. A couple of hydrophilic tensiometer and hydrophobic tensiometer were used to measure pore water pressure and pore LNAPL pressure of the sandy medium, respectively. All the signals from ECP and tensiometer were collected by a data taker connected with a computer. The results show that this method can finish the measurement of S-p relation of a complete drainage or imbibition process in less than 60 min. It is much more timesaving compared with 10-40 d of traditional methods. Two cycles of water level fluctuation were produced, and four saturation-capillary pressure relations including two stable residual LNAPL saturations of the sandy medium were obtained during in 350 h. The results show that this method has a good durable performance and feasibility in the porous medium with complicated multiphase flow. Although further studies are needed on the signal stability and accuracy drift of the ECP, this online dynamic method can be used successfully in the rapid characterization of a LNAPL migration in porous media.
Key words:
water level fluctuation; saturation-capillary pressure (S-p) relation; online dynamic measurement��
1 Introduction
Light nonaqueous phase liquid (LNAPL) is a common group of soil and groundwater contaminants, comprised mostly of petroleum products such as gasoline, diesel fuel and heating oil. Fluctuation of groundwater elevation not only causes the movement of a continuous (i.e., mobile) LNAPL within an aquifer, particularly in the vertical direction [1-2], but also enhances the dissolution and biodegradation of the LNAPL in the unsaturated and saturated zones [3], redistributing the LNAPL contaminant both above and below the water table as the persistent secondary sources of groundwater contamination [4]. In order to successfully remediate LNAPL-contaminated sites, it is necessary to locate, remove or isolate the LNAPL sources. To predict the migration and distribution of LNAPL contaminants in porous media, their saturation- capillary pressure (S-p) relations need to be known.
To measure S-p relations of porous media, five traditional methods including their innumerable variations are available, which are column test, centrifuge, vapor pressure, pressure cell and Brooks�� methods. However, only the last two methods can be used under water level fluctuation. It needs 10-40 d for a complete drainage or imbibition process with traditional methods, and only the saturations and capillary pressures at sparsely-distributed pressure levels can be obtained. For the further study on the migration of the LNAPL contaminant in the subsurface, the spatio-temporal distribution and high smooth S-p relation curve are both important. Thus, non-destructive and online methods with quick reactions to the changes of saturation and pressure have thus become the research focus these years.
Recently, many studies have been carried out on the non-destructive and dynamic methods for the measurement of fluid content/saturation in porous media. These methods are generally related to the transmission characteristics of acoustic, radial, electromagnetic and light waves in porous media. The contents of LNAPL and water cause significant changes in the travel time and amplitude of the signals transmitting in porous media. Acoustic method (i.e., P-wave) was used to detect n-dodecane, a nonaqueous phase liquid (NAPL), in a sand medium [5]. The acoustic method needs an electro- acoustic transducer that should be powerful enough for the generated acoustic waves to pass through the tested sand sample. Broadband acoustic waves are easy to be generated. However, it is difficult for a transducer to generate single-frequency acoustic waves. The travel time and amplitude changes of broadband acoustic signals transmitting in porous media are difficult to be obtained. Radioactive methods for measuring soil water saturation include the neutron scattering method, X-ray or gamma ray attenuation method [6]. The two methods require higher investment or special caution to avoid possible health hazards.
KECHAVARZI et al [7] succeeded in determining dynamic fluid saturation distribution with near infrared multispectral image analysis method in two-dimensional (2-D) three-fluid phase flow laboratory experiments. BOB et al [8] used a light transmission visualization (LTV) method, which took into account both absorption and refraction light theories, to quantify dense nonaqueous phase liquids (DNAPL) saturation in 2-D, two-fluid phase systems. Fluorescence macrophotography technique was used for the evaluation of colloidal transport and deposition in silica sand and sandy soil packed columns [9]. These light analysis methods can visually determine the content and spatial distribution of NAPL contaminants. However, it is very difficult for light to penetrate through a porous sample, and thus any light analysis method can only determine the fluid saturation distribution of the surface sample. Actually, the flow and transport of the fluids inside the medium are different from those on the medium surface.
Popular electromagnetic wave methods for the non-destructive and dynamic determination of water content in porous media include time domain reflectometry (TDR), electron conductivity method, and capacitance sensor method. TDR method is used for the dynamic determination of water saturation. A commercial TDR probe is composed of a wide body with two or three long needles. From the view of small-scale and high accuracy laboratory purpose, the needle should be non-destructive to the soil structure because high accuracy TDR generally requires long and thick needles. TDR method has good performance on both accuracy and signal stability. A TDR probe with a 3.0 cm-diameter body and two 5.0 cm-long needles (Trime-IT, IMKO GmbH) was used, and the absolute accuracy drift of water saturation in half a year was measured to be less than 0.01 [10]. LIU et al [11-12] successfully applied electric resistivity tomography method to determining the 3-D LNAPL saturation distribution. Electron conductivity method was used to online determine the moisture content during a fluid-bed granulation process due to a clear dependence of the electric conductivity on the moisture content of granule mass [13]. Capacitance sensor was designed to online measure oil saturation in a fine sandy medium [14]. These studies indicate that electromagnetic wave method had a wide measurement range of the water content, a high sensitivity, and a short response time to the water content change in porous media. Compared with acoustic, radioactive and light methods, electromagnetic wave method has a lower signal mechanical loss in the media, and thus possesses higher measurement accuracy. Electromagnetic wave methods are effective for the rapid characterization of spatio-temporal LNAPL distribution.
With regard to the online measurement of capillary pressure in the LNAPL-water two-phase system, two kinds of tensiometers for measuring pore liquid pressures are required. One is hydrophilic tensiometer with water- wetting ceramic cup to measure pore water pressure, the other is a hydrophobic tensiometer with LNAPL-wetting ceramic cup to measure pore LNAPL pressure. Since hydrophobic tensiometer is commercially unavailable, the problem is whether a hydrophilic tensiometer can be produced to satisfy the object LNAPL.
Of all the dynamic methods for the determination of water content/saturation in porous media, electro- magnetic wave method is popular for its higher measurement accuracy, easy operation and low cost. So far, there have been seldom reports on the combination of dynamic determinations of both water saturation and pressure for the online dynamic measurement of S-p relation. It should also be taken into consideration that the response time of a tensiometer on the change of pore fluid pressure is much longer than that of electromagnetic wave method on the change of water content/saturation in porous media. The online dynamic measurement of S-p relation with combination of small and high accuracy saturation probe and tensiometer is an encouraging method for the laboratory-scale purpose.
The objective of this work is to establish an economic and effective laboratory-scale method for the rapid online dynamic measurement of both the smooth S-p relation and the LNAPL distribution under complex water level fluctuation.
2 Experimental
2.1 Experimental device
The schematic diagram for measuring S-p relations in the LNAPL-water system under water level fluctuation is shown in Fig.1. An acrylic column (3.5 cm in inner diameter, 4.5 cm in outer diameter, and 50 cm in length) was utilized, with two pairs of tensiometers (SWT5, Delta-T Devices Ltd) assembled along one side, and two water saturation probes assembled along the opposite side. Two sets of tensiometer were used in the column test. A set of tensiometer was composed of one hydrophobic tensiometer for measuring pore LNAPL pressure and one hydrophilic tensiometer for measuring pore water pressure. The LNAPL was adjusted to penetrate into the sand medium as a steady uniform flow with a porous stone at the upper end of the column. There was also a 75 ��m-filter to prevent the fine sand particles from flowing out of the column at the lower end of the column. The pore liquid pressure and saturation of the porous medium at the same height (or point) were utilized for S-p relation description.
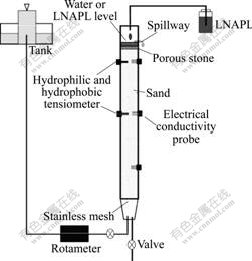
Fig.1 Device for measuring S-p relations under water level fluctuation
2.2 Sample preparation
Toyoura sand, with particle density of 2.64 g/cm3, compacted-state void ratio of 0.62, and saturated density of 2.01 g/cm3, was used as a sandy porous medium for the column test. The grain size distribution of Toyoura sand is shown in Fig.2.
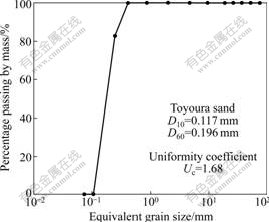
Fig.2 Grain size (D) distribution of Toyoura sand
The fully saturated sandy medium was obtained using an underwater falling method. The salt water was firstly filled into the column gradually from the bottom. Then the sand sample was poured into the column from the top via a funnel in uniform layers. In the process of sand-filling, the water level was above the sand medium in the column. Sufficient pore water in the column was induced out via a spillway at the top of the column.
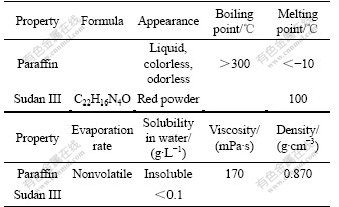
Paraffin liquid was used as a substitute for an LNAPL sample, due to its very low volatility at room temperature, negligible solubility in water and safety to health. To distinguish visually the downward migrating interface between the LNAPL and water during the drainage process, the LNAPL was dyed with Sudan III with a mass ratio of 10 000?1. The properties of materials used in this test are shown in Table 1.
Table 1 Properties of materials used for column tests
2.3 Measurement of water saturation
Electrical conductivity is closely related to the water content in soils or other porous media, which can be used for the measurement of water saturation. Three-electrode electrical conductivity probe (ECP), composed of a body and three fine round needles (see Fig.3), was thus developed to measure water saturation in porous media [15]. The ECP was used in this work, due to its small volume, low cost and easily-produced.
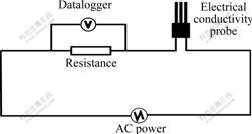
Fig.3 Circuit of electrical conductivity probe for water saturation measurement
Sodium chloride solution with a concentration of 0.05 mol/L was used as the initial pore water to raise the reactivity of the electrical conductivity probe and to avoid the formation of condenser components in the sand system.
The ECP and circuit of water saturation measurement system are shown in Fig.3. Power source with an output voltage of 1.0 V (peak to peak voltage of AC) and a frequency of 0.1 Hz was selected. The distance between every two ECPs was 15 cm. Low AC voltage and long interval between every two probes were used so that these neighbor probes did not interfere with each other. Electrolytic reaction in the vicinity of the electrodes did not happen either. Every ECP was connected in series to a resistance, and the voltage across which was recorded by a data logger with a sampling period of 0.5 s. The signal was of cosine wave, and was fitted with cosine function to obtain the amplitude as the marker of water saturation magnitude. In order to measure water saturation with the ECP, it was necessary to obtain a relationship between the signal recorded by the datataker and the corresponding water saturation in the sand sample.
In order to calibrate the ECP, the column test was used under the same condition as the formal test. A drainage process was imposed by a rotary pump to extract pore water out of the sand in the column. When there was no water to flow out of the sand, the sand located around the probe was extracted as a specimen for measuring water saturation. Simultaneously, the corresponding signal was recorded with the data logger. This procedure was conducted with different pump rates or different draining periods to get sand samples with different water saturations.
The sand specimen excavated from the column was composed of the LNAPL, water, and sand. A method was designed to distinguish the LNAPL and water from the specimen. In order to verify the feasibility of this method, two blank tests were also conducted. The average error between the water saturations determined by this method and the actual ones was less than 1.66% [16].
The relationship between voltage and water saturation was fitted with the empirical equation as follows:
Sw=A[1.0-exp(BV/V0)] (1)
where Sw is the water saturation; V is the corresponding output voltage, V; V0 is the output voltage of fully saturated sand, which is taken as a reference value, V; and A and B are the fitting parameters.
In the whole column test, the porous medium was isolated from the air by sealing the sand medium with a liquid layer. The LNAPL saturation can be obtained as follows:
Sn=1-Sw (2)
where Sn is the LNAPL saturation.
2.4 Measurement of capillary pressure
2.4.1 Hydrophilic and hydrophobic tensiometers
The hydrophilic tensiometer is commercially available for measuring pore water pressure. The hydrophobic tensiometer for measuring LNAPL pressure was obtained by spraying water-proof material to the ceramic cup of the tensiometer. Water was filled to different levels in an empty column step by step. Hydrophilic tensiometer was then utilized to measure the pressure at each level. The corresponding output voltage from the tensiometer was simultaneously recorded with the datataker. The hydrophobic tensiometer was calibrated with the LNAPL sample in a similar way.
2.4.2 Capillary pressure
In the LNAPL-water two-phase porous medium, the capillary pressure (pc) between the fluid pair of the LNAPL and water can be given as:
pc=pLNAPL-pwater (3)
where pLNAPL is the LNAPL pressure and pwater is the water pressure.
2.5 Water level control and water level fluctuation
The water level was initially 1 cm above the sand sample inside the column and 45 cm above the bottom of the column. Water level fluctuation was obtained by moving the water tank up and down to scheduled levels. Two cycles of water level fluctuation were conducted in this column test. Each cycle started with one water level falling and ended with one water level rising, resulting in a drainage and an imbibition in sequence. The variety of water level during the whole column test is shown in Fig.4.
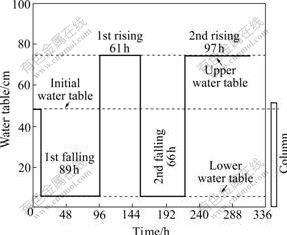
Fig.4 Variation of water level in water tank over testing time during column test
2.5.1 Water level falling
The water level of the water tank (shown in Fig.1) was lowered directly from 45.0 to 5.5 cm above the bottom of the column. The pore water in the sand flowed slowly out of the column, and the pore occupied originally by water was simultaneously replaced by the LNAPL from the top of the column. The LNAPL thickness above the upper sand surface was maintained 1.0 cm via a spillway (in Fig.1).
2.5.2 Water level rising
The water level elevation was raised from 5.5 to 74.3 cm above the bottom of the column. Water was infiltrated into the sand from the bottom of column, and the pore LNAPL was compelled out of the column via the spillway. The process continued until only water flowed out of the spillway, producing a residual LNAPL saturation within the sand. Above the upper sand surface, the liquid (firstly the LNAPL, then a mixture of water and the LNAPL, eventually nearly pure water) thickness was maintained to be 1.0 cm.
3 Results and discussion
3.1 Calibration of electrical conductivity probe
The sand sample was fully saturated with water. When the sample was drained to its residual condition, the output voltage across the resistance connected with the ECP in series is shown in Fig.5. It shows that, the total process from the fully saturated to residual condition could be divided into three phases, i.e., the fully saturated, drainage, and residual condition. V0 is the output voltage from the ECP when the sand is fully saturated with water. Before the drainage began, all the voltages approached to a constant value, i.e., V0. When the drainage began the voltage decreased with the decrease of the water saturation until the drainage approached to its residual condition. Then, the voltage approached to a constant smaller value, compared that of with the full saturation condition. It can be found that there is a distinct monotony relationship between the voltage and the water saturation. The variation of voltage from the ECP with the change of water saturation can thus be used to measure the water saturation in the sandy medium.
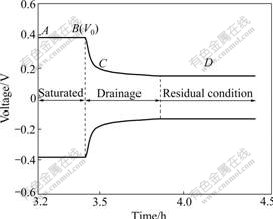
Fig.5 Changes of signal amplitude from fully saturated condition to residual saturation condition in complete drainage process
A series of trial column tests were conducted before formal tests, and V0 of one test was found to be slightly different from that of the other one. It was also found that the magnitude of V0 was affected obviously by the diameter of the needle of the ECP. The stability of V0 decreased with the decrease of the needle diameter. The main reason was considered to be the difference of the medium structure and the contact difference between the needle of the ECP and the sand particles in these column tests. If the diameter of the ECP needle was much smaller than that of the sand particles, it would be more difficult to keep the contact areas and angles constant in different tests, and different V0 values were thus produced. Compared with the size of sand particles, thicker needle was more effective to obtain stable V0 values in different tests. However, thick needle would affect the structure and the water flow inside the sample. It was important to choose a feasible size for the needle to produce a constant V0 and a non-destructive situation in a porous medium. In our tests, needles of 2.0 cm in length by 0.1 cm in diameter were selected for the ECP electrodes. The diameter of the needle was 5-10 times larger than the average diameter of the sand particles.
Iron needle had low corrosion resistant ability when the ECP was plugged into the sand containing 0.05 mol/L sodium chloride solution for two or three months, gold-plated needles were thus used to make the ECP electrodes in our tests.
When the sand is dry, no current exists in the circuit. The ECP was calibrated under the same condition as the formal column test. The monotonic relation between output voltage and water saturation in the LNAPL-water sandy system is shown in Fig.6. V0 was used as the reference value to normalize the calibration data. Feasible size of ECP needle and V0 used as the reference value could decrease the individual test difference as much as possible. This suggests that it is reasonable to use the ECP to measure water content of a porous medium.
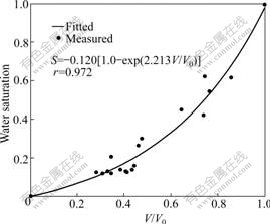
Fig.6 Relationship between voltage index (V/V0) from ECP and water saturation of sandy medium
3.2 Calibration of tensiometer
Each set was composed of one hydrophilic tensiometer and one hydrophobic tensiometer. The calibration results of hydrophilic and hydrophobic tensiometers are shown in Fig.7. The correlation coefficients almost approached to 1.0. A good linear relation existed between the signal voltage and the pressure. It was also found that the durability of the hydrophobic tensiometer decreased when it was plugged in the sandy medium for two months or more. Accordingly, the waterproof material was sprayed onto the ceramic cup surfaces of these tensiometers before each new test began.
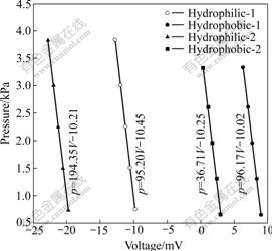
Fig.7 Relationship between pore liquid pressure and output voltage from tensiometer
3.3 S-p relation under water level fluctuation
The changes of both water saturation and capillary pressure over time, measured during the water level fluctuation, are shown in Fig.8. The fluctuation resulted in two cycles of drainage and imbibition, i.e., the first drainage, the first imbibition; the second drainage, and the second imbibition, respectively. The S-p relations measured during the whole fluctuation of water level are shown in Fig.9. In the first drainage resulting from the first descent of water level, the water saturation decreased from 1.00 to 0.22, and the LNAPL saturation accordingly increased from 0 to 0.78. In the first imbibition resulting from the first ascent of water level, the water saturation increased from 0.22 to 0.50, and the LNAPL saturation accordingly decreased from 0.78 to 0.50. Then, in a similar way, in the second descent of water level, the water saturation decreased from 0.50 to 0.30, and the LNAPL saturation accordingly increased from 0.50 to 0.70. In the second ascent of water level, the water saturation increased from 0.30 to 0.47, and the LNAPL saturation accordingly decreased from 0.70 to 0.53. It can be found that a good and reasonable correspondence existed among saturation, capillary pressure and water level fluctuation. The combination of ECP, T5 tensiometer and data taker can be used effectively for the online dynamic measurements of both S-p relation and LNAPL saturation in a sandy medium. The smooth S-p relation curve and all the related parameters under complex water level fluctuation could be obtained by fitting the measured S-p relation data with S-p relation model (also shown in Fig.9).
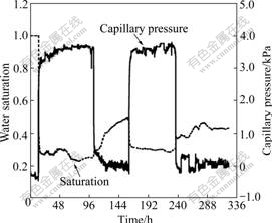
Fig.8 Variation of water saturation and capillary pressure over time in process of water level fluctuation
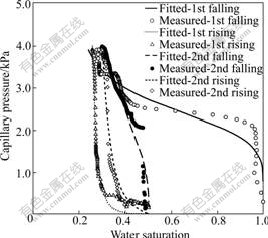
Fig.9 Water saturation-capillary pressure relations measured under two cycles of water level fluctuation
The testing time of S-p relation for a single complete drainage could be controlled to be less than 60 min (shown in Fig.5), which was dependent on the water flow speed inside the sand sample controlled manually with pumps. In our tests, two cycles of water level fluctuation were produced. It takes totally about 350 h to measure the S-p relations and the residual saturations, including the time enough long for obtaining stable residual LNAPL saturations, showing that there existed good durable performance of both ECP and hydrophobic tensiometer. This suggests that, compared with the traditional methods mentioned above, our online method can quickly characterize LNAPL migration in porous media with complicated multiphase flow.
All the measurements were conducted without stopping the water flow for equilibrium of pressure, which suggests that it is possible to achieve a smooth S-p curve, and the spatio-temporal distribution of the LNAPL contaminants with several couples of ECP and tensiometer assembled along the column. The diameter of the ECP needle was much smaller than that of the commercial TDR products, which was contributive to make a non-destructive situation for the fluid flow inside the sandy medium. Therefore, the combination of small size ECP and tensiometer is a successful method for the laboratory-scale purposes.
Furthermore, the traditional methods mentioned above (e.g., pressure cell method) require a complete drainage or imbibition process to be divided into several periods with different pressure levels, and the sample requires a state of static equilibrium to obtain a pair of saturation and capillary pressure at each test pressure level. The S-p relation curve fitted with these discrete data of saturation and capillary pressure at different pressure levels may be not so smooth. The shape and the related parameters of S-p relation models measured with the traditional methods may also be different from those of the actual condition where the pore fluids (i.e., air, LNAPL or water) may migrate without any stopping in the porous media. Although some traditional methods (e.g., Buchner funnel from pressure cell method) are still used [17] due to their low invest, our online dynamic method may accord with the actual water flow condition more closely in porous media.
4 Conclusions
(1) A distinct monotonic nonlinear relation exists between the output voltage of electrical conductivity probe and the water saturation in a sandy medium. Electrical conductivity probe is feasible to online measure the water saturation of the sandy medium.
(2) In order to obtain a stable output signal from the electrical conductivity probe, 0.1 cm in diameter of the ECP electrode, 5-10 times larger than the average diameter of the sand particles, are considered to be feasible.
(3) Hydrophobic tensiometer can be produced by spraying waterproof material to the surface of the ceramic cup of commercially available hydrophilic tensiometer to measure LNAPL pressure in a sandy porous medium.
(4) The new online dynamic method can quickly characterize the S-p relation in a sandy medium, and shows good durable performance and feasibility in sandy porous medium with complicated multiple phase flow.
(5) The combination of ECP and tensiometer does not need to divide a complete drainage or imbibition process into several periods with different pressure levels, and the sample does not require a state of static equilibrium to obtain the saturation and capillary pressure at each test pressure level. This online dynamic method may more precisely characterize the actual water flow condition in porous media than the traditional methods.
(6) Signal from electrical conductivity probe is medium-specific, and signal drift may also exist after a long-time test, it will be necessary to study further to increase the signal stability and decrease the accuracy drift in the future.
Acknowledgements
The authors gratefully acknowledge Dr. K. ENDO, Research Center for Material Cycles and Waste Management, National Institute for Environmental Studies, Japan, for his great support on the column test.
References
[1] KECHAVARZI C, SOGA K, ILLANGASEKARE T H. Two-dimensional laboratory simulation of LNAPL infiltration and redistribution in the vadose zone [J]. Journal of Contaminant Hydrology, 2005, 76: 211-233.
[2] OOSTROM M, HOFSTEE C, WIETSMA T W. Behavior of a viscous LNAPL under variable water table conditions [J]. Soil and Sediment Contamination, 2006, 15: 543-564.
[3] DOBSON R, SCHROTH M H, ZEYER J. Effect of water-table fluctuation on dissolution and biodegradation of a multi-component, light nonaqueous-phase liquid [J]. Journal of Contaminant Hydrology, 2007, 94: 235-248.
[4] FRETWELL B A, BURGESS W G, BARKER J A. Redistribution of contaminants by a fluctuating water table in a micro-porous, double-porosity aquifer: Field observations and model simulations [J]. Journal of Contaminant Hydrology, 2005, 78: 27-52.
[5] GELLER J T. Acoustic detection of immiscible liquids in sand [J]. Geophyscial Research Letters, 2000, 27(3): 417-420.
[6] LENHARD R J, JOHNSON T G, PARKER J C. Experimental observations of nonaqueous-phase liquid subsurface movement [J]. Journal of Contaminant Hydrology, 1993, 12: 79-101.
[7] KECHAVARZI C, SOGA K, WIART P. Multispectral image analysis method to determine dynamic fluid saturation distribution in two-dimensional three-fluid phase flow laboratory experiments [J]. Journal of Contaminant Hydrology, 2000, 46: 265-293.
[8] BOB M M, BROOKS M C, MRAVIK S C, WOOD A L. A modified light transmission visualization method for DNAPL saturation measurements in 2-D models [J]. Advances in Water Resources, 2008, 31: 727-742
[9] PETER K, REIMAR B, CARLA R, PETR U, JAN V, HARRY V, ERWIN K. Fluorescence macrophotography as a tool to visualise and quantify spatial distribution of deposited colloid tracers in porous media [J]. Colloids and Surfaces A: Physicochem Eng Aspects, 2007, 306: 118-125.
[10] XIE Xiao-xi. Study on the residual saturation of a non-wetting phase fluid in a sandy medium [D]. Guangzhou: Sun Yat-sen University, 2009. (in Chinese)
[11] LIU Han-le, ZHOU Qi-you, WU Hua-qiao. Determination of saturation distribution of light non-aqueous phase liquid based on electric resistivity tomography [J]. Journal of Hydraulic Engineering, 2008, 39(2): 189-195. (in Chinese)
[12] LIU Han-le, ZHOU Qi-you, WU Hua-qiao. Laboratorial monitoring of the LNAPL contamination process using electrical resistivity tomography [J]. Chinese Journal of Geophysics, 2008, 51(4): 1246-1254. (in Chinese)
[13] SEPPALA K, NARVANEN T, ANTIKAINEN O, RAIKKONEN H, HEINAMAKI J, YLIRUUSI J. A new method for online measurement of moisture content during fluid-bed granulation [J]. European Journal of Pharmaceutical Sciences, 2008, 34(1): 32-41.
[14] XU Jian-hui. Study on the measurement method of tantalum capacitance sensor for reservoir physical model saturation [D]. Beijing: China University of Petroleum, 2007. (in Chinese)
[15] KAMON M, ENDO K, KATSUMI T. Measuring the k-S-p relations on DNAPLs migration [J]. Engineering Geology, 2003, 70(3/4): 351-363.
[16] KAMON M, LI Y, ENDO K, INUI T, KATSUMI T. Experimental study on the measurement of S-p relations of LNAPL in a porous medium [J]. Soils and Foundations, 2007, 47(1): 33-45.
[17] SHARMA R S, MOHAMED M H A. An experimental investigation of LNAPL migration in an unsaturated/saturated sand [J]. Engineering Geology, 2003, 70(3/4): 305-313.
Foundation item: Project(8151027501000008) supported by Guangdong Natural Science Foundation, China; Project(2007490511) supported by the Open Foundation of State Key Laboratory of Hydrology-Water Resources and Hydraulic Engineering, Hohai University, China; Project (2006K0006) supported by the Open Foundation of Guangdong Provincial Key Laboratory of Environmental Pollution Control and Remediation Technology, China
Received date: 2009-04-18; Accepted date: 2009-07-07
Corresponding author: LI Yan, PhD; Tel: +86-20-84110855; E-mail: eesly@mail.sysu.edu.cn
(Edited by YANG You-ping)
Abstract: An online dynamic method based on electrical conductivity probe, tensiometer and datataker was presented to measure saturation-capillary pressure (S-p) relation in water-light nonaqueous phase liquid (LNAPL) two-phase sandy medium under water level fluctuation. Three-electrode electrical conductivity probe (ECP) was used to measure water saturation. Hydrophobic tensiometer was obtained by spraying waterproof material to the ceramic cup of commercially available hydrophilic tensiometer. A couple of hydrophilic tensiometer and hydrophobic tensiometer were used to measure pore water pressure and pore LNAPL pressure of the sandy medium, respectively. All the signals from ECP and tensiometer were collected by a data taker connected with a computer. The results show that this method can finish the measurement of S-p relation of a complete drainage or imbibition process in less than 60 min. It is much more timesaving compared with 10-40 d of traditional methods. Two cycles of water level fluctuation were produced, and four saturation-capillary pressure relations including two stable residual LNAPL saturations of the sandy medium were obtained during in 350 h. The results show that this method has a good durable performance and feasibility in the porous medium with complicated multiphase flow. Although further studies are needed on the signal stability and accuracy drift of the ECP, this online dynamic method can be used successfully in the rapid characterization of a LNAPL migration in porous media.
