

J. Cent. South Univ. (2018) 25: 1732-1745
DOI: https://doi.org/10.1007/s11771-018-3864-y

Quantitative and qualitative correlation analysis of optimal route discovery for vehicular ad-hoc networks
MUKUND B. Wagh, GOMATHI N.
Department of CSE, VEL-TECH Dr. RR & Dr.SR Technical University, Avadi, Chennai-600 062, India
 Central South University Press and Springer-Verlag GmbH Germany, part of Springer Nature 2018
Abstract:
Vehicular ad-hoc networks (VANETs) are a significant field in the intelligent transportation system (ITS) for improving road security. The interaction among the vehicles is enclosed under VANETs. Many experiments have been performed in the region of VANET improvement. A familiar challenge that occurs is obtaining various constrained quality of service (QoS) metrics. For resolving this issue, this study obtains a cost design for the vehicle routing issue by focusing on the QoS metrics such as collision, travel cost, awareness, and congestion. The awareness of QoS is fuzzified into a price design that comprises the entire cost of routing. As the genetic algorithm (GA) endures from the most significant challenges such as complexity, unassisted issues in mutation, detecting slow convergence, global maxima, multifaceted features under genetic coding, and better fitting, the currently established lion algorithm (LA) is employed. The computation is analyzed by deploying three well-known studies such as cost analysis, convergence analysis, and complexity investigations. A numerical analysis with quantitative outcome has also been studied based on the obtained correlation analysis among various cost functions. It is found that LA performs better than GA with a reduction in complexity and routing cost.
Key words:
vehicular ad-hoc network; lion algorithm; fuzzy; quality of service; routing��
Cite this article as:
MUKUND B. Wagh, GOMATHI N. Quantitative and qualitative correlation analysis of optimal route discovery for vehicular ad-hoc networks [J]. Journal of Central South University, 2018, 25(7): 1732�C1745.
DOI:https://dx.doi.org/https://doi.org/10.1007/s11771-018-3864-y1 Introduction
Improving the safety of roads with time-to-time information from transport authorities and drivers is a significant focus nowadays. An improved approach for road safety is the use of the intelligent transportation system (ITS) [1]. ITS has varied applications, including collision prevention, vehicle safety, real-time detour route computation, control of traffic flow, blind crossing, and traffic monitoring, besides non-safety applications such as automated toll payment, nearby information services, and infotainment services [2].
ITS in a vehicular network comprises vehicular cellular network (VCN) and vehicular wireless local area network (V-WLAN). V-WLAN is dependent on the access points that are placed at the intersections of traffic and VCN is dependent on a group of fixed cellular gateways. There exist several issues in the vehicular networks of ITS, including geographic limitations and high costs, which significantly reduce the network transmission range, thus leading to problems in interaction [3].
In ITS, vehicular ad-hoc network (VANET) is a significant technology employed to play a major role in the smart cities that are to be constructed later by enhancing road safety and offering creative services associated with infotainment applications and traffic management [4]. It can be used to digitalize the communication data among roadside users and vehicles [5]. However, the routing protocols implemented for VANETs face several issues, including connectionless geographic forwarding [6] and connection-dependent restricted forwarding, Q-learning routing protocol [7], robust mobility adaptive clustering [8], and estimated- distance- based routing protocol [9].
Although many improvements have been made in vehicular networks, there is an issue of describing routes that are optimal for transportation of vehicles. To overcome these issues, several routing techniques have been recently proposed for VANETs. The initial goal of the routing algorithm is to describe a route that is optimal for vehicles, where the term ��optimal�� indicates various aspects of route quality, such as high radio access, minimum distance, and high QoS awareness. Some such techniques existing in the literature are reviewed and discussed below.
For finding solutions to the features of routing cost designs, this study employs a newly established lion algorithm (LA) [10, 11], which was accomplished as a search algorithm [12] and came out with some modifications in 2014. As the algorithm has been established for its capacity to explore in large-scale crisis area, it was implemented for finding solution to route selection design. However, the major procedures of LA, including crossover, encoding, and mutation, are not appropriate for managing the model of the issue. Therefore, a mutation process, two-dimensional crossover, and modified encoding principle are introduced in this paper. Consequently, the contributions of this paper are specified as follows.
This work contributes a route selection design by focusing on noteworthy routing costs such as collision cost, congestion cost, and travel cost. Fuzzy intelligence is deployed to obtain the cost to be acquired by QoS. Furthermore, a newly established optimization technique, called the lion algorithm [10], is exploited, for which modified versions of crossover, encoding, and mutation operations are implemented. These processes are performed in two dimensions instead of one dimension.
2 Literature review
2.1 Related work
EIZA et al [13] deployed the situational awareness concept and ant colony system-based algorithm for improving the situation-aware multi- constrained QoS (SAMQ) routing technique for VANETs. They calculated the possible routes among the vehicles focusing on the numerous QoS constraints and chose the best route for precise transmission of data. The improved technique resolves the NP-hard problems for exploring the possible routes. ZHOU et al [14] investigated the vehicle routing issue with time windows and developed a local search-dependent multi-objective optimization technique. They further established several local search techniques for optimizing the objects. The improved technique was simulated with 45 real-time datasets and demonstrated improved solutions. YANG et al [15] introduced a novel optimal electric vehicle route design to minimize the entire cost of distribution of the electric vehicle route pointing to other factors such as recharging time and battery capacity. They further introduced a learnable partheno-genetic technique with a combination of customer selection and subject knowledge on an electric vehicle charging station. However, the implemented technique faces challenges in terms of energy saving and decreasing carbon emission. AHRENS et al [16] suggested techniques for routing in sophisticated nodes of technology. They adopted the multi-label interval-dependent shortest path technique for long on-track relations, and united the industrial router with the Bonn route for addressing the problems in the proposed model.
EIZA et al [17] presented an inventive safe and precise multi-constrained QoS-aware routing technique for VANETs. They deployed the ant colony optimization algorithm to discover the possible routes in VANETs that are subjected to QoS and calculated by determining the type of data traffic. They also performed the possibility tests on routing control messages through the absolute form of evolving graph design. The improved secure QoS routing technique guarantees improved security in wireless networks.
2.2 Review
As mentioned in the previous sections, intelligent routing is a major apprehension in achieving the QoS for VANETS. This review has established numerous routing methods for the structural design of VANETs in various surroundings. For example, a routing mechanism based on SAMQ was established in Ref. [13], while the vehicle routing crisis with time windows was proposed in Ref. [14]. In Ref. [15], several practical vehicle routing issues were measured by establishing the resource and environmental constraints. The issues in designing with the BONN router were addressed in Ref. [16]. However, the crisis in routing takes various such mentioned formulations, the fundamental presumption behind them being to achieve QoS, and the fundamental design of routing issues can be expressed as a multi-constrained QoS-aware routing crisis, as given in Ref. [17]. The limitations include efficiency, security, resource utility, and reliability. As the involvement of Ref. [16] in the current literature is on the level of architecture, the remaining studies are focused on in this work.
Among the reviewed mechanisms, swarm intelligence, particularly ant colony optimization, plays a significant role. In Ref. [13], an ant colony system was established to resolve SAMQ and the conventional ant colony optimization was deployed to find solution to the multi-constrained routing crisis. Although the ant colony-dependent swarm intelligence remains prominent for its fine-grained exploring capacity, it is considered as a local search optimization technique. Therefore, a multimodal surrounding will create a significant limitation to these methods, owing to its enormous number of local optimal points and the lack of ability of the algorithm to elude from such points. Alternatively, the algorithms dependent on growth, such as genetic algorithms have been considered as promising [15]. The disadvantages of these algorithms are their extreme random searching and the coarse-grained exploring capacity. For prevailing over such effects, a modified optimization technique was detailed in Ref. [14]. However, the crisis area is multi-objective and the exploring nature of the technique is mainly dependent on the local neighborhood. Therefore, an appropriate intelligent method can be adopted to manage the issues in vehicle routing.
3 Algorithm background
Based on the natural behavior of a lion [18], LA was introduced in Ref. [11]. Corresponding to LA, for finding a random solution, the solutions must be strong, and hence, the disappearances of the weak lions or weak solutions occur from the solution pool. The solution that performs or wins among the various solutions remains a stronger solution, which happens owing to the weakness of certain solutions or laggard lion. This paper deploys the LA implemented in Ref. [10], which is further reconstructed from its earlier version [12]. The reconstructions are performed by altering the crossover operation, evaluation phase of fertility, and gender clustering technique. The technique is explained in Ref. [10]. The limitations of employing the traditional LA technique are described in Ref. [10], where the LA technique was implemented to find solution to a common optimization crisis concerning a row vector as the solution design. Nevertheless, the issue needs a matrix as the model for the solution. Therefore, the LA or any other recent optimization technique cannot be deployed. Such challenges continue throughout the LA measures, such as crossover, encoding, and mutation, which are the main steps of LA processing. The architecture of the LA technique is given in Figure 1.
4 Route selection framework
A schematic demonstration of the vehicles moving to various locations is presented in Figure 2. The chosen network comprises vehicles shifting to locations L1�CL9, moving at a stable velocity. A particular access point (AP) enclosing the entire location is addressed as AP1, AP2, AP3 and AP4 with similar area coverage. Most vehicles shift from location 4 to location 6. The coverage issue occurs if the routing process is not optimal. Hence, it is better to choose a correct route for acquiring the maximum coverage. In addition, there is no hub of traffic with any conflict. All APs are capable of managing the quantity of vehicles. More vehicles often end up causing congestion in the specific area of coverage. For example, the vehicles shifting to locations 1, 2, 4 and 5 contribute a general point of access AP1, while those moving to locations 3 and 6 share a general access point AP2; the instantaneous AP3 is contributed by vehicles shifting to locations 5 and 8. Note that the level of congestion is more in AP 4, which encloses locations 5, 6, 8 and 9. Thus, the QoS should be improved with a minimization in cost.
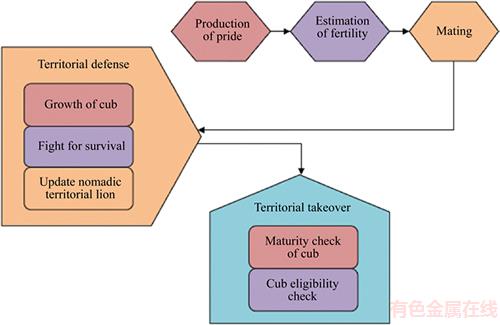
Figure 1 Architecture of LA technique
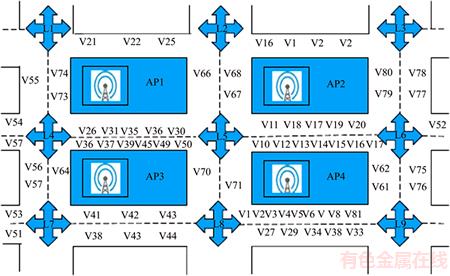
Figure 2 Network of vehicles moving on different paths
Let us consider the position where the selected vehicles move as Li, addressed by Li:i=1, 2, ��, Nnodes, where Nnodes is the number of location/nodes and i is the ith node/location. Let Vj be the jth vehicle, represented as Vj:j=1, 2, ��, Nvehicles, where Nvehicles is the number of vehicles contributed to the network. The APs exploited all through the network are given as Ak:k=1, 2, ��, NAP, where NAP is the entire quantity of the APs.
An AP involves its own area of coverage in which the locations of networks fall and that in which the vehicles are enclosed. The coverage area of all individual APs can be addressed as Ck such that  Therefore, the cardinality of the area of coverage is addressed as
Condition 1: Li is considered to be in the coverage of Ak only under the condition D(Li, Ak)<>c, where Rc is the radius of coverage.
Theorem 1: The sloping length of the network for offering coverage to all nodes can be specified as where the network dimension is indicated by Lnet.
Proof: Consider that all nodes are positioned in the same plane. Therefore,  where,
  and
and  As Li is addressed in the x�Cy coordinate system Li(x) represents the xth coordinate of Li and Li(y) indicates the yth coordinate of Li. If the nodes of the network start from the origin, the nodes in the corner can be described as (Xmax, 0) and (Ymax, 0).
Focusing on the Euclidean distance between the two points, the diagonal distance can be obtained as shown in Eqs. (1) and (2), where Xmax is the node length from the origin, Lnet. Hence, Eq. (2) can be rewritten as
 (1)
(1)
 (2)
(2)
 (3)
(3)
Travel cost: It is defined as the degree of time exhausted throughout the traveling that should be reduced in VANET.
Collision cost: It is defined as the degree of striking of a single vehicle aggressively against another vehicle or two or more vehicles that are being allocated in the same location.
Congestion cost: It is defined as the cost of VANET that comprises emissions of pollution and stress that result from the intrusion between vehicles in the traffic stream, mainly as a road��s capacity incremental delay, traffic volume approach, and operating costs of vehicles. In addition, the improved mobility can be accomplished by minimizing the congestion.
QoS cost: It is the cost of service necessary to facilitate the applications and users of the network to access the innovative potentials.
Total cost: Assume Pm,n to be a solution for the crisis in routing that is attained from LA, where Pm,n:m=1, 2, ��, Npaths and n=1, 2, ��, Nnodes such that  and Npaths=Nvehicles. The entire cost of routing the solution P is a combination of collision cost, congestion cost, travel cost, and QoS awareness cost [2] [5] is given as
 (4)
(4)
The cost for traveling, Ftravel, can be allocated as the cost required to travel from one position to another with respect to time, distance, or fuel, or a combination of all these. On focusing them as a distance matrix, Ftravel can be addressed in Eq. (5). Despite other features related to describing the entire cost required by a vehicle, the cost is almost proportional to the distance to be traveled by the vehicle. The remaining features are secondary variables, and undecided. Therefore, the distance matrix for describing the total cost is considered. In addition, the other parameters are focused on with respect to congestion cost, because the entire cost is based on the congestion of the particular path, as given in Eq. (5), where D(A, B) is the Euclidean distance between nodes A and B, which are described from the distance matrix.
 (5)
(5)
The cost of collision, Fcollision, is the probability of collision among the vehicles while they pass through the locations, and can be described by Algorithm 1.
Algorithm 1: Determine cost of collision
Input
Pm,n// path of vehicles
Output
Fcollision// collision cost
1 Set Fcollision=0// Initialize collision cost
2 for every node till NNodes�C1
3 Determine Un// unique number of nodes available
4 Determine Ncoll// Number of coding vehicles
5 Fcollision=PF��Ncoll+Fcollision
6 return Fcollision
Under the possibility of collision, a penalty function PF is factorized by the number of vehicles that are colliding, Ncoll, where Ncoll can be described as the number of vehicles that arrive simultaneously at a location at a particular instant of time, e.g., at nth instant.
The cost of congestion, Fcongestion, is illustrated depending on the number of vehicles that are being served by the AP at a provided instant, where  in Eq. (7) indicates the limit of congestion in the kth AP.
 (6)
(6)
 (7)
(7)
 (8)
(8)
The awareness cost of QoS, FQoS, is described by the fuzzy inference system, which calculates QoS factors such as congestion level of the AP and the received signal strength (RSS).
Fuzzy logic [19] adopts the non-numeric linguistic parameters for the QoS cost RSS, QoS factors, and congestion. Each linguistic parameter is allocated to a numerical value that indicates the fuzzy membership function. Table 1 corresponds to the fuzzy rules among the QoS features and the concerned cost. In case of low, moderate, and high levels of congestion at fair and good RSS, the QoS cost is zero, high, and high, respectively. However, in the worst situations of RSS with moderate, low, and high levels of congestion, the cost of QoS is low and high, correspondingly. Figure 3 reveals a fuzzy membership function of various QoS parameters that adopts the Gaussian design. The congestion degree of membership is adjusted to be low if it lies in interval [0, 2], moderate if it lies in interval [1, 2], and high if it lies in interval [1, 4]. Focusing on the RSS parameter, the membership degree is considered poor in the limit of [0, 3], fair in the range of [0, 10], and good in the range of [4, 10]. Focusing on the fuzzification cost of QoS, the membership degree lying in the range [0, 0.1] is defined as zero, in the range [0.2, 1] as high, and in the range [0, 1] as low.
Table 1 Fuzzy rules among QoS factors and cost
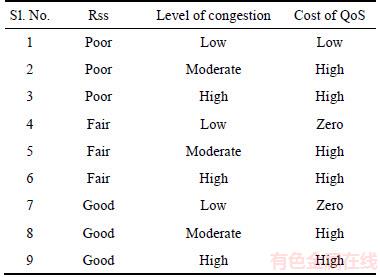

Figure 3 Fuzzification of QoS factors such as congestion level and RSS to describe QoS cost:
5 LA-based ORS
The initial process involves the generation of pride and fitness evaluation, where Xfemale,Xmale and Xmale of  and Xfemale of the pride are initialized, where Xfemale, Xmale, and
  are solutions for arbitrary functions that are indicated as P.
The fitness of Xmale, Xfemale, and , termed as f(Xmale),and
 are described through Eq. (4). Consequently, the processings are performed as f ref=f(Xmale) and Ng=0, where Ng indicates the production counter employed in the finalized step of the implementation process.
The pseudocode for the fertility assessment procedure is specified in Algorithm 2.
Algorithm 2: Estimation of fertility
Input: Xmale, Xfemale, f ref, Sr and Tr
Output: Xmale, Xfemale, f ref, Sr and Tr
// Xmale Evaluation
If f ref��f(Xmale)
Tr Tr+1
Tr+1
else
Reset Tr
f ref��f(Xmale)
// Xfemale Evaluation
If Sr is not tolerable
Set uc and gc to zero
Do
Calculate Xfemale+
gc��gc+1
If f(Xfemale+)<>female)
uc��1
Xfemale��Xfemale+
Reset Sr
Until gc reaches 
Return Xmale, Xfemale, f ref, Sr and Tr
In fertility estimation, the fertilities of male and female lions are tested and calculated for eradicating the convergence crisis at the local optima. Xfemale+, f ref, Sr, gc, Tr, and uc indicate the female generation count, efficient reference fitness, female lion, laggardness rate, female update count, and sterility rate, respectively [10].
Moreover, mating and growth of the cub are described in the mating procedure of LA, where Xmale and Xfemale go through mutation and crossover processes, related to any evolutionary optimization development [20�C23]. The procedure involved in crossover depends on the disorder rate of a lion [24] to generate Xcubs, such as male cub Xm_cub and female cub Xf_cub among Xcubs, which are determined based on the fitness levels [10]. The cub growth function refers to the local solution search function, where Xm_cub and Xf_cub are allowed for a random mutation with a given rate of Gr. The mutated Xm_cub and Xf_cub may substitute the old Xf_cub and Xm_cub if the changed Xf_cub and Xm_cub are improved over the previous Xf_cub and Xm_cub.
In the territorial takeover and defence phase, the protective defence supports in recognizing the exploration space with LA and can be well-organized as pride, survival fight, and nomad coalition. The territorial defence is provided in Algorithm 3 [10, 25, 26].
Algorithm 3: Defence of territory
Get nomad coalition
Select xe_nomad
If xe_nomad wins
xmale��xe_nomad
Remove xe_nomad from nomad world
Kill Xm_cub & Xf_cub
Reset age(cubs)
Defense result��1
Else
Update nomad coalition
Defense result��0
It can be represented as the procedure of offering territory to Xf_cub and Xm_cub as soon as they become mature and stronger than Xfemale and Xmale. Algorithm 4 describes the territorial takeover, where the process is started only if Acub��Amax; otherwise, the cub growth occurs.
Algorithm 4: Capture of territory
Input: Xmale, Xm_cub, Xfemale, Xf_cub, Sr
If f (Xmale)>f (Xm_cub)
Xmale=Xm_cub
Xold=Xfemale
If f (Xfemale)>f (Xf_cub)
Xfemale=Xf_cub
If Xfemale Xfemale��Xold
Clear Sr
The algorithm terminates when the number of fitness evaluations exceeds the limit. Once the algorithm is terminated, Xmale is returned as the optimal route for the network vehicles.
2D Crossover: The conventional crossover technique offers solution for only 1D problems. The problem of vehicles, including the entire cities and congestion, occurs owing to the movement of all vehicles to the particular target. Considering this issue, a novel 2D crossover technique is implemented, as shown in Figure 4. The destination of the algorithm is reached when the amount of fitness estimation crosses the limit. If the algorithm is finished, Xmale is brought back as the best route for network vehicles.
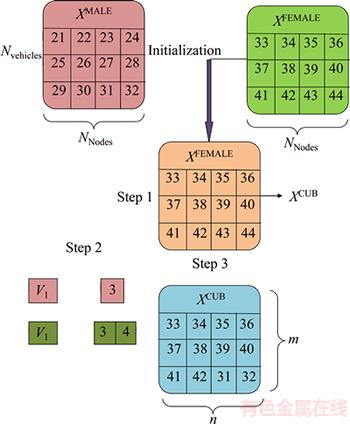
Figure 4 Implemented 2D crossover
Let us assume V1 and V2 as the vector numbers, as shown in Eqs. (9) and (10), where Ru|u�C1,2(x) indicates the random integer produced within the [1, x] interval and ��(x|y) provides y permutated elements of the sequence 1 to x.
 (9)
(9)
 (10)
(10)
In the crossover process, Xcubs elements are assigned by Xfemale elements, and then, the Xmaleelements are initialized merely if it gratifies the number of nodes, n, and the number of vehicles, m, belonging to V2 and V1, respectively.
In Figure 4, the 2D crossover Xcubs is produced by performing a crossover between Xfemale and Xmale. Here, V1 corresponds to the particular row and V2 signifies the particular column of the matrix in which the crossover has to be computed. Subsequent to the initialization of Xfemale, a crossover is employed for the second and third columns and second row of the matrix, as shown in Figure 4. Consequently, the points (18, 19) in the particular position of Xfemale are substituted by (6, 7) of Xmale, which is the outcoming Xcubs following the crossover process. Subsequently, it ensures the possibility of the generated Xcubs, and replicates the process if it does not gratify the suitable possible situation.
2D Mutation: For proper management of the 2D issue occurring in mutation, 2D mutation is implemented and demonstrated in Figure 5. On this basis,  obtains the input and produces
  . Consequently, the mutation points MP1 and MP2 are measured through Eqs. (11) and (12), respectively.
 (11)
(11)
 (12)
(12)
The solutions of mutation  are explained as shown in Eq. (13)

 (13)
(13)
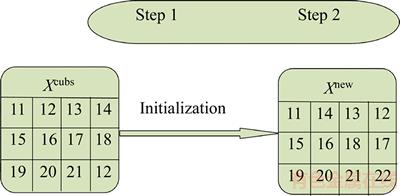
Figure 5 Implemented 2D mutation
6 Simulation results
6.1 Experimental setup
The experimental simulation of the route selection design is performed in MatLab with four chosen network areas by using GA and LA. The computations are performed in four configurations at changing vehicle numbers, and the instants include 80 cities with 50 vehicles, 70 cities with 40 vehicles, 100 cities with 70 vehicles, and 90 cities with 60 vehicles. In addition, the employed factors of the LA technique are obtained from Ref. [10], while the GA algorithm comprises selection rate of 0.5, population size of 10, mutation rate of 0.1, and crossover rate of 0.5. The experimentation is carried out 100 times to acquire the required result. For detecting the performance, the median, mean, deviation, best and worst are calculated. Comparative investigations are performed between the two algorithms to find which algorithm is better.
6.2 Cost analysis
The common correlation prevailing between each routing cost under GA and LA performance is demonstrated in Figures 6�C9. In Figure 6, the reduction in congestion price obtained through the LA technique is 80% and 0.25% superior to that obtained through the GA technique for and configurations, respectively, and the cost reduction of QoS obtained through the LA technique is 0.892% better than the GA technique for the fourth configuration. Moreover, the minimization of travel cost obtained by the LA technique is 0.144%, 0.203%, 0.226% and 0.14% better than that obtained by GA for the first, second, third, and fourth configurations, respectively. The costs of collision created by GA and LA overlap one another in all models and rise over the improvement in the entire cost. The entire cost is improved with an increase in cost of congestion under GA and LA operations for the first, second, third, and fourth configurations, respectively. The cost of congestion is minimized under GA procedure for the second,third, and fourth network configurations. Table 2 shows that when the total cost is 927263.3, the proposed method in terms of collision cost, congestion cost, QoS cost, and travel cost is 0.97%, 88.6%, 76.1%, and 0.6% better than the GA technique. Thus, the performance of the proposed LA method is verified.
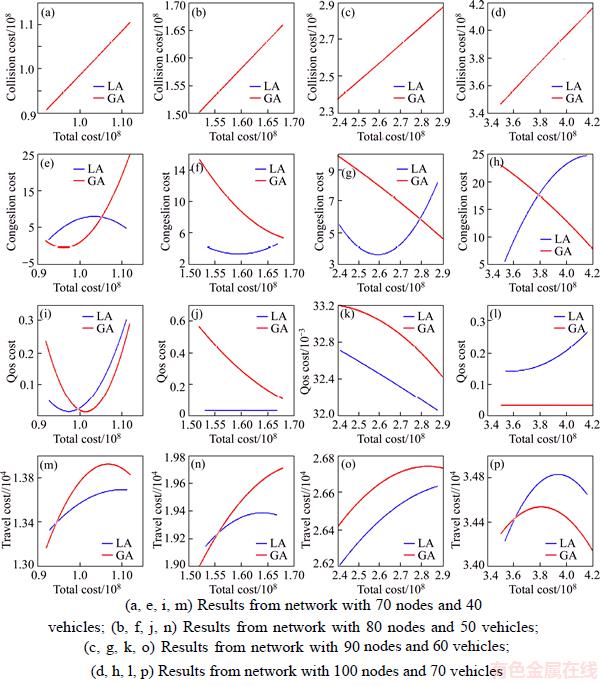
Figure 6 Mutual correlation between total cost and other costs:
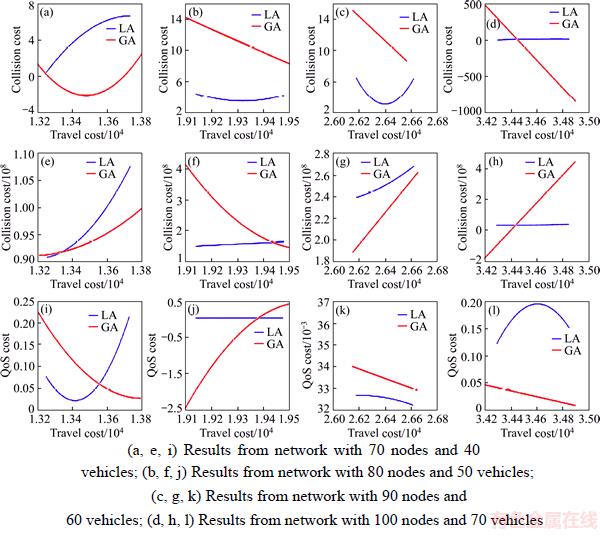
Figure 7 Mutual relation between travel cost and other costs:
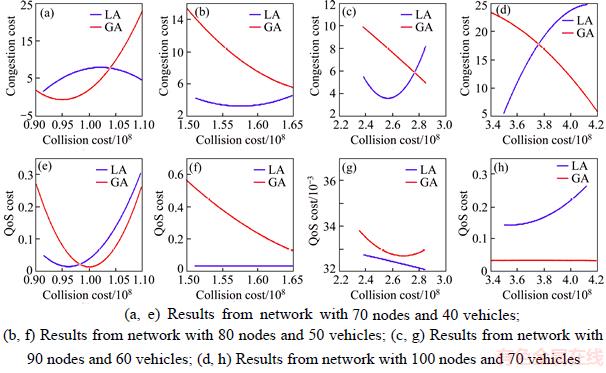
Figure 8 Mutual relation between collision cost and congestion cost, QoS cost:
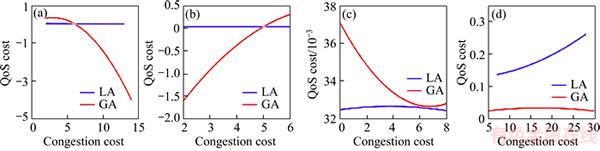
Figure 9 Mutual relation between congestion cost and QoS cost for the network configuration with 70 nodes and 40 vehicles (a), 80 nodes and 50 vehicles (b), 90 nodes and 60 vehicles (c), and 100 nodes and 70 vehicles (d)
Table 2 Mutual correlation between total cost and other costs

Table 4 Mutual correlation between travel cost and other costs
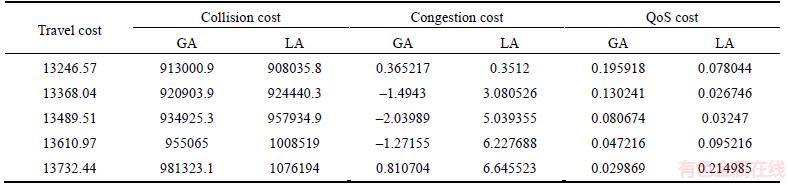
As shown in Figure 7, the cost of congestion is improved with an increase in the cost of travel in both GA and LA processes for the first network configuration. In contrast, the cost of congestion is reduced in GA and LA operations for the third and second network configurations, respectively. In the fourth network configuration, the cost of congestion remains stable under the LA operation. The evaluation of cost for travel against that of collision indicates that the cost of travel is significantly improved under LA and GA operations for all network configurations except for the second configuration in the GA operation. In LA operation, the QoS cost reduces with increase in travel cost for the second, third, and fourth network configurations and increases for the first configuration. On the contrary, in the GA operation, the QoS cost reduces with an increase in travel cost for the first, third, and fourth network configurations and increases for the second configuration. The congestion cost increases with the travel cost for all network configurations, except for the first configuration, and vice-versa. Therefore, the description of cost for congestion by using the LA technique is 0.25% and 50% better than the GA technique for the third and second configurations. On the other hand, in the fourth configuration, the cost reduction of LA is 0.95% worse than the LA technique, while the presentation of the LA technique concerning the cost minimization of QoS shows 0.030% and 100% improvement over the GA technique for the third and second configurations. Similarly, Table 3 shows that when the travel cost is 13246.57, the proposed method in terms of collision cost, congestion cost, and QoS cost is 0.54%, 3.8%, and 60.1% better than the GA technique. Thus, the performance of the proposed LA method is verified.
In Figure 8, when distinguishing the collision cost from the congestion cost, the LA technique exhibits slightly increased cost of congestion with an increase of about five in the cost of collision for the first configuration. Nevertheless, in the GA process, the collision and congestion costs are much increased. Based on the second configuration, both LA and GA demonstrate an inversely proportional relation between congestion and collision costs. The cost of congestion reduces with an increase in collision cost in the GA process for the third configuration, while under the LA technique, the cost of collision shows an increase of up to 2.9��106 at higher cost of congestion. According to the fourth configuration of the network, the cost descriptions of both techniques overlap each other. The convergence of GA demonstrates better cost of collision with an increase in the cost of congestion and the LA convergence technique exhibits decreased cost of congestion with an increase in collision cost. Consequently, the congestion cost reduction computation by the LA technique is 0.2% and 22.5% better than that achieved by the GA algorithm for the second and first configurations. Nevertheless, the second and third configurations attain 0.030% and 0.15% improvement in performance in LA over the GA algorithm. Similarly, Table 4 shows that when the collision cost is 914013.6, the proposed method in terms of congestion cost and QoS cost is 89.3% and 76.1% better than the GA technique. Thus, the performance of the proposed LA method is verified.
On distinguishing the collision cost with QoS cost, the cost of collision continues to increase with QoS cost in LA operation for the first and fourth configurations. Both curves overlap at 0.98��106 cost of collision. On the other hand, in the GA process, the QoS cost is reduced for the second, third, and fourth configurations. In Figure 9, the cost of QoS remains stable for changing cost of congestion in LA operation for the first, second, and third network configurations. Under the GA process, a stable QoS factor is noticed for the fourth network configuration; however, the cost of QoS increases and decreases for the third and first configurations and second and fourth configurations, respectively, i.e., the reduction in QoS cost in the LA technique is 0.030% superior to that in the GA algorithm. Similarly, Table 5 shows that when the congestion cost is 2, the proposed method in terms of QoS cost is 85.7% better than the GA technique. Thus, the performance of the proposed LA method is verified.
Table 4 Mutual correlation between collision cost and other costs
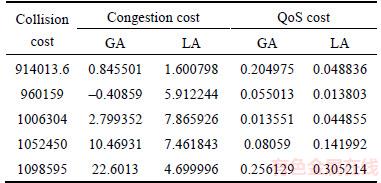
Table 5 Mutual correlation between congestion cost and QoS cost

6.3 Convergence analysis
Figure 10 indicates the graphs for the four network configurations for a study on convergence by accounting for both LA and GA. In the network with 70 nodes and 40 vehicles, the convergence rate is higher in LA than that in GA. Primarily, the curves overlap one another, and deviate over the increasing amounts of estimation. The LA curve exhibits the best convergence, which demonstrates the minimization in cost of routing above GA. However, the GA curve bends less than the LA curve only at a particular point, and the deviational variation is large. The routing cost is calculated as 0.95��106, 1.55��106, 2.4��106 and 3.6��106 for LA in network configurations 1, 2, 3 and 4, respectively. On the other hand, in the network with 90 nodes and 60 vehicles, both curves overlap each other at 2.5��106 routing cost. The representation with 100 nodes and 70 vehicles has the highest convergence among the four designs, and the point of convergence is more at 10000 estimations. The routing cost in Figure 10 is not constant when converging, which utilizes the polynomial design to encourage appropriate smoothing for the curve. The convergence concerning the routing cost by using the LA technique shows 3.77%, 3.06%, 3.6%, and 0.6% improvement over the GA technique for the four network configurations. Thus, LA computation clearly outperforms the GA technique.

Figure 10 Convergence on describing best route by GA and LA for network with 40 vehicles and 70 nodes (a), 50 vehicles and 80 nodes (b), 60 vehicles and 90 nodes (c), and 70 vehicles and 100 nodes (d)
6.4 Computation overhead
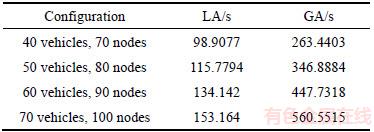
The performance time acquired by GA and LA to describe the optimal route for different network configurations is given in Table 6. The outcomes indicate that the computation time is significantly reduced for all network models using the LA technique. The LA technique records at least 60% minimization of performance time over the GA technique for describing the optimal route. To a maximum, the process of LA minimizes 70% of the cost acquired by GA for describing the route for the fourth network configuration.
Table 6 Computation time acquired by GA and LA
7 Conclusion and future work
This work presented the various objective constraints needed for resolving a vehicle routing issue for VANET. Hence, the issue of vehicle routing design, which mostly relies on the congestion, collision, QoS, and travel costs, was implemented. The QoS-dependent cost function was explained using the fuzzy inference system. The LA technique was deployed for finding the solution for the routing process and the computational time was estimated along with the convergence and cost. The computation of the LA technique was exhibited by distinguishing the results with the GA technique through well-known analyses such as complexity analysis, convergence analysis, and cost analysis. In addition, qualitative and quantitative correlation analyses were conducted. The experimental results demonstrated that the performance time utilized by the LA process shows about 72% reduction over that utilized by the GA technique. Particularly, the LA technique shows 2.2% superiority in the rate of convergence over the GA technique, as well as reduction in the collision, congestion, and QoS costs. The experimental results proved that the LA technique considerably minimizes the computation complexity.
References
[1] BITAM S, MELLOUK A, ZEADALLY S. Bio-inspired routing algorithms survey for vehicular ad hoc networks [J]. IEEE Communication Surveys and Tutorials, 2015, 17(2): 843�C867.
[2] ZEADALLY S, HUNT R, CHEN Y S, IRWIN A, HASSAN A. Vehicular ad hoc networks (VANETs): Status, results, and challenges [J]. Telecommun Syst, 2012, 50(4): 217�C241.
[3] BEYLOT A L, LABIOD H. CONVOY: A new cluster-based routing protocol for vehicular networks, in vehicular networks: Models and algorithms [M]. London, UK: John Wiley & Sons, 2013, 3: 91�C139.
[4] BAI F, KRISHNAN H, SADEKAR V, HOLLAND G, ELBATT T. Towards characterizing and classifying communication-based automotive applications from a wireless networking perspective [M]. San Francisco, CA, USA: Autonet, 2006.
[5] WU C, OHZAHATA S, KATO T. Flexible, portable, and practicable solution for routing in VANETs: A fuzzy constraint q-learning approach [J]. IEEE Transactions on Vehicular Technology, 2013, 62(9): 4251�C4263.
[6] WANG W, XIE F, CHATTERJEE M. Small-scale and large-scale routing in vehicular ad hoc networks [J]. IEEE Trans Veh Technol, 2009, 58(9): 5200�C5213.
[7] WU C, KUMEKAWA K, KATO T. Distributed reinforcement learning approach for vehicular ad hoc networks [J]. IEICE Trans Commun, 2010, E93-B(6): 1431�C1442.
[8] GOONEWARDENE R T, ALI F H, STIPIDIS E. Robust mobility adaptive clustering scheme with support for geographic routing for vehicular ad hoc networks [J]. IET Intell Transp Syst, 2009, 3(2): 148�C158.
[9] ZHANG X M, WANG E B, XIA J J, SUNG D K. An estimated distance-based routing protocol for mobile ad hoc networks [J]. IEEE Trans Veh Technol, 2011, 60(7): 3473�C3484.
[10] RAJAKUMAR B R. Lion algorithm for standard and large scale bilinear system identification: A global optimization based on Lion��s social behavior [C]// 2014 IEEE Congress on Evolutionary Computation (CEC). Beijing: IEEE, 2014: 2116�C2123.
[11] PACKER C, PUSEY A E. Male takeovers and female reproductive parameters: A simulation of oestrous synchrony in lions (Panthera leo) [J]. Animal Behavior, 1983, 31(2): 334�C340.
[12] RAJAKUMAR B R. The Lion��s Algorithm: A new nature-inspired search algorithm [J]. Procedia Technology, 2012, 6: 126�C135. DOI: http://dx.doi.org/10.1016/j.protcy. 2012.10.016.
[13] EIZA M H, OWENS T, NI Q, SHI Q. Situation-aware QoS routing algorithm for vehicular ad hoc networks [J]. IEEE Transactions on Vehicular Technology, 2015, 64(12): 5520�C5535.
[14] ZHOU Y, WANG J. A local search-based multi-objective optimization algorithm for multi-objective vehicle routing problem with time windows [J]. IEEE Journal of Systems, 2015, 9(3): 1100�C1113.
[15] YANG H, YANG S, XU Y, CAO E, LAI M, DONG Z. Electric vehicle route optimization considering time-of-use electricity price by learnable partheno-genetic algorithm [J]. IEEE Transactions on Smart Grid, 2015, 6(2): 657�C666.
[16] AHRENS M, GESTER M, KLEWINGHAUS N, MULLER D, PEYER S, SCHULTE C, TELLEZ G. Detailed routing algorithms for advanced technology nodes [J]. IEEE Transactions on Computer-aided Design of Integrated Circuits and Systems, 2015, 34(4): 563�C576.
[17] EIZA M H, OWENS T, NI Q. Secure and robust multi-constrained QoS aware routing algorithm for VANETs [J]. IEEE Transactions on Dependable and Secure Computing, 2016, 13(1): 32�C45.
[18] BAUER H, IONGH H H, SILVESTRE I. Lion social behaviour in the west and central African savanna belt [J]. Mammalian Biology, 2003, 68(1): 239�C243.
[19] KLIR G J, CLAIR U S, BO Y. Fuzzy set theory: Foundations and applications [M]. Englewood Cliffs, NJ, USA: Prentice-Hall, 1997.
[20] FOGEL L J, OWENS A J, WALSH M J. Artificial intelligence through simulated evolution [M]. New York: Wiley Publishing, 1966.
[21] DOERR B, HAPP E. CHRISTIAN KLEIN: Crossover can provably be useful in evolutionary computation [J]. Theor Comput Sci, 2012, 425: 17�C33.
[22] BACK T, HOFFMEISTER F, SCHWEFEL H P. An overview of evolutionary algorithms for parameter optimization [J]. Journal of Evolutionary Computation, 1993, 1(1): 1�C24.
[23] JONG K A D. An analysis of the behavior of a class of genetic adaptive systems [D]. Computer and Communication Sciences, University of Michigan, Ann Arbor, 1975.
[24] PACKER C, PUSEY A E. Divided we fall: Cooperation among lions [J]. Scientific American, 1997, 276: 52�C59.
[25] PACKER, PUSEY. Cooperation and competition within coalition of male lions: Kin selection or game theory [J]. Macmillan Journals, 1982, 296(5859): 740�C742.
[26] KOHONEN T. Self-organization and associative memory [M]. Berlin, Germany: Springer-Verlag, 1984.
(Edited by HE Yun-bin)
���ĵ���
���� ad-hoc ��������·�ɵĶ����붨������Է���
ժҪ������ ad-hot���磨VANETs�������ܽ�ͨϵͳ����ߵ�·��ȫ��һ����Ҫ������֮�������ö�������VANETs�С����VANET���ܵ���߿�չ����ʵ�顣����������ս�ǻ�ø���������������ָ�ꡣΪ�˽��������⣬���о�ͨ����ע��ײ�����гɱ�����ʶ��ӵ�µȷ�������ָ�����˳���·������ijɱ���ơ������Ŵ��㷨��GA�������㷨���ӣ��Ǹ���ͻ�䣬��������ȫ������������������������⣬���IJ���ʨȺ�㷨��LA�����и��õ���ϡ�ͨ���ɱ��������������������Է������㷨�ļ�����̽��з������ڵõ����ֳɱ�����֮�����ط����Ļ����ϣ��Զ����������ֵ�����������о������������LA����������GA�������˸��ӶȺ�·�ɳɱ���
�ؼ��ʣ����� ad-hoc ���磻ʨȺ�㷨��ģ��������������·��
Received date: 2016-05-05; Accepted date: 2016-12-02
Corresponding author: MUKUND B. Wagh, PhD, Associate Professor; Tel: +910�C08275521723; E-mail: mukund_wagh@yahoo.com
Abstract: Vehicular ad-hoc networks (VANETs) are a significant field in the intelligent transportation system (ITS) for improving road security. The interaction among the vehicles is enclosed under VANETs. Many experiments have been performed in the region of VANET improvement. A familiar challenge that occurs is obtaining various constrained quality of service (QoS) metrics. For resolving this issue, this study obtains a cost design for the vehicle routing issue by focusing on the QoS metrics such as collision, travel cost, awareness, and congestion. The awareness of QoS is fuzzified into a price design that comprises the entire cost of routing. As the genetic algorithm (GA) endures from the most significant challenges such as complexity, unassisted issues in mutation, detecting slow convergence, global maxima, multifaceted features under genetic coding, and better fitting, the currently established lion algorithm (LA) is employed. The computation is analyzed by deploying three well-known studies such as cost analysis, convergence analysis, and complexity investigations. A numerical analysis with quantitative outcome has also been studied based on the obtained correlation analysis among various cost functions. It is found that LA performs better than GA with a reduction in complexity and routing cost.
