
Trans. Nonferrous Met. Soc. China 23(2013) 2483-2490
Anisotropy of localized corrosion in 7050-T7451 Al alloy thick plate
Feng-xuan SONG, Xin-ming ZHANG, Sheng-dan LIU, Nian-mei HAN, Dong-feng LI
School of Materials Science and Engineering, Central South University, Changsha 410083, China
Received 9 August 2012; accepted 19 November 2012
Abstract:
The corrosion anisotropy of 7050-T7451 Al alloy thick plate in NaCl solution was investigated by immersion tests, slow strain rate testing (SSRT) technique, potentiodynamic and anode polarization measurements, optical microscropy (OM) and scanning electron microscopy (SEM) observations. The results show that the thick plate exhibits severe corrosion anisotropy due to the microstructure anisotropy. The observations of immersion surfaces together with the analysis of polarization curves reveal that the differences of the corrosion morphologies on various sections in this material are mainly related to the area fraction of the remnant second phase, and higher area fraction displays worst corrosion resistance. The stress corrosion cracking (SCC) susceptibility of different directions relative to the rolling direction is assessed by SSRT technique, ranked in the order: S direction > L direction >T direction. The result show that the smaller the grain aspect ratio, the better the corrosion resistance to SCC.
Key words:
7050-T7451 Al alloy; thick plate; microstructure; corrosion anisotropy;
1 Introduction
7050-T7451 is an Al-Zn-Mg-Cu-Zr alloy developed to obtain a good combination of high strength, high resistance to SCC and good fracture toughness, particularly in thick sections [1,2]. The 7050-T7451 (formerly T73651) thick plate material is used for selected parts in military fighter aircraft as well as commercial transport aircraft with continuing evaluation as a candidate material for future designs [3]. To eliminate an avoidable margin of safety in flight vehicles design, the 7050-T7451 alloy which is one of highly anisotropic materials must be fully tested for use [4]. Unfortunately, the corrosion behaviors in different orientations relative to the rolling direction have been investigated insufficiently. Most tests are restricted in the rolling plane and/or along the rolling direction [5,6].
Corrosion behavior of the 7000 series Al alloy has been investigated extensively [7-9], and it is well known that the corrosion resistance can be modified by controlling the composition, distribution of a large range of intermetallic (IM) particles, the size and distance of the grain boundary precipitates (GBPs), the width of the precipitate free zone (PFZ), and the alloying elements (mainly Cu) content �C either in precipitates or in matrix. As a result, many good heat treatment processes [10-13] have been produced to improve the corrosion resistance harnessing such prior works. However, relatively little references studied the effect of the grain shape, including grain orientation and grain aspect ratio, on the corrosion behavior. FAN et al [14] reported that different grain structures from the surface to the midsection of the 7150 extrusion led to the difference of corrosion property. They studied the influence of grain size on the corrosion property, but no further research on the grain shape. ROBINSON and JACKSON [15] found that the most advanced corrosion attack, through the plate thickness direction, occurred on the mid-section due to the higher grain aspect ratio. This can explain well why an elongated grain structure is an important prerequisite for exfoliation. However, the effect of the grain aspect ratio on SCC, which is also a most devastating failure form in this plate material and requires an external stress, is unclear.
In this work, the corrosion resistances in three orientations relative to the rolling direction of 7050-T7451 Al alloy thick plate were studied by immersion and SSRT in 3.5% (mass fraction) NaCl solution at 25 ��C. The corroded morphologies and fractured surfaces were investigated by OM and SEM observations. The aim was to study the relationship between the anisotropy of microstructure and corrosion resistance in detail. In addition, the potentiodynamic and anodic polarization measurements of different areas through plate thickness direction were tested to further verify the relationship.
2 Experimental
The material tested was 120 mm thick 7050-T7451 Al alloy plate, whose composition is Zn 6.06%, Mg 2.20%, Cu 2.12%, Zr 0.11%, Fe 0.08%, Si 0.04%, and Al balance. Longitudinal (L), long transverse (T) and short transverse (S) are conventionally utilized to label the various directions along with the microstructure of the plate (see Fig. 1). The L��T, S��L and S��T sections are the rolling plane, parallel to rolling direction and perpendicular to rolling direction, respectively.
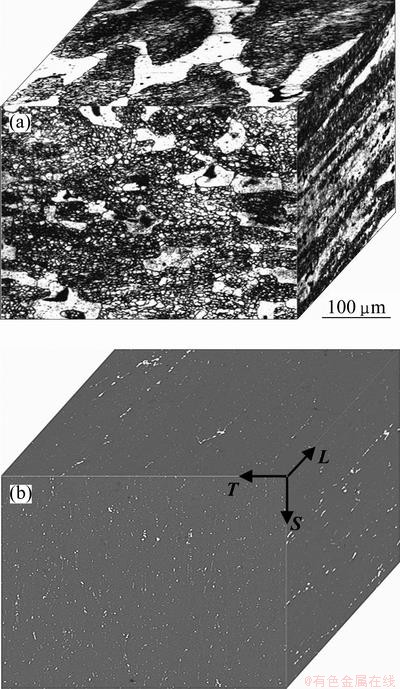
Fig. 1 Grain-microstructure (a) and second phase distribution (b) of various sections in 7050-T7451 Al alloy thick plate
Immersion samples of various sections of 60 mm �� 30 mm �� 2.5 mm were machined from an area near 1/4 in reference to the plate thickness. The surfaces for immersion measurements were successively ground to 1200 grade SiC paper, and those surfaces not exposed to the test solution were coated with rosin and wax. After a certain period of time immersion, the corroded morphologies were investigated and the depths of the corrosion attack were measured by OM (Olympus PMG3).
The SCC tests were assessed by using SSRT, which has the advantage of promoting SCC in systems. The specimens used for SSRT were 4 mm in diameter and 20 mm in gauge length. The SSRT was carried out using a conventional machine (WDM-3) with 30 kN load cell at a strain rate of 1��10-6 s-1 in air and in 3.5% NaCl solution, respectively. The SCC susceptibility was evaluated using an index ISSRT [16], which was calculated according to the following equation:
ISSRT=1-[��fw��(1+��fw)]/[��fA��(1+��fA)] (1)
where ��fw and ��fw are the tensile strength and elongation gained from tests in 3.5% NaCl, respectively; ��fA and ��fA are the tensile strength and elongation gained from tests in air, respectively. The fractured surfaces were characterized by SEM (TECNAI G220).
The potentiodynamic and anodic polarization measurements were tested using a standard three-electrode test system in 3.5% NaCl solution at scan rates of 10 and 0.1 mV/s, respectively. The three- electrode system, consisting of a saturated calomel electrode as reference electrode, a Pt foil as counter electrode, and the alloy being studied as the working electrode, was connected to CHI 660C electrochemical workstation, a product of Shanghai Huachen instruments Ltd (Songhua River Road 251 Magnolia Green Square, China). The samples were progressively ground to 1500 grit in ethanol (C2H5OH) to minimize corrosion during polishing. To ensure the reliability of the measured data, five repeated tests were carried out for each sample. Typical polarization curves were selected according to the distributions of measured values.
3 Results and discussion
3.1 Microstructure
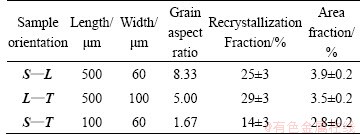
The grain-microstructure and the distribution of remnant second phase particles in 7050-T7451 Al alloy are shown in Fig. 1. The microstructure of this material, whatever the orientation, composed of recrystallized grains (bright zones) as well as an unrecrystallized sub-grain structure (dark zones), as shown in Fig. 1(a). The statistics results of grain aspect ratio (Table 1) show that the grains either on L��T or on S��L section are of flat pancake-shaped grains, elongated in the rolling direction, while the grains on S��T section are more close to round grains, slightly elongated in the T direction. This alloy also contains a lot of remnant second phase particles, such as S(Al2CuMg), Al7Cu2Fe and �� (Mg2Si) constituent particles (Fig. 1(b)). The remnant second phase particles on L��T and on S��L section appear alignment along the rolling direction, and the area fractions are about 3.5% and 3.9%, respectively. Whereas, the second phase on S��T section, whose area fraction is about 2.8%, arranges randomly.
Table 1 Grain shape, mean grain dimensions, recrystallization fraction and area fraction of remnant second phase particles in various sections
3.2 Immersion test
The surface morphologies of 7050-T7451 Al alloy after immersing for 12 h in NaCl solution are shown in Fig. 2. For the S��L section, pitting and long strip of corrosion traces can be seen (Fig. 2(a)). The microstructure consisting of large recrystallized grains and small unrecrystallized sub-grains along the rolling direction become clear from Fig. 2(b). The corrosion morphologies of the L��T section were very similar to the S��L section except that more pitting can be clearly seen on the L��T section (Fig. 2(c)). At a higher magnification, it was evident that a large pitting and severe intergranular corrosion (IGC) attack (Fig. 2(d)). However, the surface of the S��T section was completely different from the S��L section or L��T section after 12 h immersion, on which a large number of black corrosion pits scattered uniformly (Fig. 2(e)). Further observation, namely at a higher magnification, can find that the black pits were actually caused by trenching around grain boundary (Fig. 2(f)), in which manner behaved as isolated IM particles [17]. Moreover, IGC can be found among pits (Fig. 2(f)).

Fig. 2 Corrosion morphologies of 7050-T7451 Al alloy plate after immersing 12 h
It is well known that localized corrosion of Al alloy relates more to the composition and distribution of the second phase particles since the galvanic coupling difference between the second phase and the surrounding matrix. In 7050-T7451 Al alloy plate, electrochemical active �� (MgZn2) phase precipitates at grain boundary, resulting in preferential dissolution of grain boundary in immersing process. On the other hand, the remnant constituent particles in the alloy account for the initiation of pitting. As a result, pitting and IGC can be observed on various sections after 12 h immersion. However, the corrosion attack on S��T section only seemed like pitting due to the small grain aspect ratio and the random distribution of the second phase.
After the immersion time reached 96 h, the difference of surface morphologies in various orientations became small (Fig. 3). Some adjacent pitting spread gradually and combined, and pitting with more complicated shape was formed. In addition, many cracks can be clearly seen on various surfaces. Note that the bottom of pitting was relatively flat, and obvious IGC can be seen (Fig. 3 (c)). The reason may be that the corrosion attack along some sub-grain boundaries resulted in the detachment of sub-grains from the Al matrix in the following process of corrosion product elimination due to weak valence interaction. It seemed like that sub-grain suffers from more serious corrosion attack than recrystallized grain, which was inconsistent with general view that a low-angle grain had a higher corrosion resistance than a high-angle grain. In fact, all grains suffered from corrosion attack at the same time when the surface was immersed into an aggressive solution, and the smaller grains corrode more serious. However, sub-grain was beneficial to inhibit corrosion quick propagation due to the difference of grain boundary angle between different sub-grains. In other words, sub-grain also can suffer from corrosion attack, but can inhibit effectively corrosion expansion to the depth.
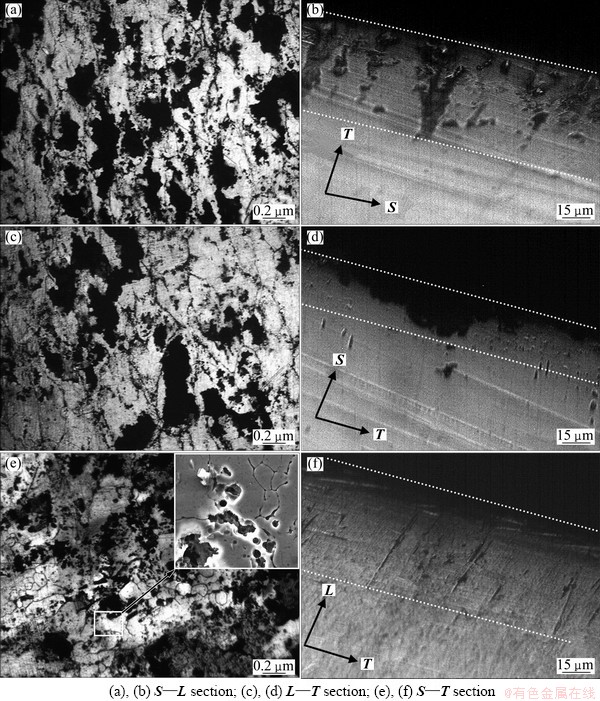
Fig. 3 Corrosion morphologies of various surfaces (a,c,e) and corresponding cross-sections (b,d,f) in 7050-T7451 Al alloy plate after immersing for 96 h
The extent of sub-surface attack was observed by metallographic sectioning, and the data about the depths of the corrosion attack are listed in Table 2. Obviously, corrosion growth on the sub-surface of S��T section was slightly faster than that on the sub-surface of S��L section, and much faster than that on the sub-surface of L��T section. This anisotropic growth behavior near S/4 area in plate thickness direction was the same as that near S/2 area. From Figs. 3 (b) and (f), that the corrosion attack under surfaces of S��L and S��T section grew straightly parallel to the direction of the grains alignment. It was evidence that the path of attack in this material under these conditions was IGC. In contrast, the sub-surface attack on L��T section was slow and rough like a pit (Fig. 3(e)), which was caused by taking the circuitous path because of the small grains aspect ratio and alignment [18]. Consequently, it was proper to assume that the pits initiated on the surface because of the electrochemical active second phase, then transformed into IGC as they grew, which related more to the grain shapes and alignments.
Table 2 Maximum and average depths of cross-section attack for various sections after immersing for 96 h

3.3 Electrochemical measurements
It is well known that the localized corrosion of Al alloy is a kind of electrochemical corrosion in nature. The electrochemical responses of different section samples were measured, and the typical polarization curves are shown in Fig. 4. The corresponding corrosion potential (Ecorr) and corrosion current density (Jcorr) obtained from these curves are plotted in Fig. 5. Immediately, it was evident that the sample for L��T section had the poorest corrosion resistance due to the lowest Ecorr and the highest Jcorr. Additionally, it can be seen that the Ecorr value of S��L section was very close to the value of S��T section, while the Jcorr value of S��L section is higher than that of S��T section. These results demonstrate that the L��T section presented the highest corrosion susceptibility, followed S��L section, finally S��T section. It is noteworthy that the corrosion susceptibility of different section seems to be relevant to the area fraction of the remnant second phase, namely the higher area fraction of remnant second phase exhibits lower corrosion susceptibility (see Table 1).
The polarization curves from different areas through the plate thickness direction were measured to observe the corrosion behaviors on various sections, and the graphs and analytics results are shown in Figs. 4 and 5, respectively. The corrosion resistances on various sections from S/4 area had the same trend as that near S/2 area, but the corrosion property was totally worse in S/2 area than S/4 area. Obviously, the cooling rate in the plate with 120 mm in thickness was different between the center and near the S/4 area. In the center of the plate, �� phase easily precipitated at grain boundary in the process of quenching due to the slow quenching rate, and got coarse in the following aging. As a result, the galvanic couple difference between �� phase and the matrix increased, and the corrosion resistance descended.
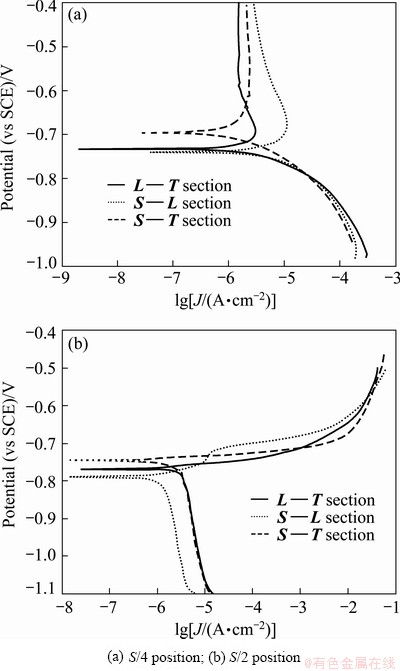
Fig. 4 Polarization curves of different section of 7050-T7451 Al alloy plate in 3.5% NaCl solution at scan rate of 10 mV/s
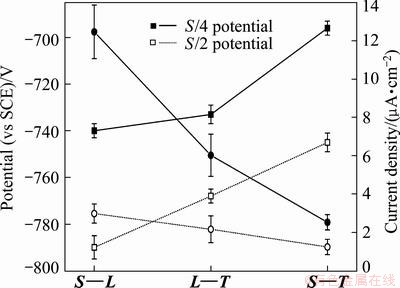
Fig. 5 Plots of potential and current density for different sections of 7050 Al alloy plate in 3.5% NaCl solution at a scan rate of 10 mV/s
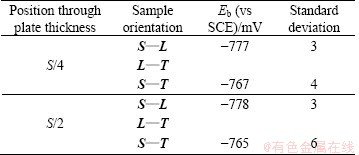
Figure 6 shows the typical anode polarization curves on various sections of 7050 Al alloy plate in 3.5% NaCl solution at a scan rate of 0.1 mV/s. The behavior of 7050 Al alloy was different for various sections samples. The sample on L��T section exhibited no distinct breakdown potential (Eb), whereas the samples on S��T and L��S sections appeared to be one distinct breakdown potential. From Table 3, the breakdown potential was almost independent of the sample orientation, and the difference between samples in different areas relative to the plate thickness was within 10 mV. The breakdown potential was associated with pitting in the matrix [19,20]. For the L��S section sample, the area fraction and size of the remnant second phase were slightly higher than those for S��T section sample resulting in slightly slower corrosion resistance and breakdown potential. For the L��T section sample, the current density quickly increased with the potential increasing firstly, and kept stable at about -750 mV at last, which was almost same for various section samples. In addition, severe pitting can be observed on the surface of L��T section sample after anode polarization tests. Based on the observations of corrosion surface and electro- chemical tests, the breakdown potential for L��T section sample should be much more negative than that for S��T section sample due to higher area fraction of the second phase, which needs to be further verified.
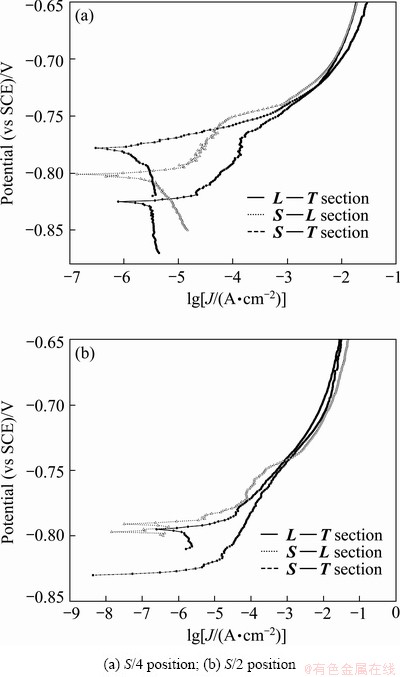
Fig. 6 Anode polarization curves of various sections of 7050 Al alloy plate in 3.5% NaCl solution at scan rate of 0.1 mV/s
Table 3 Values of breakdown potentials for 7050Al alloy tested in 3.5% NaCl solution at scan rate of 0.1 mV/s
3.4 Evaluation of SCC susceptibility
In order to investigate the effect of the microstructure anisotropy on the cracks propagation in various sections, SSRT measurements of different section samples were carried out in air and in 3.5% NaCl solution, respectively, at ambient temperature, and the typical tensile curves are shown in Fig. 7. The results of SSRT corresponding to each orientation are illustrated in Table 4. Immediately, it was evident that ISSRT descends in the order: S direction >L direction > T direction. In general, the smaller the ISSRT value in the SSRT, indicating that the SCC resistance of the alloy is better. Therefore, the SSC susceptibility of the alloy was in the following sequence, S direction > L direction > T direction.
When loaded in the L direction, corrosion cracks propagated along S or T direction on the S��T section, which had the smallest grain aspect ratio (see Table 1). Similarly, if the tensile axis paralleled to the S and T direction, the fracture planes are L��T or S��L section. As expected, the smaller grain aspect ratio corresponded well to the higher SSC resistance. The reason was that the more elongated grains mean the longer path of IGC and bigger internal stress produced by corrosion product, resulting in high SSC susceptibility. This inference was consistent with the conclusion drawn by ROBINSON and JACKSON [15] in exfoliation corrosion of Al alloy. These observations provided further evidence for a common mechanism between SSC and exfoliation corrosion.
Figure 8 represents the typical fractographs of the SSRT specimens for the 7050-T7451 Al alloy. The fractured surfaces of the S direction samples exhibit mostly intergranular failure, which was typical brittle fracture, as shown in Fig. 8(a). In contrast, the fractured surfaces of the L direction samples were dominated by a large number of dimples and only a few indefinite intergranular regions (Fig. 8(c)). Furthermore, some large dimples and cleavage facets were also observed on the fractured surface of this sample. The T direction samples displayed a semi-intergranular failure mode with cleavage-like features, as shown in Fig. 8(b). According to the SSRT results and fractograph observations, it can be concluded that recrystallizaion grain boundary is always beneficial for cracks propagating rapidly.
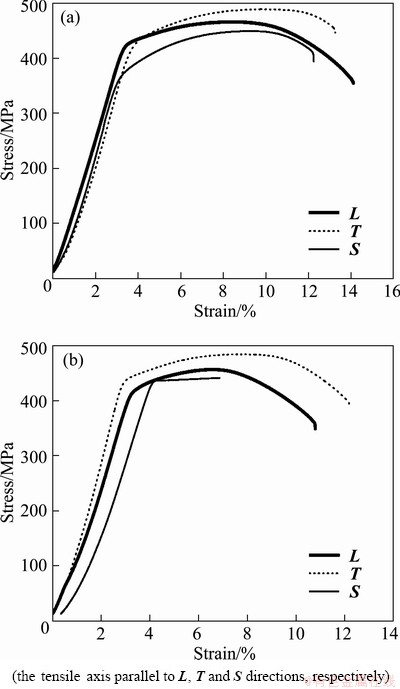
Fig. 7 Stress��strain curves of alloy plate tested in air (a) and in 3.5%NaCl solution (b) at strain rate of 10-6 s-1
Table 4 SSRT results in terms of stress��strain curves
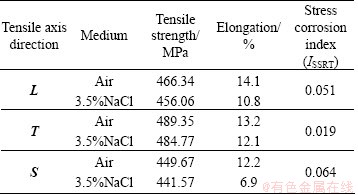

Fig. 8 Fractured surfaces of SSRT specimens with tensile axis parallel to S (a), T (b), and L directions (c)
4 Conclusions
1) The 7050 Al alloy thick plate exhibited different grain structures in three different directions resulting in the evident corrosion anisotropy.
2) Immersion and polarization tests indicated that L��T section had the highest corrosion susceptibility, followed the S��L section and the S��T section was the lowest due to the different area fraction of the remnant second phase particles.
3) The depths of sub-surfaces corrosion attack together with the severity of SSC revealed that the corrosion growth was mainly influenced by the grains aspect ratio and distribution regardless of the surface corrosion morphologies. The smaller grain aspect ration exhibited the higher SSC resistance. The corrosion susceptibility ranked in the order, S direction > T direction > L direction.
References
[1] CIOMPI E, LANCIOTTI A. Susceptibility of 7050-T7451 electron beam welded specimens to stress corrosion [J]. Engineering Fracture Mechanics, 1999, 62(4-5): 463-476.
[2] ZHANG Yu-hua, YANG Shu-cai, JI Hong-zhi. Microstructure evolution in cooling process of Al-Zn-Mg-Cu alloy and kinetics description [J]. Transactions of Nonferrous Metals Society of China, 2012, 22(9): 2087-2091.
[3] SCHUBBE J J. Evaluation of fatigue life and crack growth rates in 7050-T7451 aluminum plate for T-L and L-S oriented failure under truncated spectra loading [J]. Engineering Failure Analysis, 2009, 16(1): 340-349.
[4] SCHUBBE J J. Fatigue crack propagation in 7050-T7451 plate alloy [J]. Engineering Fracture Mechanics, 2009, 76(8): 1037-1048.
[5] NAJJAR D, MAGNIN T, WARNER T J. Influence of critical surface defects and localized competition between anodic dissolution and hydrogen effects during stress corrosion cracking of a 7050 aluminium alloy [J]. Materials Science and Engineering A, 1997, 238(2): 293-302.
[6] SONG R G, DIETZEL W, ZHANG B J, LIU W J, TSENG M K, ATRENS A. Stress corrosion cracking and hydrogen embrittlement of an Al-Zn-Mg-Cu alloy [J]. Acta Materialia, 2004, 52(16): 4727-4743.
[7] WLOKA J,  G, VIRTANEN S. Influence of second phase particles on initial electrochemical properties of AA7010-T76 [J]. Electrochimica Acta, 2007, 53(4): 2055-2059.
[8] KIM S H, ERB U, AUST K T, PALUMBO G. Grain boundary character distribution and intergranular corrosion behavior in high purity aluminum [J]. Scripta Materialia, 2001, 44(5): 835-839.
[9] PENG Guo-sheng, CHEN Kang-hua, CHEN Song-yi, FANG Hua-chan. Influence of dual retrogression and re-aging temper on microstructure, strength and exfoliation corrosion behavior of Al-Zn-Mg-Cu alloy [J]. Transactions of Nonferrous Metals Society of China, 2012, 22(4): 803-809.
[10] XU D K, BIRBILIS N, LASHANSKY D, ROMETSCH P A, MUDDLE B C. Effect of solution treatment on the corrosion behaviour of aluminium alloy AA7150: Optimisation for corrosion resistance [J]. Corrosion Science, 2011, 53(1): 217-225.
[11] OU B L, YANG J G, WEI M Y. Effect of homogenization and aging treatment on mechanical properties and stress-corrosion cracking of 7050 alloys [J]. Metallurgical and Materials Transactions A, 2007, 38(8): 1760-1773.
[12] HUANG L P, CHEN K H, LI S, SONG M. Influence of high-temperature pre-precipitation on local corrosion behaviours of Al-Zn-Mg alloy [J]. Scripta Materialia, 2007, 56(4): 305-308.
[13] CINA B. Reducing the susceptibility of alloys, particularly aluminium alloys, to stress corrosion cracking: America, 3856584 [P]. 1974.
[14] FAN X G, JIANG D M, ZHONG L, WANG T, REN S Y. Influence of microstructure on the crack propagation and corrosion resistance of Al-Zn-Mg-Cu alloy 7150 [J]. Materials Characterization, 2007, 58(1): 24-28.
[15] ROBINSON M J, JACKSON N C. The influence of grain structure and intergranular corrosion rate on exfoliation and stress corrosion cracking of high strength Al-Cu-Mg alloys [J]. Corrosion Science, 1999, 41(5): 1013-1028.
[16] HU J, XU L X, YAO C K. Location corrosion of alumina borate whisker reinforced AA2024 T6 composite in aqueous 3.5% NaCl solution [J]. Materials Chemistry and Physicals, 2002, 76(3): 290-294.
[17] BOAG A, HUGHES A E, GLENN A M, MUSTER T H, MCCULLOCH D. Corrosion of AA2024-T3 Part I: Localised corrosion of isolated IM particles [J]. Corrosion Science, 2011, 53(1): 17-26.
[18] ZHANG W L, FRANKEL G S. Anisotropy of localized corrosion in AA2024-T3 [J]. Electrochemical and Solid-State Letters, 2000, 3(6): 268-270.
[19] RAMGOPAL T, GOUMA P I, FRANKEL G S. Role of grain-boundary precipitates and solute-depleted zone on the intergranular corrosion of aluminum alloy 7150 [J]. Corrosion, 2002, 58(8): 687-697.
[20] MAITRA S, ENGLISH G C. Mechanism of localized corrosion of 7075 alloy plate [J]. Metallurgical and Materials Transactions A, 1981, 12(3): 535-541.
7050-T7451���Ͻ������ʴ�ĸ�������
�η���������������ʤ��������÷�����
���ϴ�ѧ ���Ͽ�ѧ�빤��ѧԺ����ɳ 410083
ժ Ҫ�����ó�����ʴ����Ӧ���������졢��̬�������������Լ���ѧ��ɨ��羵�۲�ȶ�7050-T7451���Ͻ������ʴ���ܵĸ������Խ����о������������7050-T7451���Ͻ������ڴ������Ե�����֯�������Զ����¸�ʴ���ܵĸ������ԣ��Ͻ�ͬ���港ʴ���ܵIJ������ɻ����ڲ���ڶ�������IJ�ͬ������ģ�����ڶ������Խ����港ʴԽ���أ���ͬ������Ʒ��Ӧ����ʴ������˳������ΪS > L > T����(��Ӧ������������Խ��)������������ԽС��Ӧ����ʴ����Խ�á�
�ؼ��ʣ�7050-T7451���Ͻ𣻺�壻����֯����ʴ��������
(Edited by Chao WANG)
Foundation item: Project (2012CB619502) supported by the National Basic Research Program of China
Corresponding author: Xin-ming ZHANG; Tel: +86-731-88830265; E-mail: xmzhang_cn@yahoo.cn
DOI: 10.1016/S1003-6326(13)62758-2
Abstract: The corrosion anisotropy of 7050-T7451 Al alloy thick plate in NaCl solution was investigated by immersion tests, slow strain rate testing (SSRT) technique, potentiodynamic and anode polarization measurements, optical microscropy (OM) and scanning electron microscopy (SEM) observations. The results show that the thick plate exhibits severe corrosion anisotropy due to the microstructure anisotropy. The observations of immersion surfaces together with the analysis of polarization curves reveal that the differences of the corrosion morphologies on various sections in this material are mainly related to the area fraction of the remnant second phase, and higher area fraction displays worst corrosion resistance. The stress corrosion cracking (SCC) susceptibility of different directions relative to the rolling direction is assessed by SSRT technique, ranked in the order: S direction > L direction >T direction. The result show that the smaller the grain aspect ratio, the better the corrosion resistance to SCC.
