
J. Cent. South Univ. Technol. (2011) 18: 767-772
DOI: 10.1007/s11771-011-0761-z![]()
Quality prediction and control of tube hollow
XIAO Dong(Ф��)1, WANG Ji-chun(���̴�)1, 2, PAN Xiao-li(��Т��)1, 3, MAO Zhi-zhong(ë־��)1
1. School of Information Science and Engineering, Northeast University, Shenyang 110004, China;
2. College of Science, Liaoning University of Technology, Jinzhou 121000, China;
3. Baosteel Corporation, Shanghai 201900, China
? Central South University Press and Springer-Verlag Berlin Heidelberg 2011
Abstract:
The quality prediction of tube hollow model based on the variance staged multiway partial least square (MPLS) method was proposed. The key aspects of staged decomposition of the productive data, calculation of the variance value, modeling, and on-lined prediction in the variance-staged MPLS method were introduced. Based on the model, iterative optimal control method was used for quality control of tube hollow. The experimental results show that the obvious benefits of this method are low maintenance cost, good real time function, high reliability precision, and practical application to on-line prediction and optimization on the quality of tube hollow.
Key words:
1 Introduction
Since seamless tubes are mainly used in the industries of petroleum, aviation, cars, national defense, and city public facilities, their quality is of great importance. The production of seamless tubes is strictly supervised at each stage, because waste products or substandard products may be produced at any stage and once such deficiencies are not detected in time, the utilizing efficiency of equipments will be affected and waste of energy will be caused in the later producing procedures [1-3].
The billet piercing process is the first procedure of the figuration of seamless tubes, and the quality of tube hollow after piercing will greatly affect the quality of the final products. This process is a multi-stage, complex, non-linear and dynamic multi- variable batch process, which makes the quality of tube hollow and the process variables more complicatedly related. The quality of tube hollow can hardly be timely measured in practice because of the continuity of the producing process and the limitations on monitoring instruments. The quality control is achieved by the staged random sampling through the workers�� regulation on processing parameter according to their experience. Certain relations were built between the processing parameters and the quality information like tube hollow deformation, twist, inner and outer cracks and surplus strain based on the element method [4-6]. But it was hard to build the corresponding projective relationship between the processing parameters and the quality parameters one by one. Based on the BP neural net method, the relation model was built between the tube hollow qualities and the processing parameters like roller shape, feed angle and plug advance; however, the accuracy of the quality model was relatively low because of the limitations on modeling method and processing parameters.
In the quality prediction of batch process, the multiway principal component analysis (MPCA) method, the MPLS method and its improved method were usually adopted [8-12]. The traditional application of MPCA method and MPLS method to on-line supervision depended on the prediction on the future data point of the process-surveying variable. LU et al [8] proposed three prediction methods on the data left after reactions, but all of them did not take account of the dynamic relation between the sampling data, and the prediction error was rather obvious. The proposition of building multi-MPCA model [9-10] solved the problem of predicting the future data point, but it was more adaptable in application to fault diagnosis, since the formation of tube hollow was a continuous process and it was hard to be expressed by any sub-stage prediction model.
Tube piercing can be divided into three sub-stages: the first unsteady piercing stage, the steady piercing stage and the second unsteady piercing stage. The quality prediction model for the tube hollow based on the variance staged MPLS was proposed. In this method, the process variables were classified by piercing stages and the variance value of the relative variables at each stage was taken as input variable. This method can overcome the defects of complex structure and extensive calculation of the traditional MPLS model, solve the problem of the insensitivity of the prediction model to the minor fluctuation of the variables in the batch process, avoid the disadvantage of data unevenness in the modeling and predicting process, and make the tube quality on-line modeling and predicting applicable.
2 Factors affecting tube hollow quality
The factors that affect the tube hollow quality should be firstly analyzed to avoid information deficiency or redundancy in modeling and therefore to insure the accuracy of the prediction model. Through the technical feature analysis, it is known that the variables at different stages will exert different influences on the tube hollow quality. Some variables only exist and work in a certain stage, while others exist throughout the whole producing process and greatly affect the tube hollow quality. In the practical producing process, the billet piercing process can be mainly divided into three stages: the first unsteady piercing stage, the steady piercing stage and the second unsteady piercing stage.
The first unsteady piercing stage begins with the touch between the rolled piece and the rolls, and ends when the metal fully fills the deformation zone. The variables that affect the tube hollow quality at this stage include: the entry temperatures of the upper roll and the lower roll, the reductions of the upper roll and the lower roll, the inclinations of the upper roll and the lower roll, the rotation speeds of the upper roll and the lower roll, the billet pusher position, the practical thrust dolly position and the mandrill position.
The steady piercing stage begins when the metal fully fills the deformation zone and ends when the billet end meets the plug. In comparison with the first unsteady piercing process, the variables in relation with the tube hollow quality include the outlet temperatures of the upper roll and the lower roll, and the rotation speeds of the left guide disc and the right guide disc; and exclude the billet pusher position, the practical thrust dolly position and the mandrill position.
The second unsteady piercing stage begins with the touch between the billet end and the plug, and ends when the billet leaves the roll. In comparison with the steady piercing process, the variables in relation with the tube hollow quality exclude the entry temperatures of the upper roll and the lower roll.
Quantitative index of the tube hollow quality is needed in quality evaluation. As its quality is mainly reflected by the tube shape and the inner structure, and the latter one can only be measured through the stock jamming and hydraulic testers to the pipes, the tube shape is only chosen to carry the quality analysis. The wall thickness accuracy of hot-rolling seamless tubes, especially the transversal thickness unevenness, is a very important tube hollow quality index [13]. The transversal thickness unevenness is defined as the ratio of the maximum thickness deviation to the nominal thickness:
![]() (1)
(1)
where ��S is the relative transversal thickness unevenness; ��max is the maximum tube wall thickness; ��min is the minimum tube wall thickness; ��HOM is the nominal tube wall thickness.
The longitudinal thickness unevenness is the differential value between the mean value of the front-end tube wall thickness and that of the back-end tube wall thickness:
 (2)
(2)
where ![]() and
and ![]() stand for the measured sum
stand for the measured sum
of the front-end and the back-end tube wall thickness, respectively, and n is the sum of points measured at each end [14].
3 Predication modeling method for tube hollow quality
3.1 Modeling method
As analyzed above, tube hollow quality is affected by many factors. It might be predicted online and therefore controlled timely through building the relation model of the tube hollow quality and the related factors. Since there are adequate process data and easy, accurate testing method on spot, statistics method is adaptable for modeling. The Multiway PLS (MPLS) model proposed by NOMIKOS and MACGREGOR is a well-known, effective tool of batch process statistics analysis, modeling and quality prediction [15-16]. But like the process supervision based on the MPCA model, the quality analysis and on-line prediction based on the MPLS model are not adaptable to the multi-procedure or multi-stage batch process, because the change of process behavior in the batch operating period can hardly be revealed [11]. In addition, in the present quality analysis and online prediction algorithm based on the MPLS mainly, all the process data in the batch process period are taken as predicted variables, which are used in regression modeling together with the final product quality variables. Such models have the disadvantages of complex model structure, extensive calculations and inaccurate quality prediction. To overcome the shortcomings of the traditional modeling method, the variance staged MPLS is chosen to build the prediction model for the tube hollow quality based on the stage analysis of the piercing process.
3.2 Prediction model
Based on the stage analysis of the piercing process, the process variables of each stage are determined in the modeling, and the batch process data of each stage are spread into two-dimensional matrix. Dealt with the spread data according to each stage, the variances of process variables at each stage are obtained. The matrix of the data after treatment is shown as Fig.1.
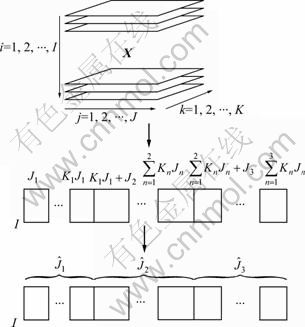
Fig.1 Data spreading and treatment of billet piercing process
After the treatment of the process variables, the MPLS method is applied to build the quality prediction model. By the MPLS algorithm, the regressive relations between X(I��KJ) and the quality matrix Y(I��M) are got.
The exterior relations:
![]() (3)
(3)
![]() (4)
(4)
where A stands for the sum of the retained main compositions; ta(I��1) and ua(I��1) are the score vectors; pa(JK��1) and qa(M��1) are the load vectors; T(I��A) and U(I��A) are the score matrixes; P(JK��A) and Q(M��A) are load matrixes; E is the residual of matrix X; F is the residual of matrix Y; M is the number of quality variables.
The interior relation:
![]() (5)
(5)
where ![]() is the interior regressive coefficient of the latent variable t in the X-dimension and the potential variable u in the Y-dimension.
is the interior regressive coefficient of the latent variable t in the X-dimension and the potential variable u in the Y-dimension.
Since b is the diagonal matrix, and T=XP, Y can be expressed as
![]() (6)
(6)
And the prediction model wanted, ��, can be expressed as
![]() (7)
(7)
4 Iterative optimal control based variance- staged MPLS quality model
Because of the existence of model error and the impact of some unknown disturbance, when the control variable from off-line optimization is used in the practical application, the ideal quality index cannot be got. So, the iterative optimal control method is considered to keep amending the track of the control variable in order to keep the quality index near the ideal index.
According to Eq.(7), the final quality index of the k-th batch, ![]() is
is
![]() (8)
(8)
where superscript �� indicates the row of the vector; ![]() is the unfolded value of the k-th batch;
is the unfolded value of the k-th batch; ![]() is the model prediction of the final quality index; fk is the model predictive error.
is the model prediction of the final quality index; fk is the model predictive error.
Assuming an ideal final quality index ![]() then the predictive deviation of the final quality index of the k-th batch is
then the predictive deviation of the final quality index of the k-th batch is
![]() (9)
(9)
The actual deviation of the final quality index can be
![]() (10)
(10)
Similarly, the predictive deviation and actual deviation of the (k+1)-th batch are expressed as
![]() (11)
(11)
![]() (12)
(12)
Form Eqs.(9) and (11), we can get:
![]() (13)
(13)
In order to make the quality index of the (k+1)-th batch closer to the ideal index, with Eq.(13), the optimized control variable increment ![]() from quadratic target function can be got:
from quadratic target function can be got:
![]() (14)
(14)
where Qe and Qx are the positive definite diagonal matrixes.
When the weight of Qx is larger, the changing of ![]() will be slower, so the convergence speed would be slower too. From Eq.(14), we can obtain
will be slower, so the convergence speed would be slower too. From Eq.(14), we can obtain
![]() (15)
(15)
where ![]()
From Eq.(15), it can be concluded that the increment ![]() is given from calculating the information of the k-th batch predictive error
is given from calculating the information of the k-th batch predictive error ![]() The error information
The error information ![]() of the actual quality index should be modified, because of the deviation between the predictive model and the actual model and the impact of some unknown disturbance. So, the (k+1)-th batch instrumental variable track can be modified as
of the actual quality index should be modified, because of the deviation between the predictive model and the actual model and the impact of some unknown disturbance. So, the (k+1)-th batch instrumental variable track can be modified as
![]() (16)
(16)
where ��k is the weight factor, and the convergence speed can be adjusted from changing the value of ��k.
According to the calculating method of the increment ![]() from Eq.(15), the error of the final quality index could be calculated in convergent gradually. From Eqs.(9)-(13), the increment of the actual final quality index of the (k+1)-th batch is given as
from Eq.(15), the error of the final quality index could be calculated in convergent gradually. From Eqs.(9)-(13), the increment of the actual final quality index of the (k+1)-th batch is given as
![]()
![]() (17)
(17)
So, if ![]() Eq.(17) is convergent, and the quality index error is decreased. In the course of implementing the algorithm, it is assumed that the initial batch date is
Eq.(17) is convergent, and the quality index error is decreased. In the course of implementing the algorithm, it is assumed that the initial batch date is ![]() so
so ![]()
5 Experiment
The producing data came from the piercing production of 100 pieces of 20# steel billets by the Baosteel SWW cross piercer in January, 2009. Among them, 65 pieces of the billets were used to build the quality prediction model and the other 35 pieces were used to test the model about its predicting accuracy on tube hollow quality. The process conditions of experiment are roll diameter Dg=1 000 mm, cone angle of inlet ��=2.75��, guide disk diameter Dp=1 800 mm, rolling angle f=0��, guide disk distance Lp=173 mm, tube diameter Dgp=178 mm, roller initial temperature of 150 ��C, initial temperature of guide disk of 100 ��C, and initial temperature of plug of 100 ��C.
From the producing data about the first 65 pieces of billets, the two-dimensional matrix was got. In the procedure, the data collecting period was 100 ms. Eleven process variables were identified at the first unsteady piercing stage, and the collecting time was 1 s. Twelve process variables were identified at the steady piercing stage, and the collecting time was 8 s. Ten process variables were identified at the second unsteady piercing stage, and the collecting time was 1 s. The data were treated, and the data matrix was obtained. Then, with Eqs.(3)-(7), the quality prediction model was built according to variance staged MPLS. The producing data of the other 35 pieces of tube hollow were collected with the same method for model test. The test data matrix was applied to Eq.(6) to conduct the quality prediction test.
In comparison with the quality prediction model of the traditional batch production, fifteen process variables were chosen from the modeled producing data of the 65 pieces of tube hollow. The data collecting period was 100 ms and the collecting time was 10 s. In the simulation modeling, the traditional MPLS method was applied to the data matrix to build the quality prediction model. With the same method, the producing data of the other 35 pieces of tube hollow were treated, forming the test matrix to carry the quality prediction test. Figures 2 and 3 show the prediction results of the test data of the two models.
It could be known from Fig.2 and Fig.3 that the error of quality prediction model based on the variance staged MPLS method was obviously less than that of the model based on the traditional MPLS method in the prediction of the transversal and longitudinal wall thickness error at all stages. The prediction accuracies on the transversal and longitudinal wall thickness error of the model based on the variance staged MPLS was 91.2% and 90.5%, respectively; while the prediction accuracy of the model based on the traditional MPLS method was 82.1% and 80.5%, respectively. So, it is obvious that the model based on the variance staged MPLS method maintains better prediction accuracy than the model based on the traditional MPLS method.
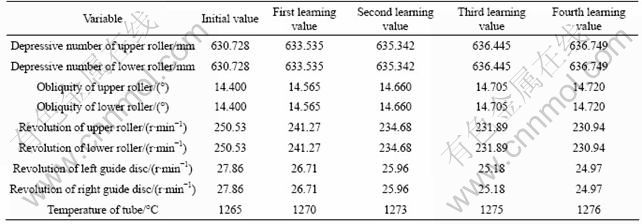
With the iterative optimal control process, the final quality index was gradually convergent. Form Fig.4 and Fig.5, when the 5th batch was completed, the quality error accorded with the operative request very well. Table 1 shows the parameters of optimal control, including the depressive number of upper roller, depressive number of lower roller, obliquity of upper roller, obliquity of lower roller, revolution of upper roller, revolution of lower roller, revolution of left guide disc, revolution of right guide disc and temperature of tube.
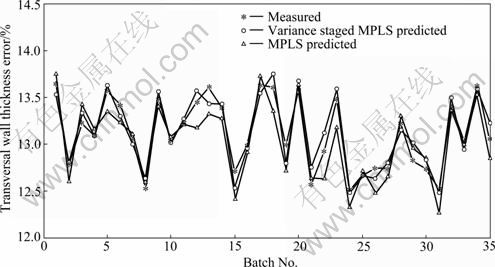
Fig.2 Prediction results of transversal wall thickness error of test data
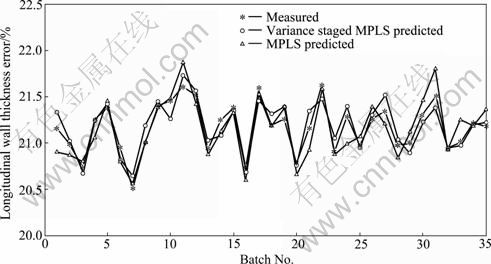
Fig.3 Prediction results of longitudinal wall thickness error of test data
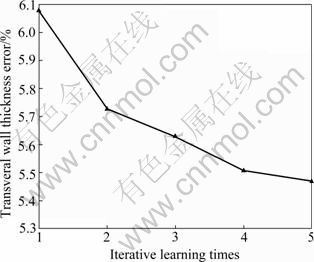
Fig.4 Iterative learning control effect of transverse wall thickness
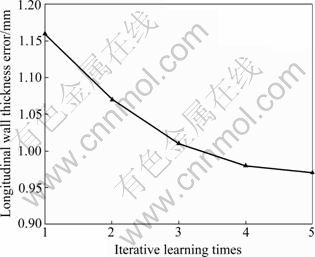
Fig.5 Iterative learning control effect of longitudinal wall thickness
Table 1 Iterative learning calculating results of wall thickness of tube hollow
6 Conclusions
1) The rotary piercing process is divided into three stages with different affecting variables, and two- dimensional MPLS model is built with different variables at each stage. The accuracy of model is increased by 12%.
2) The new model overcomes the shortcomings of complex structure and extensive calculation in the traditional batch process quality prediction models, avoids the problem of data unevenness in the modeling and predicting process, and makes the online modeling and prediction of tube hollow quality more easily applied.
3) With the iterative optimal control method, the transverse wall thickness error is reduced from 6.08% to 5.48%, and the longitudinal wall thickness error is reduced from 1.16 mm to 0.97 mm.
4) The simulation and experiment results prove the feasibility and validity of the modeling and control method based on the variance staged MPLS and iterative learning control, which can also be spread to the application to the quality and predication of other multi-stage batch process.
References
[1] LI Lian-shi. Plastic deformation theory of steel tubes [M]. Beijing: Metallurgical Industry Press, 1985: 82-84. (in Chinese)
[2] ABEDRABBO N, MAYER R, THOMPSON A. Crash response of advanced high-strength steel tubes: Experiment and model [J]. International Journal of Impact Engineering, 2009, 36(8): 1044-1057.
[3] SHUANG Yuan-hua, LI Guo-zhen. Cross process theory and numerical simulation of production process for steel tubes [M]. Beijing: Metallurgical Industry Press, 2001: 188-208. (in Chinese)
[4] NAOI H, KITAKAMI N, MIZUMURA M, KURIYAMA Y. Study of intrusion bending for steel tubes with thin wall thickness [C]// AIST Steel Properties and Applications Conference Proceedings 2007. Detroit: Association for Iron and Steel Technology Press, 2007: 253-264.
[5] URBANSKI S, KAZANECKI J. Assessment of the strain distribution in the rotary piercing process by the finite element method [J]. Journal of Mater Process Technol, 1994, 45(2): 335-340.
[6] GUGLIELMOTTI A, QUADRINI F, SQUEO E, TAGLIAFERRI V. Diode laser bending of tongues from slotted steel tubes [J]. International Journal of Material Forming, 2009, 2(2): 107-111.
[7] ZEINODDINI M, PARKE G, HARDING J. Interface forces in laterally impacted steel tubes [J]. Experimental Mechanics, 2008, 48(3): 265-280.
[8] LU C J, WU C M, KENG C J, CHIU C C. Integrated application of SPC/EPC/ICA and neural networks [J]. International Journal of Production Research, 2008, 46(4): 873-893.
[9] WANG You-qing, ZHOU Dong-hua, GAO Fu-rong. Iterative learning reliable control of batch processes with sensor faults [J]. Chemical Engineering Science, 2008, 63(4): 1039-1051.
[10] CHIANG L H, LEARDI R, PELL R J. Industrial experiences with multivariate statistical analysis of batch process data [J]. Chemometrics and Intelligent Laboratory Systems, 2006, 81: 109-119.
[11] ZHANG Ya-le, DUDZIC M. Industrial application of multivariate SPC to continuous caster start-up operations for breakout prevention [J]. Control Engineering Practice, 2006, 14: 1357-1375.
[12] LEE D S, PARK J M. Adaptive multiscale principal component analysis for on-line monitoring of a sequencing batch reactor [J]. Journal of Biotechnology, 2005, 116: 195-210.
[13] SONG Jian-ping, ZHOU Zhi-yang, WU Yu-quan. Tube transverse wall thickness of multimandrel mill [J]. Baosteel Technology, 1997(6): 39-41. (in Chinese)
[14] WANG Bei-ming. Hot rolled steel tubes quality [M]. Beijing: Metallurgical Industry Press, 1987: 112-114. (in Chinese)
[15] CHEN Jung-hui, CHEN Hsin-Hung. On-line batch process monitoring using MHMT-based MPCA [J]. Chemical Engineering Science, 2006, 61(4): 3223-3239.
[16] CHEN Jung-hui, HSIEH Kai-Ting, CHAN Lester. PLS data-driven based approach to design of a simulated moving bed process [J]. Separation and Purification Technology, 2009, 65(2): 173-183.
(Edited by YANG Bing)
Foundation item: Project(60674063) supported by the National Natural Science Foundation of China
Received date: 2010-01-07; Accepted date: 2010-08-18
Corresponding author: XIAO Dong, PhD; Tel: +86-13840280858; E-mail: xiaodong@ise.neu.edu.cn
