
Trans. Nonferrous Met. Soc. China 23(2013) 2465-2474
Evaluation and simulation analysis of China��s copper security evolution trajectory
Chang WANG, L��-shui ZUO, Ping-jie HU, Hai-lin YAO, Hao ZHU
Institute of Metal Resource Strategy, Central South University, Changsha 410083, China
Received 10 May 2013; accepted 10 August 2013
Abstract:
Copper metal is one important raw material of national economy, and its security is tightly linked with industrialization process. A comprehensive security evaluation index system, including three first class indicators, nine second class indicators and fourteen third class indicators, was constructed based on the pressure-state-response (PSR) model. And efficacy coefficient method was adopted in dimensionless treatment and entropy method was used to obtain the weight. Then, the data of China��s copper from 1992 to 2011 were studied and collected. By processing these data, a comprehensive safety index of China��s copper was got. The results showed that the comprehensive safety index of China��s copper rose from its low point. The safety pressure state of China��s copper was improved. The safety state of China��s copper continued to be tight. The response state continued to rise. The overall situation of China��s copper safety was improving, but still not optimistic.
Key words:
PSR model; copper resource; safety evaluation; evolution trajectory; industrialization process;
1 Introduction
Copper is one important raw material of national economy, with many sorts applied in different fields and industries that are highly connected, and plays a vital role in social economy development and national defense technology. According to the rules of mineral resources consumption, in the mid of industrialization, copper and other commonly used metal with their products may take the place of big iron and bloom steel as the major consumed objects [1,2]. With the acceleration of industrialization and urbanization, China��s need for copper will greatly increase. Statistics indicates that the production of refined copper was 4.58 million tons and apparent consumption was 7.53 million tons in 2010, and the annual growth rate reached 12% and 15% from 2006 to 2010. It was estimated that by the end of 2015, the apparent consumption of the refined copper consumption will reach 9.7 million tons with 5.2% annual growth rate [3]. The safety situation of China��s copper will be more serious.
Some research on resource safety has been made by scholars both domestic and abroad, yet lagging behind in general. 1) Objects of study majored in the security of plowland, food, oil, and water resources [4-7], while attention to the security of copper is fairly low. 2) The research perspective focused on some fixed time in a static way, lacking a long-term dynamic perspective to study the evolution trajectory and its inner logic relations of the security posture. 3) Evaluation index systems relied on such single index as a metal��s overseas dependency, reserve, and static warranty years to make analysis, lacking systematic and quantification models to make judgment of its internal mechanism. 4) Research methods commonly used were subjective weighting method which was limited by the evaluators�� experience and the objectivity of a comprehensive assessment was in question.
Based on the above-mentioned reasons, this work introduces ��Present-State-Response�� (hereinafter referred to as ��PSR��) model to establish a comprehensive evaluation index system of copper safety in accordance with ��Cause-Effect-Response�� causal relationship, utilizing entropy evaluation method, making objective weight based on the index data to improve the evaluation��s objectivity and authenticity, and by which set up PSR comprehensive assessment index system and entropy evaluation model of the copper security. The system and model may help to make scientific assessment of copper security posture, analyze its evolution trajectory, provide evidence for China to complete safe-guard mechanism and policies, and promote sustainable development of resources, environment and social economy.
2 Method
2.1 Model constructing
2.1.1 Basic principle
The research core of copper security assessment is to screen the factors that affect the safety of copper, classify the factors to trace their inner relationship and explain the influential process of different factors function. In order to construct a comprehensive evaluation model of copper safety, this work recommends a concept framework that can reflect sustainable development mechanism developed by UNEP and OECD, which is PSR model [8]. PSR model makes use of causal relationship logic of ��Cause- Effect-Response��, to elaborate the regulating and controlling process and mechanism of sustainable development from aspects of what, why, and how to respond to the happened ones. ��Pressure�� indicates factors from human activities, consumption patterns and economic systems that cause development not sustainable. The negative effect of ��Pressure�� is to consume resources and produce pollution in activities of economic and social development. ��State�� reflects both economic and environmental state, the core of the problem, which manifests what has happened. ��Response�� process demonstrates the measures that human may take in face of the present ��Pressure�� and ��State��, whose positive effect, i.e. efficient measures, can decrease the consumption of resources. The three subsystems of Pressure, State and Response are not independent, but interactional: State is driven by human activities (P), and regulated by social response system as well (R) [9,10]. Utilizing PSR concept framework helps to explain the interactional process and results of different factors affecting the security of copper, uncover the inner mechanism therein, and lay the foundation for evaluating copper security posture objectively.
The PSR comprehensive assessment model of copper security is a general framework that reflects the interdependent and interactional relationship between resources environment, targets of population and social economy development and resource decision. Population increase, speeding up urbanization and rapid development of social economy have brought about huge pressure to the safety of copper (P). The exhaustive way to use copper has changed the copper��s reserve condition, which will affect the state and ability for human to get it in a continued, stable, timely, sufficient, and economical way (S). The copper safety pressure demands society to take responding solutions (R), such as increasing input in geological exploration to find potential copper, developing technologies to enhance the use ratio of renewable copper, improving copper reserve to boost national regulating ability of copper supply. Figure 1 is the conceptual model of copper security based on PSR theory.
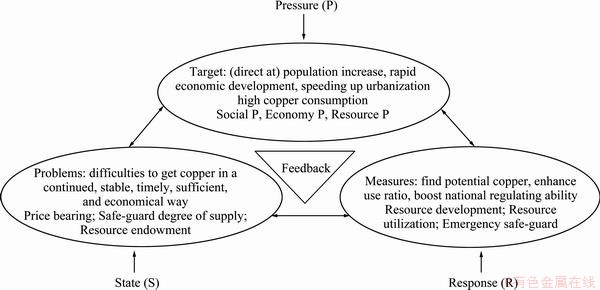
Fig. 1 Conceptual model of copper security based on PSR Theory
2.1.2 Construction of comprehensive assessment index system
The copper security model based on PSR is assessed from aspects of pressure, state and response respectively.
1) The establishment of pressure index system (P). From the viewpoint of UNEP and OECD, economic development, population increase and urbanization stimulate resource consumption, and bring about pressure to the security of resource. This work sets up a copper pressure index system from three dimensions which are social pressure, economy pressure and resource pressure.
2) The establishment of state index system (S). JIN [11] believed that China��s industrial development is restricted by resources and environment more strikingly than other countries in the world. Population and natural resource factors don��t make up absolute obstacles to the development of China��s industry, and in many ways China has some advantages (reserves and varieties) in resources. But China doesn��t have exceptional resource advantages and large population makes it insufficient per capita as the fundamental realities of the country. Heavy resource consumption has pushed forward China��s economy to grow rapidly for more than 30 years, and also made economy growth approach constrained boundary of resource and environment condition. Reserve, investment, capacity (including transportation), price (mechanism and endurance) are four basic problems of industrial resources, among which price is the core problem of supply and demand. The crisis of industrial resources shortage that China faces today and in the future is price, capacity and investment, and reserves [11,12]. Accordingly, this work sets up copper security state index system from three dimensions of price endurance, resource safe-guard degree, and resource endowment.
3) The establishment of response index system (R). National Condition Group from Chinese Academy of Sciences [13] pointed out that resource security means the supply of natural resources to human survival and development in a stable, lasting, timely, sufficient and economical way. Resource safe-guard system consists of five aspects of contents: i) protects resources, exploits and utilizes them equitably, and establishes a resource safe-guard system that can enable China��s development sustainable; ii) develops potential resources, consumes them moderately, and sets up economical system of using resources in pursuit of efficiency; iii) seizes opportunities and avoids threats, sets up a trade system of safe resources supply in two kinds of resources and two markets; iv) promotes technological progress, strengthens innovation, sets up technological system of resource security; and v) coordinates the operation of resources system, and sets up management system of resources security. The National Ministry of Industry and Information Technology also proposed reinforcing resources protection and storage, and building strategic stockpile system of nonferrous metal that enable orefield to connect material object, and national strategic reserves connect commercial reserves. Thus, this work establishes a copper response index system from three dimensions of resource development, resource utilization and emergency security.
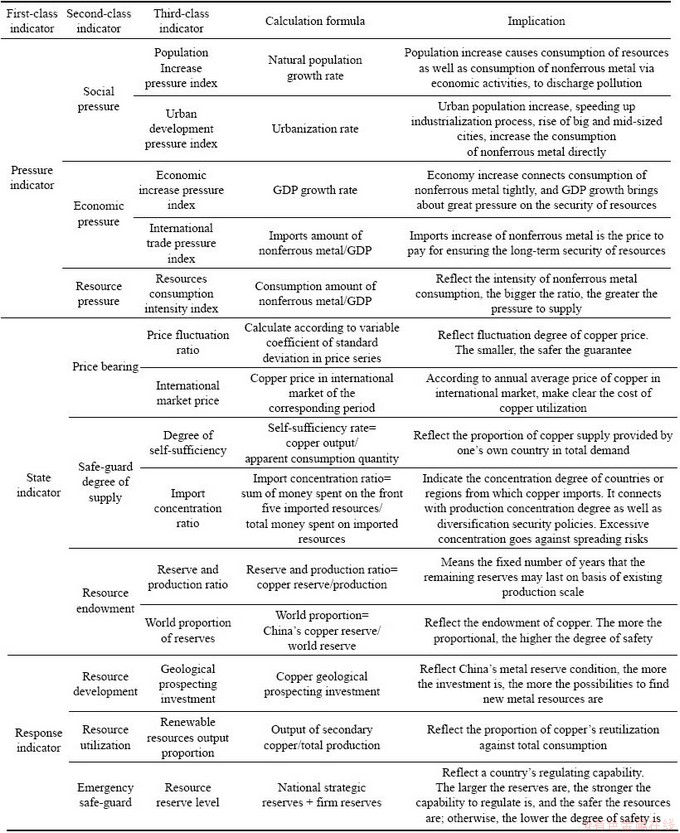
Based on the above theoretical analysis, this work, in the first place, sets up a copper safety index base that covers resource endowment, supply and demand, technological investment, international trade, ecology, and so on, amounting to 46 indicators, based on which a PSR comprehensive assessment index system is constructed for security with 3 first-class indicators, 9 second-class indicators, and 14 third-class indicators by following the index design principles of localization, integrity, comparability, feasibility after repeated sifting of several experts. Table 1 shows the comprehensive assessment system of copper security.
2.2 Weight setting
This work uses entropy evaluation method to set weight. Entropy evaluation method makes indicator evaluation according to the quantity character of data itself, which helps to exclude deviation that subjective weighting method may create, and has more objectivity and scientificalness. Entropy is a concept originated from thermodynamics as criteria of system evolution, with further development in information economics later. The dispersion degree of certain indicator can be judged by calculating entropy according to its properties. Generally speaking, the stronger an indicator��s dispersion degree, the higher its entropy, which means the indicator will be influential in the analysis. On the contrary, the lower its entropy, which means that the indicator is little useful for the analysis. Therefore, entropy evaluation method is a good weighting tool for the multi-indicator comprehensive assessment.
The details for implementing the Maximum Entropy Method are described below.
For a system of n objects characterized by a quantity with m indices, we use xij to represent the value of this quantity for the nth object at the jth index, with i=1, 2, ��, n; and j=1, 2, ��, m.
1) Perform dimensionless analysis on the quantity xij and thus remove the incommensurability.
2) Compute the weight of contribution from the ith year to the x value at the jth index as
 (1)
(1)
3) Compute the entropy of the jth index as
 (2)
(2)
4) Compute the coefficient of variation for the jth index, which is defined as
 (3)
(3)
The coefficient of variation is a useful quantity for evaluating a solution. The larger the coefficient of variation for the target quantity at the jth index, the smaller the entropy value.
5) Define the weight as
 (4)
(4)
6) Compute the overall score of the security of the copper resource in the ith year as
 (5)
(5)
2.3 Evaluation method
The indicators of copper PSR comprehensive assessment index system are basically quantitative indicators calculated by adopting objective data. As for the indicator of resource reserve level that is not easy to obtain quantitative data, it will be graded in five ranks according to such open information of copper reserve as reserve amount, reserve system, and so on, among which rank 1 means no reserve at all, and rank 5 means perfect reserve system and ample reserve.
Table 1 Comprehensive assessment system of copper security
In order to make effective comparison and assessment of different indicators, this work deals with the data in a dimensionless way by adopting Efficiency Coefficient Method.
Based on the theory of multi-objective- programming, Efficiency Coefficient Method determines a satisfactory value and a forbidden value for each indicator, taking the highest level that can be reached as top satisfactory value and acceptable bottom level as forbidden value, calculates the degree of the indicators�� achieved satisfactory value by which confirms the grade of each indicator, then synthesizes them by weighted geometric mean to assess the comprehensive state that the object studied. The paper deals with the quantitative indicators in a dimensionless way by adopting Efficiency Coefficient Method, dividing the same indicator of different years in five ranks, and then calculating the average value of each rank as the basic value. A quarter of the average highest numerical value is the excellent value; favorable, middle, and range values can be achieved in similar way. Then giving them coefficient of basic value respectively, excellent value and better is 80, favorable value and better is 60, middle value and better is 40, range value and better is 20, worse than range value is 0.
The score of each indicator is the sum of basic value and adjusting value, among which the basic value score is the standard coefficient of the present level, and the adjusting score equals 20 times efficiency coefficient, while efficiency coefficient=(indicator actual value- basic value)/(the upper basic value-the present basic value), and the space of bordering levels is 20. If the indicator��s present numerical value is the highest, the basic value of bordering upper level will be satisfactory value. If the indicator��s numerical value is the lowest, the present basic value is forbidden value.
2.4 Data sources
This work takes copper as study object, and makes use of the copper data from 1992-2011, demonstrates the construction process of PSR comprehensive assessment model. Taking copper as study object is mainly due to the following reasons. 1) China has developed to be the biggest copper consumption country of the world, the base of copper processing and manufacturing industry, the copper basic products exporting country. Copper plays an important role in China��s economic development and resources security. 2) China is short of copper, whose security is typical. 3) The indicators data needed for assessing copper security can be obtained from National Bureau of Statistics, Industry Almanac of China��s Nonferrous Metal, China��s Mining Industry Almanac, United States Geological Survey and wind database [14,15]. Data are available.
The basis to take 1992 as a cutpoint is that the 14th Congress of the Communist Party of China was convoked in 1992, and the Congress proposed to establish the socialist market economy system which made 1992 the landmark year for China��s entering a market road. From then on, China��s rapid development of industrialization and urbanization increased the demand and consumption of copper. The security of copper in 1992-2011 was most typical.
3 Results and discussion
3.1 Results of indicators system
The paper deals with the indicator data in a dimensionless way by adopting Efficiency Coefficient Method. After normative approach, each indicator is provided with the character of the higher numerical value the safer condition. That is to say, the higher the numerical value of the pressure indicators, the smaller the pressure, and the safer; the higher numerical value of the state indicators, the better the state, the safer; and the higher the numerical value of response indicators, the better the response effect, the safer. Table 2 lists the indicators score of copper security comprehensive assessment system.
3.2 Weight result of entropy evaluation method
According to calculation steps of entropy evaluation method, the weighted values of the indicators of three classes are achieved. Table 3 lists the indicators weight of copper security comprehensive assessment.
3.3 Comprehensive assessment results
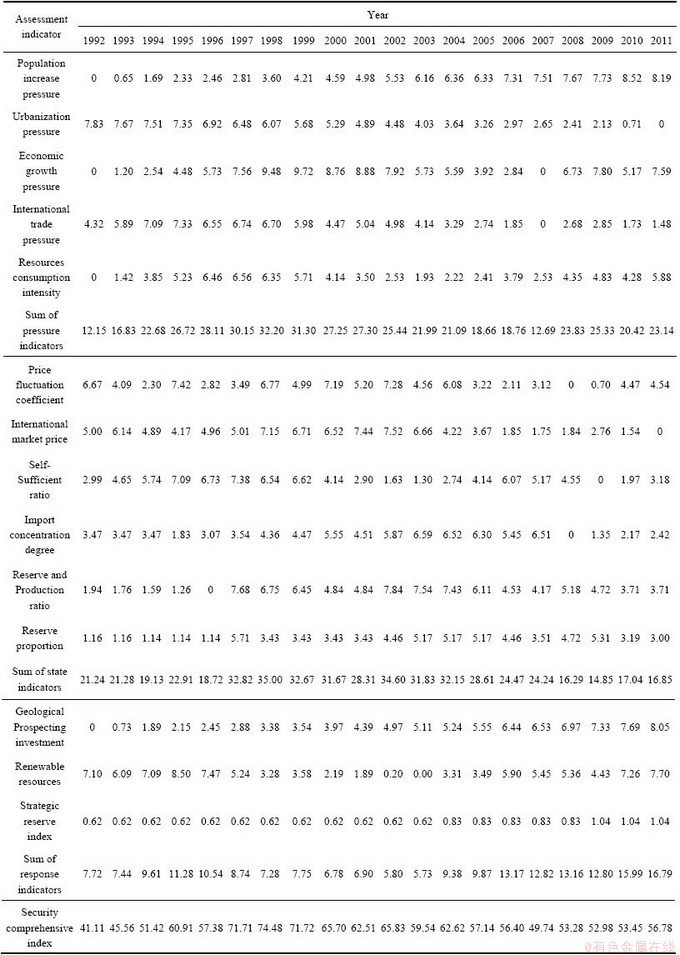
After nondimensionalization of data and indicators�� weight setting, the copper security comprehensive index in different years and the indicator values of P, S, R are worked out. Table 4 shows the variation of copper security comprehensive index in 1992-2011.
Table 2 Indicator score of copper security comprehensive assessment system
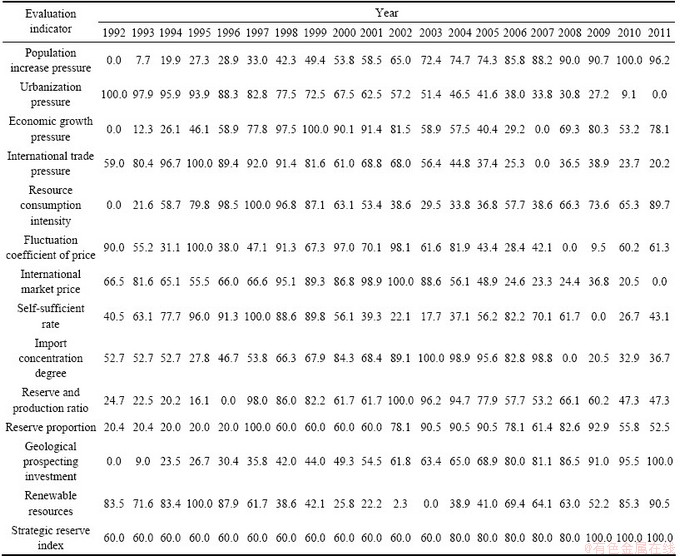
Table 3 Indicator weight of copper security comprehensive assessment

Table 4 Variation of copper security comprehensive index in 1992-2011
3.4 Simulated result of security trajectory
3.4.1 Overall situation of China��s copper security
According to the partition of China��s industrialization periods made by ZHU [16], it was pre-industrialization period in 1949-1972, initial period in 1973-1994, and mid stage from 1995 till now. ZHU predicted that China��s mid industrialization stage would end in 2014 and enter later stage in 2015. Therefore, the period in 1992-2011 was mainly at the mid stage of China��s industrialization, which was copper��s concentrated action period with great amount of demand and serious security situation.
It was shown that the mean value of China��s copper comprehensive security index in 1992-2011 was 58.51, which was at a comparatively low point. Figure 2 displays that the copper security index rose from 41.11 in 1992 to 74.48 in 1998, a summit of history, but fell continuously hereafter until to the low ebb of 49.74 in 2007. Then the security index of copper rose somewhat, and reached 56.78 in 2011, yet still 17.7 lower than the summit value in 1998. It illustrates that the general security situation of China��s copper improved a little compared to that in 2007, but the index remained at a low level, fluctuated greatly, which made the security situation of China��s copper not optimistic.
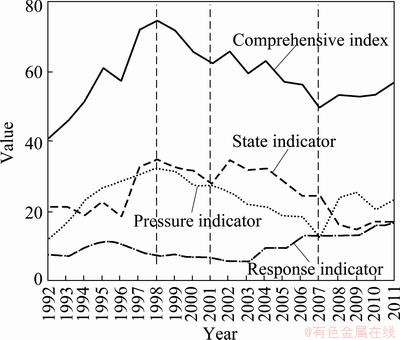
Fig. 2 Variation of China��s copper security trajectory based on PSR model (1992-2011)
3.4.2 China��s copper security pressure
As displayed in Fig. 3, China��s copper security pressure index rose from 30.41 in 1992 to 57.93 in 2011. The pressure index of copper security increased rapidly from 1992, until it arrived at the maximum value of 80.59 in 1998. From 1992 to 1998, the natural population growth rate dropped from 1.16% to 1%, GDP growth rate dropped from 14.2% to 7.8%, the percentage of copper import volume in GDP dropped constantly. The copper consumption intensity maintained at a level of 75 tons per hundred million Yuan after it fell below 100 tons per hundred million Yuan in 1994. The conditions of social pressure, economic pressure and resource pressure were improved during this period. Starting from 1999, with China��s recovery from Asian Financial Crisis and accession to the WTO, the growth rate of GDP rose and urbanization rate advanced year by year. Until 2007, China��s urbanization rate was approaching 45%. Social and economic development enlarged the demanded volume of copper, which made import rise greatly, and the pressure index of copper security fall to 31.75 in 2007, 48.84 lower than the maximum value in 1998. From 2008 on, the security pressure index improved once more and rose to 57.93 in 2011, during the period of which natural population growth rate kept a level of 0.5%, a mild economic rate of below 10%, resource consumption intensity recovered to the level of 1994. On the whole, during the 20 years from 1992 to 2011, the copper security condition was changing with population increase, economic development and urbanization process.
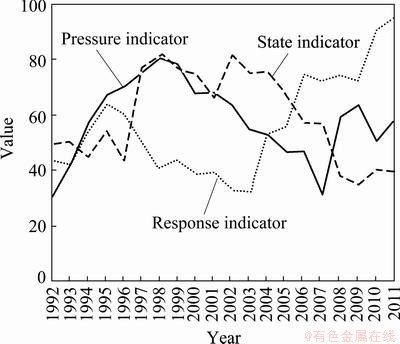
Fig. 3 Score variation of copper security pressure, state and response indicators (1992-2011)
3.4.3 China��s copper security state
As displayed in Fig. 3, the copper security index was under the value of 50 from 1992 to 1997, the variable coefficient was about 0.1 during this period with huge fluctuation in price, and international market price was at a high order of more than 2000 $/t; Import concentration was relatively high, top 5 countries accounted for nearly 40% of total China��s copper imports, and meanwhile the resource endowment was in bad state. The copper security state improved somewhat, and the security index fluctuated slightly from 1998 to 2002, maintained a fair level during the five years, the average value of security state index was 76.43. From 2002, the copper security state was continuously in tension, and security state index dropped constantly, fell from 81.49 in 2002 to 39.69 in 2011, dropped 41.8 in ten years, decreasing amplitude was 51%. China��s copper security state was constantly in tension.
3.4.4 China��s copper security response
China��s copper security response has significant improvement in the past 20 years. As displayed in Fig. 3, the security response index was 43.88 in 1992 and 95.43 in 2011 with the index rising by 117%. During this period, the country��s investment in copper geological prospecting increased continuously. The share of renewable copper amounted to 40% of total copper production in 2011. The copper reserve system was perfected gradually. Government and enterprises responded to copper security from aspects of increasing supply, improving efficiency and strengthening regulation, and response level rose continuously.
4 Conclusions
1) According to ��Cause-Effect-Response�� logic of relation, based on PSR model, a copper security comprehensive assessment model was established, which includes 3 first-class indicators, 9 second-class indicators, and 14 third-class indicators. The model deals with data in a dimensionless way by adopting Efficiency Coefficient Method, and uses entropy evaluation method which is more subjective and scientific to set indicators�� weight to exclude deviation caused by subjective weighting.
2) Making use of PSR comprehensive assessment model of copper security, China��s copper security situation from 1992 to 2011 was analyzed. This studies disclosed that China��s demand of copper was increasing with the progress of industrialization and urbanization, and the average value of copper security comprehensive index was 58.51 in the past 20 years. Although the index rose from a low point started from 2008, security pressure was improving and response level was promoting, yet the security state was constantly intension. China��s overall security situation of copper was far from being optimistic.
3) According to the weight proportion, the copper security state index was most important for improving the comprehensive index of copper security. The copper security state index was influenced by other indicators including price endurance, resource safe-guard degree, and resource endowment. The price of copper is the outcome of game by the parties, which is not easy to control. As a result, in order to improve China��s copper security state, more attention should be paid on improving resource safe-guard degree and resource. On the basis of the global allocation of resource, it is necessary to increase the development and utilization of secondary copper and low grade copper mine, and establish diversified safe-guard channels of copper supply.
References
[1] CHENG Jin-hua, WANG Xiao-ying. China��s policy adjustments based on international experience of industrialization and mineral resource consumption [J]. Journal of China University of Geosciences: Social Sciences Edition, 2011, 11(2): 23-27. (in Chinese)
[2] CHEN Jian-hong, YONG Xue-yan, LIU Lang, ZHOU Zhi-yong. The study of correlation between national industrialization and mineral resources consumption intensity [J]. China Mining Magazine, 2009, 18(10): 48-50, 63. (in Chinese)
[3] Ministry of Industry and Information Technology of the People��s Republic of China. The Twelfth Five-Year Development Plan for Nonferrous Metals Industry [EB/OL]. http:// www.miit.gov.cn/n11293472/n11293832/n11293907/n11368223/14447635.html. 2012-01-30. (in Chinese)
[4] NUNN S, SCHLESINGER J R, EBEL R E. The geopolitics of energy into the 21st century: The supply-demand outlook, 2000-2020 [M]. Washington D. C., USA: Center for Strategic & International Studies Press, 2000.
[5] FIRET B, JOHAN C, CARL F. Rediscovery of traditional ecological knowledge as adaptive management [J]. Ecological Application, 2000, 10(5): 1251-1261.
[6] CHEN Bai-ming. Summary of China��s land resources, production capacity and carrying capacity of the population [M]. Beijing: China Renmin University Press, 1992. (in Chinese)
[7] ZHANG Lei. On China��s energy security [J]. International Petroleum Economics, 2001, 9(3): 10-14. (in Chinese)
[8] OECD. OECD core set of indicators for environmental performance reviews: A synthesis report by the group on the state of the environment [R]. Organization for Economic and Development. No.38. Paris: OECD, 1993.
[9] YAO Yu-long, GU Shu-zhong. Echanism and economic definition of resources security [J]. Resource Science, 2002(5): 46-51. (in Chinese)
[10] GU Shu-zhong, CHENG Sheng-kui. China resource report [M]. Beijing: The Commercial Press, 2010. (in Chinese)
[11] JIN Bei. China��s industrial development under the binding of resource and environment [J]. China Industrial Economy, 2005(4): 5-14. (in Chinese)
[12] Institute of Industrial Economics of Chinese Academy of Socialsciences. China��s industrial development report (2005)��China��s industrial development under the binding of resource and environment [M]. Beijing: Economy & Management Press, 2005. (in Chinese)
[13] Chinese Academy of Sciences Analysis Research Team. Two resources and two markets to build China's resource security system [M]. Tianjin: Tianjin Renmin Press, 2001. (in Chinese)
[14] China Nonferrous Metals Industry Association. China nonferrous metals industry yearbook (1991-2011) [M]. Beijing: China Nonferrous Metals Industry Association, 1991-2011. (in Chinese)
[15] China Mining Yearbook Editorial Department. China mining yearbook (2002-2011) [M]. Beijing: Seismological Press, 2002-2011. (in Chinese)
[16] ZHU Min. Judgment of China��s industrialization process based on the index of industrialization [J]. China Economic & Trade Herald, 2010(7): 23-24. (in Chinese).
�й�ͭ��Դ��ȫ�ݻ��켣ģ��������
�� �ƣ�����ˮ����ƽ�ܣ�Ҧ���գ��� �
���ϴ�ѧ ������Դս���о�Ժ����ɳ 410083
ժ Ҫ��ͭ���ҹ����÷�չ�������Դ��ȫ�����������Ҫ��ɫ�����á�ѹ��-״̬-��Ӧ��(PSR)ģ�ͣ�������һ�װ���3��һ��ָ�ꡢ9������ָ�ꡢ14������ָ���ͭ��Դ��ȫ�ۺ�����ָ����ϵ�������ù�Чϵ�����������������ٻ���������ֵ�����и�Ȩ��Ȼ��ѡȡ1992��2011������ݣ�������й�ͭ��PSR��ȫ�ۺ�ָ��������������й�ͭ��Դ��ȫ�ۺ�ָ���ڵ�λ��������ȫѹ���ڸ��ƣ���ȫ״̬�Գ������ţ���ȫ��Ӧˮƽ����������ͭ�����尲ȫ̬���Բ����ֹۡ�
�ؼ��ʣ�PSRģ�ͣ�ͭ��Դ����ȫ���ۣ��ݻ��켣����ҵ������
(Edited by Sai-qian YUAN)
Foundation item: Projects (13BGL105, 13&ZD024) supported by the National Social Science Foundation of China; Project (2013ZK2003) supported by the Major Soft Program of Hunan Province, China
Corresponding author: Hai-lin YAO; E-mail: yaohailin14703@163.com
DOI: 10.1016/S1003-6326(13)62756-9
Abstract: Copper metal is one important raw material of national economy, and its security is tightly linked with industrialization process. A comprehensive security evaluation index system, including three first class indicators, nine second class indicators and fourteen third class indicators, was constructed based on the pressure-state-response (PSR) model. And efficacy coefficient method was adopted in dimensionless treatment and entropy method was used to obtain the weight. Then, the data of China��s copper from 1992 to 2011 were studied and collected. By processing these data, a comprehensive safety index of China��s copper was got. The results showed that the comprehensive safety index of China��s copper rose from its low point. The safety pressure state of China��s copper was improved. The safety state of China��s copper continued to be tight. The response state continued to rise. The overall situation of China��s copper safety was improving, but still not optimistic.
