

J. Cent. South Univ. (2021) 28: 911-925
DOI: https://doi.org/10.1007/s11771-021-4653-6

Quantitative determination of PFC3D microscopic parameters
LI Zhuo(��), RAO Qiu-hua(���ﻪ)
School of Civil Engineering, Central South University, Changsha 410075, China
 Central South University Press and Springer-Verlag GmbH Germany, part of Springer Nature 2021
Abstract:
It is important to calibrate micro-parameters for applying partied flow code (PFC) to study mechanical characteristics and failure mechanism of rock materials. Uniform design method is firstly adopted to determine the microscopic parameters of parallel-bonded particle model for three-dimensional discrete element particle flow code (PFC3D). Variation ranges of microscopic of the microscopic parameters are created by analyzing the effects of microscopic parameters on macroscopic parameters (elastic modulus E, Poisson ratio v, uniaxial compressive strength ��c, and ratio of crack initial stress to uniaxial compressive strength ��ci/��c) in order to obtain the actual uniform design talbe. The calculation equations of the microscopic and macroscopic parameters of rock materials can be established by the actual uniform design table and the regression analysis and thus the PFC3D microscopic parameters can be quantitatively determined. The PFC3D simulated results of the intact and pre-cracked rock specimens under uniaxial and triaxial compressions (including the macroscopic mechanical parameters, stress-strain curves and failure process) are in good agreement with experimental results, which can prove the validity of the calculation equations of microscopic and macroscopic parameters.
Key words:
Cite this article as:
LI Zhuo, RAO Qiu-hua. Quantitative determination of PFC3D microscopic parameters [J]. Journal of Central South University, 2021, 28(3): 911-925.
DOI:https://dx.doi.org/https://doi.org/10.1007/s11771-021-4653-61 Introduction
In rock mass engineering such as tunnel construction, petroleum and mining exploitation, internal cracks, joints or faults existing in natural rock would propagate under external load and cause potential hazard. Due to inhomogeneity and discontinuity of rock mass, their mechanical behaviors and failure mechanisms are hard to be studied by continuum mechanics theoretically. Furthermore, the crack propagation process is also difficult to be measured in tests, especially in triaxial tests. Therefore, numerical simulation has become an effective method. Since the discrete element method (DEM) based on discontinuous mechanics theory is advantageous over traditional finite element method (FEM) from the viewpoint of microscopic analysis, it has been widely applied to simulate the mechanical characteristics and failure mechanisms of the rock mass. The commonly used discrete element software is particle flow code (PFC) [1-7].
In PFC, the material is modeled as bonded assembly of rigid circular or ball. There are three basic bonded models: contact bond (CB) model, parallel bond (PB) model and flat joint (FJ) model. In the CB model, the particle point-contact bond (without cement) can resist only the normal and shear forces but not the bend moments (free rotation) at the contact point. When the bond breaks, its contact stiffness is still active and the macroscopic stiffness may not be affected significantly, which is not suitable for rocks.
In the PB model, a finite length bond (cement) is used to transmit both force and moment. Since the macroscopic stiffness is decided by both contact stiffness and bond stiffness, the bond breakage will result in the decrease of macroscopic stiffness, indicating that the PB model is more realistic for rock-like materials than the CB model [8]. The FJ model has a similar finite length bond (cement) to the PB model. Differently, when the bond breaks, the cement can still restrict rotation [9, 10]. Although the FJ model has better simulation results of tensile strength and friction angle than the PB model, it is still less applied for rock materials since more microscopic parameters need to be determined compared with the PB model.
The first task of applying PFC is to calibrate its many micro-parameters (��5) with high precise. The common method is trial-and-error method [11-14], but it is empirical and time-consuming. Therefore, many efforts have been made to seek reasonable mathematical methods. For example, artificial neural network method was utilized to predict the PFC microscopic properties of rock materials, but the calculation equations between microscopic and macroscopic parameters had not been obtained [15, 16]. Mathematical statistical methods, such as the orthogonal design method [17, 18], spherical symmetric design method [19], Plackett-Burman (PB) design combined with central composite design method [20], were used to establish the quantitative equations for microscopic and macroscopic parameters. However, for multi-factor and multi-level experiment design, the orthogonal design and spherical symmetric designs require a lot of trials. The Plackett-Burman design method has only two levels for each factor and cannot meet the accuracy requirement. In addition, the uniform design (UD), proposed by FANG et al [21] based on pseudo Monte Carlo method in number theory, is also a test design method, which only considers the uniform distribution of test points (test numbers) in the test range of parameters (factors), and whose test number depends only on the factor levels. It has much fewer test number and many much more factor levels with higher efficiency and precise of calculation than other design methods (e.g., orthogonal design, PB design).
In this study, the uniform design method was adopted to quantitatively determine the microscopic parameters of PB model in PFC3D for rock materials. Firstly, a suitable uniform design table was determined by studying the effect of microscopic parameter on macroscopic parameters based on PFC3D. And then, the quantitative equations of microscopic and macroscopic parameters were established by multiple regression analysis of uniform design table. Finally, the new quantitative equations were verified by uniaxial and triaxial compression tests of intact rock and pre-cracked rock specimens.
2 Uniform design process
2.1 Undetermined microscopic parameters
Figure 1 shows a standard cylinder specimen (��50 mm��100 mm) of rock under uniaxial compression for determining PFC3D microscopic parameters, where the particle is in yellow. In this paper, the displacement control manner (usually used in laboratory tests) is adopted for conducting the numerical test [22, 23], and the loading rate is 0.05 m/s. In the PB model, there exists two groups of microscopic parameters (11 unknown parameters): grain and cement microscopic parameters (Table 1).
To reduce the unknown parameters, let Rrat=1.66 (Rmax=1.66Rmin), ��=1, Ec=Ec and kn/ks=
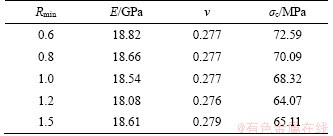
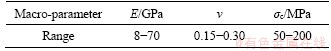
kn/ks [24]. In addition, the macroscopic mechanical parameters of rock materials tend to constant values when L/d��25 [25], where L is the smallest length of specimen (L=50 mm) and d is the average particle diameter (d=0.5(Rmax+Rmin)). Thus, d��2 mm and Rmin��1.5 mm (Rmax=1.66Rmin). Let Rmin=0.6, 0.8, 1.0, 1.2 and 1.5 mm, respectively. Select other six microscopic parameters (Ec=Ec=20 GPa, kn/ks=kn/ks=3, ��n=��s=60 MPa and R��=0.2, ��=0.5) arbitrarily and calculate the macroscopic mechanical parameters (elastic modulus E, Poisson ratio v, and uniaxial compression strength ��c) and failure patterns of the rock specimens for different Rmin by PFC3D, as listed in Table 2 and Figure 2. It is seen that the macroscopic mechanical parameters are all within the range of most rock materials (Table 3) [26]. When Rmin��1 mm, both these parameters and their failure patterns (concentrated microcrack area) have little change. Considering the calculation precise and efficiency, Rmin=0.8mm. The remaining six microscopic parameters (Ec, kn/ks, ��n, ��s, R�� and ��) need to be determined in PFC3D.
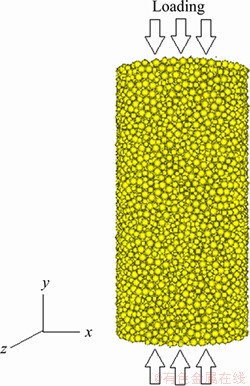
Figure 1 PFC3D model of rock specimen under uniaxial compression
Table 1 Basic microscopic parameters of PB model for PFC3D

Table 2 PFC3D simulated results of macroscopic mechanical parameters for different Rmin
2.2 Standard uniform design table
Uniform design method is an effective experimental design method by distributing the experimental points uniformly and scatteredly in the experimental domain, in order to ensure that the experimental points have statistical properties of uniform distribution, i.e., each level of each factor is tested only once. It is applied by means of the uniform design table in terms of Un(qs) or Un*(qs), where s is factor number (i.e., column number of the table) depending on basic microscopic parameters of PFC3D; n is experimental number (usually 3 to 5 times s); and q is level number of each factor (i.e., row number of the table). For each factor (s), there needs only one experiment for one level (i.e., q=n). The superscript * indicates that Un*(qs) has better uniformity than Un(qs), where its uniformity is evaluated by discrepancy (D) [27]. Obviously, the smaller the D is, the better the uniformity is.
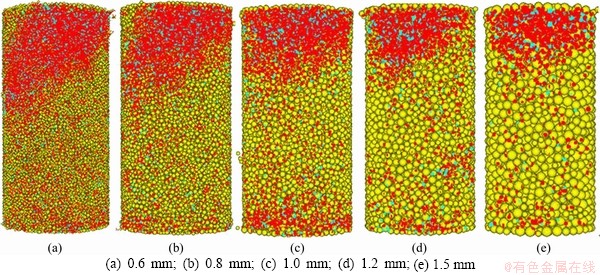
Figure 2 PFC3D simulated failure patterns for different Rmin:(red: tensile microcrack; blue: shear microcrack; yellow: particle)
Table 3 Test results of main mechanical parameters for most rock materials
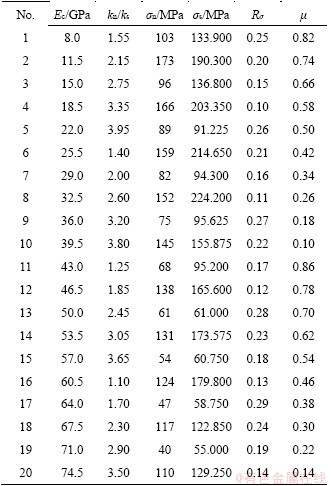
Since only six microscopic parameters (Ec, kn/ks, ��n, ��s, R�� and ��) need to be determined in Table 1, i.e., s=6 (the test number n>18), the standard uniform design table U20*(207) is adopted as shown in Table 4, where each value Uij (i is row number and j is column number) indicates the ordinal number of the j-th factor in the i-th test. For each microscopic parameter, its actual value in U20*(207) is: U��ij=Smin+(Uij-1)(Smax-Smin)/20, where Smax and Smin are the maximum and minimum value of the range for j-th factor, respectively. The equation indicates that the microscopic parameters are divided into the same difference value of two adjacent levels for 20 trials and arranged according to the level ordinal number Uij in Table 4.
Table 4 Uniform design table U20*(207)
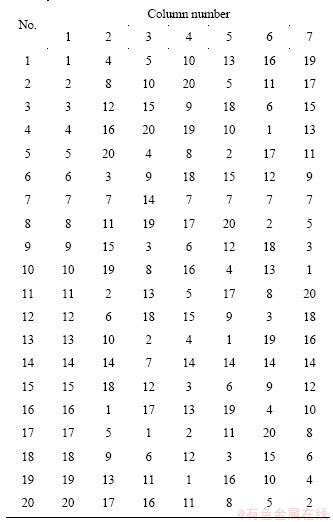
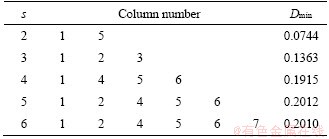
According to the applied table of U20*(207) (Table 5), when s=6, selection of columns 1, 2, 4, 5, 6, 7 has better uniformity with the minimum discrepancy (Dmin) than the other six columns. Therefore, the column 3 in U20*(207) (Table 4) must be deleted for test arrangement.
Table 5 Applied table of U20*(207)
2.3 Microscopic parameter ranges and actual uniform design table
To obtain the actual uniform design table of microscopic parameters (Ec, kn/ks, ��n, ��s, R�� and ��), the microscopic parameter range needs to be firstly determined, based on analyzing the effect of microscopic parameters (normalization) on macroscopic mechanical properties, as shown in Figures 3-6. For example, when Ec is changed within a certain range (Ec=10-80 MPa) and the other five microscopic parameters are unchanged (kn/ks=3, ��n=��s=60 MPa, R��=0.2, and ��=0.5), the stress-strain curves and macroscopic mechanical properties (E, v, ��c and ��ci/��c) varying with Ec are calculated by PFC3D, where the crack initiation stress (��ci) defined as the axial stress at which there is a specified ratio (R) of the crack number to the total crack number (corresponding to ��c) [24]. R is governed by a subroutine variable ��pk_ci_fac�� in PFC3D and R=1% in this study. It needs to be explained here that, for simplicity, let ��n=��s first (since ��s is usually larger than or equal to ��n [20]) and then determine the ratio of ��s and ��n in the following Figure 7. Normalization of microscopic parameters in Figures 3-6 means the variation values of microscopic parameters divided by their initial values (E0=10 MPa, kno/kso=1, ��so=��no=40 MPa, R��0=0.1). For example, when Ec is changed within a certain range (Ec=10-80 MPa), the normalization of Ec is equal to 1-8, i.e., Ec=10-80 MPa divided by the initial value E0=10 MPa.

Figure 3 Effect of microscopic parameters on E
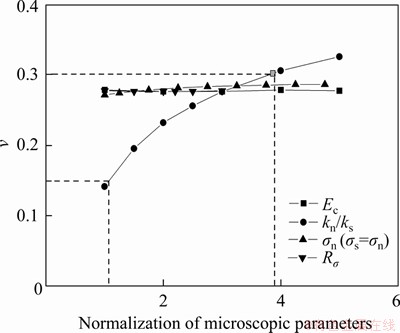
Figure 4 Effect of microscopic parameters on v
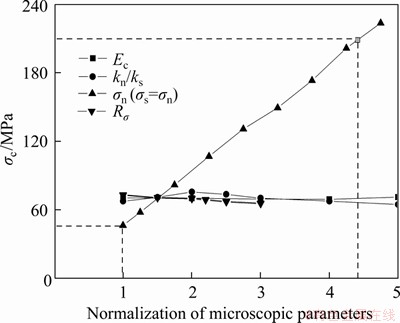
Figure 5 Effect of microscopic parameters on ��c
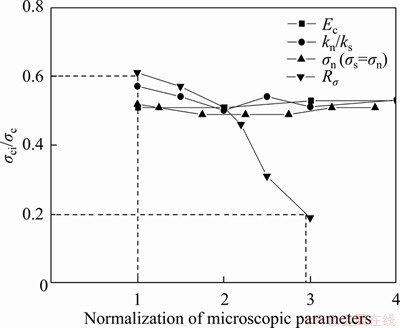
Figure 6 Effect of microscopic parameters on ��ci/��c
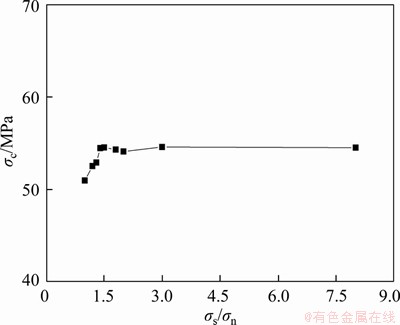
Figure 7 Relationship between ��c and ��s/��n
It is seen from Figure 3 that Ec has much greater effect on E than kn/ks, but both ��n and R�� have almost no effect on E. Therefore, the range of Ec could be determined by the range of E (E=10-70 GPa), i.e., Ec=8-75 GPa. Similarly, Poisson ratio v is affected significantly by kn/ks (Figure 4) and thus the range of kn/ks could be obtained by the range of v (v=0.15-0.3), i.e., kn/ks=1.1-4.0.
Figure 5 indicates that the uniaxial compressive strength ��c is mainly related to ��n (��s=��n). Thus the range of ��n could be obtained by the range of ��c(50-200 MPa), i.e., ��n=40-175 MPa. It is also found from Figure 7 that ��c varies with ��s/��n only when 1�ܦ�s/��n��1.5. For obtaining the value ranges of both ��n and ��s influencing on ��c, let ��s/��n=1.0-1.5 and thus ��s=40-262.5 MPa.
Figure 6 shows that the ratio of the crack initiation stress to uniaxial compressive strength (��ci/��c) is greatly affected by R�� rather than the other microscopic parameters. The range of R�� can be achieved by the range of ��ci/��c (��ci/��c=0.2-0.6) [28, 29], i.e., R��=0.1-0.29.
Particle friction coefficient (��) has only influence on the post-peak response since once a contact bond between two contacted particles is broken, the slip model is activated and slips of the two particles is governed only by �� [24]. Since the post-peak response is difficultly measured and described quantitatively for calibration of ��, the non-zero value of �� is usually regarded as a reasonable value. Let ��=0.1-0.9 in this study.
To sum up, the ranges of six microscopic parameters (Ec, kn/ks, ��n, ��s, R�� and ��) are determined completely: Ec=8-75 GPa, kn/ks=3,��n=40-175 MPa, ��s=40-262.5 MPa (��s/��n=1.0-1.5), R��=0.1-0.29, ��=0.1-0.9 (��>0), in which only five microscopic parameters are independent.
For obtaining the actual uniform design table of microscopic parameters (Ec, kn/ks, ��n, ��s, R�� and ��), the range of each microscopic parameter (Smin��S��Smax) is firstly divided into 20 equal parts, (Smax-Smin)/20. Then each U��ij is calculated, U��ij=Smin+(Uij-1)(Smax-Smin)/20. Finally, U��ij is placed into U20*(207) with deletion of the column 3 (Table 4) by the ordinal number, as listed in Table 6.
Table 6 Actual uniform design table of microscopic parameters
3 Calculation formula of microscopic and macroscopic parameters
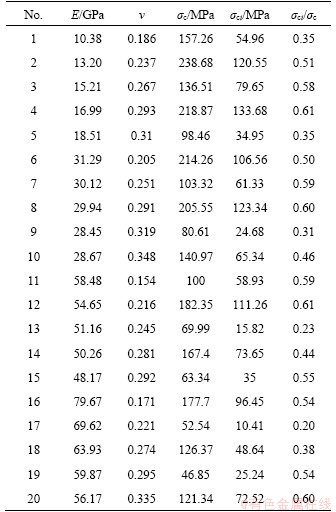
In the actual uniform design table of microscopic parameters (Table 6), each row represents one test. By substituting the six microscopic parameters of each row into the PFC3D model of rock specimen (Figure 1), corresponding strain-strain curves and macroscopic mechanical parameters (E, v, ��c, ��ci) are obtained, as listed in Table 7. The PFC3D simulated value ranges are E=10.38-79.67 GPa, v=0.154-0.348, ��c=46.85-238.68 MPa and ��ci/��c=0.20-0.61, which are in good agreement with test results in Table 3 (without ��ci/��c).
Table 7 PFC3D calculation results of macroscopic parameters
According to Table 7, each macroscopic parameter (E, v, ��c, ��ci) is related to six microscopic parameters (Ec, kn/ks, ��n, ��s, R��, ��) and their relation equations can be established by multiple regression analysis method, Eq. (1), where the interactive term of Ec and kn/ks is considered for improving calculation precise since both Ec and kn/ks affect E in different degree (Figure 3). The relation equations have very high fitting accuracy (R2>98.7%).
 (1)
(1)
Actually, there are only five independent microscopic parameters (��s/��n=1-1.5). Considering that �� can be determined as any non-zero constant (��=0.1-0.9 in this study), the remaining four unknown microscopic parameters (Ec, kn/ks, R��, ��n) can be completely determined by the four known macroscopic parameters (E, v, ��c, ��ci), based on Eq. (1).
4 Experimental verification
Uniaxial and tri-axial compression tests of intact and pre-cracked rock specimens were adopted to verify the validity of the above equations between the microscopic and macroscopic parameters as follows.
4.1 Uniaxial compression tests of intact rock specimens
4.1.1 Measurement of macroscopic mechanical parameters
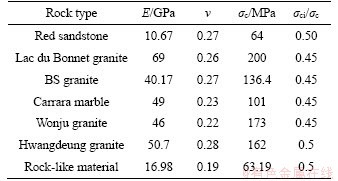
Uniaxial compression tests of seven types of rock materials with standard cylinder specimens (��50 mm��100 mm) were adopted for PFC3D simulation: red sandstone (tested on MTS815 equipment by our group), Lac du Bonnet granite [24], BS granite [1], Carrara marble [30], Wonju granite [31], Hwangdeung granite [32] and rock-like material (cement: sand: water=1: 0.8: 0.35) [2, 33]. Table 8 lists their main macroscopic mechanical parameters.
Table 8 Main macroscopic mechanical parameters of different rocks
4.1.2 Calculation of microscopic parameters
According to these macroscopic mechanical parameters of rock (E, v, ��c and ��ci/��c), the microscopic parameters of PFC3D (Ec, kn/ks, ��n, ��s=k��n, R��, where k is the ratio of parallel bond shear to normal strength) can be calculated by Eq. (1) for two cases: 1) k=1, i.e., ��s=��n, both the microscopic tensile and shear failures are possible; 2) k=1.2, i.e., ��s=1.2��n, the microscopic tensile failure is possible), where ��=0.5 (��=0.1-0.9), as listed in Table 9. For simplication, consider this two cases (k=1 and 1.2) only for two rock materials (Red sandstone and Lac du Bonnet granite).
4.1.3 Comparison of simulation and test results
Figure 8 shows stress-strain curves of red sandstone, BS granite and rock-like material obtained by numerical simulation and experiment, respectively. Stress-strain curves of different k of red sandstone are selected for comparing with test results. They have similar characteristics: linear (elastic) stage, non-linear (elastic-plastic) stage with positive slope and non-linear (failure) stage with negative slope. Compared with the tested stress-strain curve, no compaction stage (i.e., slope is increasing) is found since the rock material is assumed to be homogeneous and continuous in PFC3D calculation model. In the true test, pre-existing micro-cracks in natural rock material would be closing in the first stage of compression, i.e., formation of compaction stage. Noticeably, the straight line of simulated and test curves are almost parallel and their peak stresses are very close to each other, and thus the simulated values of E and ��c are in good agreement with the test values. Meanwhile, the simulated stress-strain curves of red sandstone for different k has very small and simulated curves are in good agreement with the test results.
Table 9 Calculation results of microscopic parameters for four kinds of rocks
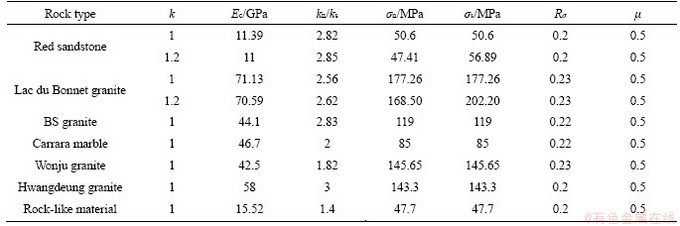
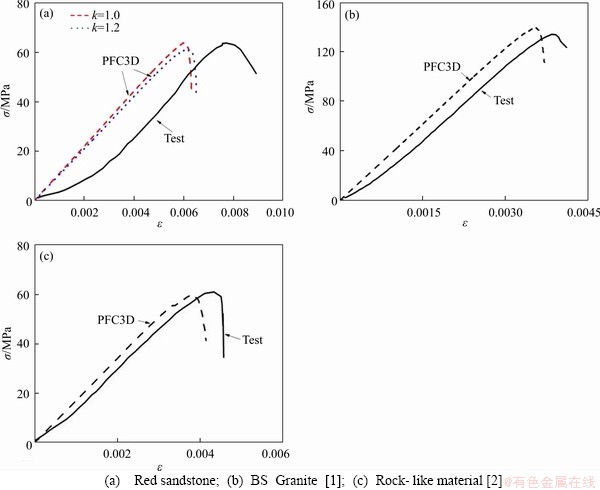
Figure 8 PFC3D simulated ��-�� curves compared with test results:
Table 10 lists simulated and experimental results of macroscopic mechanical parameters as well as error for seven rock materials under uniaxial compression. Most of errors are less than 5%, i.e., the simulated results have good precision. It is proved that the calculation equation (Eq. (1)) deduced by the uniform design method is effective and feasible for determining the microscopic parameters of PFC3D.
4.2 Uniaxial compression tests of pre-cracked rock specimens
4.2.1 PFC3D model
Uniaxial compression tests of standard cylinder specimens (��50 mm��100 mm) were adopted for PFC3D simulation of two types of brittle materials: red sandstone with single crack of 2a=30 mm and ��=45�� (tested on MTS815 equipment by our group, Figure 9), rock-like material with double cracks of 2a=12 mm, 2b=16 mm and ��=30�� [2] (Figure 10). Their macroscopic and microscopic parameters are listed in Tables 8 and 9 above.
4.2.2 Stress-strain curve
Figure 11 shows stress-strain curves of the single-cracked red sandstone specimen with different k (k=��s/��n) and double-cracked rock-like specimen obtained by numerical simulation and experiment, respectively. It is seen that the simulated stress-strain curves consist of three stages: elastic stage (oa), damage stage (ab for crack stable propagation) and failure stage (bd for crack unstable propagation, bcd for crack coalescence and crack unstable propagation) without compaction stage of test curve (red sandstone). The elastic moduli (slope of the linear stage) of simulated and test curves are almost the same, and the simulated values of peak strength for red sandstone (��c=24.90 MPa for k=1 and ��c=23.28 MPa for k=1.2) and rock-like material (��c=37.00 MPa for k=1) are also very close to the test values (��c=24.18 MPa for red sandstone and ��c=33.60 MPa for rock-like material) with small error of 2.9%-3.7% (k=1-1.2, red sandstone) and 10% (rock-like material). k has only effect on peak strength and no effect on elastic modulus.
Table 10 Simulated and experimental results of macroscopic mechanical parameters for different rocks under uniaxial compression
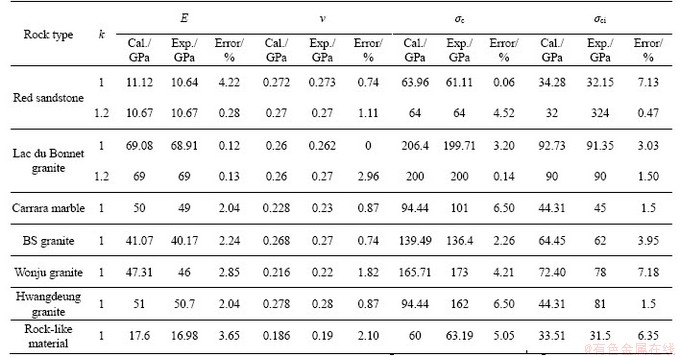
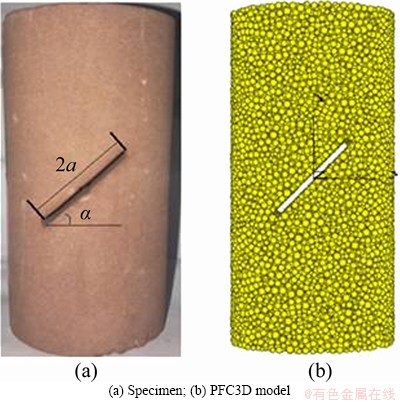
Figure 9 Single-cracked red sandstone specimen:
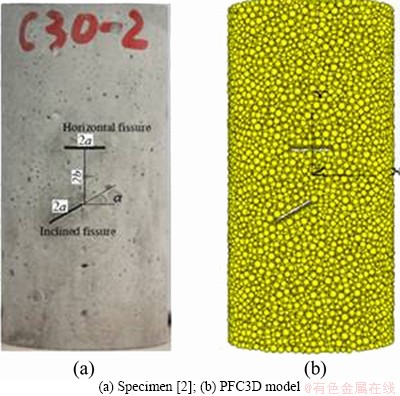
Figure 10 Double-cracked rock-like material specimen:
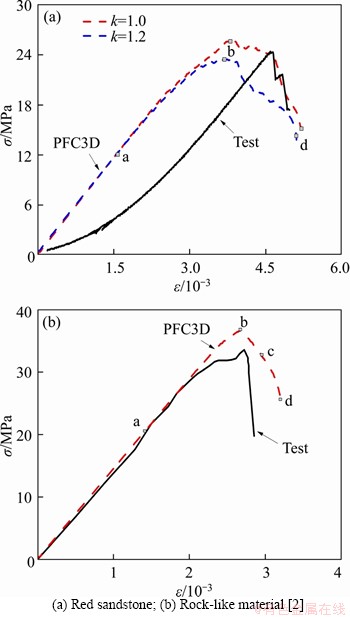
Figure 11 PFC3D simulated ��-�� curve compared with its test result:
4.2.3 Failure process
Figures 12 and 13 show the FPC3D simulated failure processes of single-cracked red sandstone specimen (k=1, 1.2) at different stages. They have the same characteristics: crack initiation (point a), stable propagation (ab), peak stress (point b), and final failure (point d). For different k, micro-cracks are both initiated at the crack tips (Figures 12(a) and 13(a)) and propagate at the angle of about 80�� deviating from the original crack plane (Figures 12(b) and 13(b)), i.e., formation of wing crack. At peak stress (Figures 12(c) and 13(c)), two secondary cracks appear: one is in the coplanar or quasi-coplanar direction of the original crack plane (secondary crack 1), and the other one is in the opposite direction of the wing crack (secondary crack 2). Finally, the secondary crack 1 propagates to the failure of the specimens (Figures 12(d) and 13(d)).

Figure 12 PFC3D simulated failure process (k=1) of single-cracked red sandstone specimen:
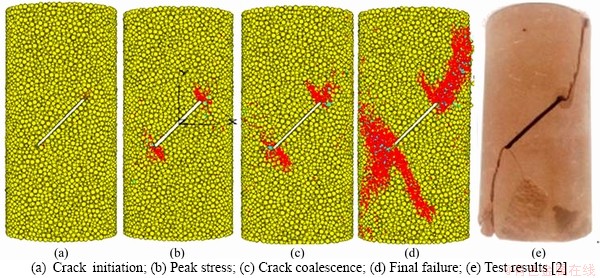
Figure 13 PFC3D simulated failure process (k=1.2) of single-cracked red sandstone specimen:
The simulated fracture trajectories agree well with theoretic analysis results [34] and test results (Figures 12(e) and 13(e)), which can verify the validity of calculation equation (1). Since the observed fracture trajectory is only on the specimen surface while the simulated one is presentation of the whole specimen, there is a little difference in the secondary crack 2, which is not obvious in the test results. Comparison of Figures 12 and 13 indicates that the failure process of single-cracked red sandstone specimen is less influenced by k (k=��s/��n).
Figure 14 shows the FPC3D simulated failure processes of double-cracked rock-like material specimen at different stages (horizontal crack 1, inclined crack 2): crack initiation (point a), peak stress (point b), crack coalescence (point c) and final failure (point d). It is seen that micro-cracks are initiated at the four crack tips simultaneously (Figure 14(a)) and then propagated stably to peak load at two tips of the crack 1 (almost in direction of perpendicular to the crack 1) and at the lower tip of the crack 2 (almost in direction of perpendicular to crack 2), as shown in Figure 14(b). The upper tip of the crack 2 is slowly propagated due to interaction of two cracks. After peak load (Figure 14(c)), it is gradually propagated upwards at about 100�� deviating from the original crack plane and tends to link up with the left tip of the crack 1, due to stress redistribution. New micro-crack is also initiated at middle point of the crack 1 parallel to the loading direction and other cracks continue to extend. Finally, the specimen fails when the two cracks coalesce (Figure 14(d)). Obviously, the simulated fracture trajectories coincide well with test results, which can prove again the effectiveness of calculation equations.
4.3 Triaxial compression tests of intact rock specimens
The intact cylinder specimen (��50 mm��100 mm) of rock-like material used in triaxial compression test (confining pressure ��3=5 MPa) is the same as that in uniaxial compression test. Figure 15(a) shows the stress-strain curves of simulation and experiment [2]. Both of them have the same stages: linear elastic stage (with the equal slope of straight line, i.e., elastic modulus E), damage stage and failure stage (with about 10% error of compressive strengths ��c). In addition, the simulated and tested values of ��c are increased with ��3 (Figure 15(b)) and very close to each other, (except for ��3=5 MPa), due to heterogeneity of the rock-like material. Comparatively, the intact specimen in the triaxial compression test has higher values of E and ��c than that in uni-axial compression test.
4.4 Triaxial compression test of pre-cracked rock specimen
4.4.1 Stress-strain curve
The double-cracked cylinder specimen (��50 mm��100 mm) of rock-like material used in triaxial compression test (confining pressure ��3=5 MPa) is the same as that under uniaxial compression test (Figure 10(b)). Figure 16 shows the PFC3D simulated and tested stress-strain curves [2]. They are also divided into the three stags: linear elastic stage (oa), damage stage (ab, crack stable propagation) and failure stage (bcd, crack coalescence and crack unstable propagation), where the elastic modulus E (E=19.24 GPa) and compressive strength ��c (��c=42.01 MPa) are almost the same. Comparatively, the double-cracked specimen in the triaxial compression test has higher values of E and ��c than that under uni-axial compression test (E=13.41 GPa and ��c=35.98 MPa).
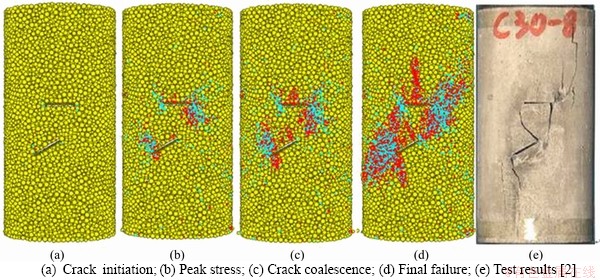
Figure 14 PFC3D simulated failure process of double-cracked rock-like material specimen:
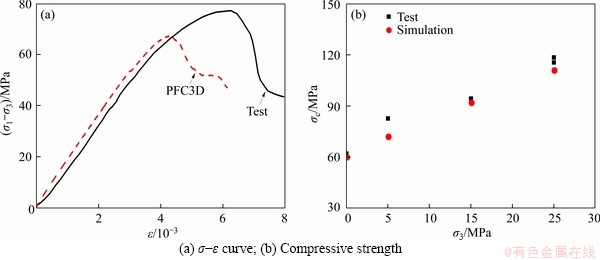
Figure 15 PFC3D simulated results as well as test results [2]:
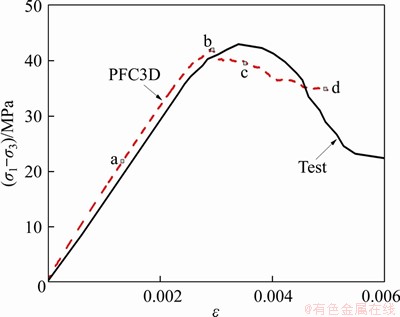
Figure 16 PFC3D simulated and test ��-�� curves of double-cracked rock-like material specimen under triaxial compression (confining pressure ��3=5 MPa)
4.2.2 Failure process
Figure 17 shows PFC3D simulated failure process of double-cracked rock-like material specimen (��3=5 MPa) at different stages (horizontal crack 1, inclined crack 2): crack initiation (point a), peak stress (point b), crack coalescence (point c) and final failure (point d). Similarly to the fracture process in uniaxial compression test, the micro-cracks initiate at the four crack tips simultaneously (Figure 17(a)) and then propagate stably to peak load at two tips of the crack 1 (almost in direction of perpendicular to crack 1) and at the lower tip of the crack 2 (almost in direction of perpendicular to crack 2), as shown in Figure 17(b). The upper tip of the crack 2 propagates slowly. After the peak load, it gradually propagates upwards at about 100�� deviating from the original crack plane and tends to connect with the left tip of the crack 1. Crack coalescence occurs at the left and right tips of the cracks 1 and 2 firstly, respectively (Figure 17(c)), and then crack coalescence occurs at the left tips of the crack 1 and the right tips of the crack 2 (Figure 17(d)). Finally, the specimen fails when the cracks coalesce. Compared to rock-like material specimen under uniaxil compression, there exsits few wing crack due to confining compression. Obviously, the simulated fracture trajectories coincide well with test results, which can prove again the effectiveness of Eq. (1).
In conclusion, the simulated stress-strain curves and fracture processes of the intact and pre-cracked specimens under uniaxial and triaxial compression are in good agreement with the tested results, which verifies the validity of Eq. (1) for determining the microscopic parameters of PFC3D (PB model) based on the uniform design method. The new method can be also applied for other bonded models of PFC, e.g., CB, FJ model.
5 Conclusions
1) Uniform design method is firstly adopted to establish the quantitative equations of microscopic and macroscopic parameters for PB model of PFC3D. It has the advantages of fewer trials, more levels and higher precision over the orthogonal design and Plackett-Burman design, and can be also applied for other CB and FJ models of PFC.
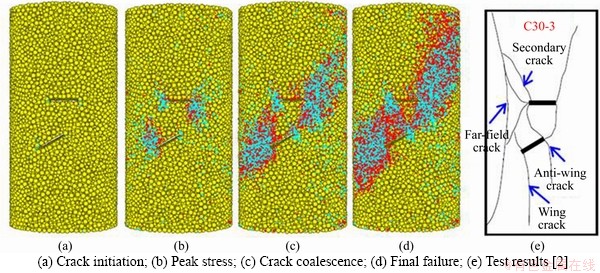
Figure 17 PFC3D simulated failure process of double-cracked rock-like material specimen in triaxial specimen at:
2) Effects of the microscopic parameter (Ec, kn/ks, ��n(��s) and R��) on the macroscopic parameters (E, v, ��c and ��ci/��c) indicate that E is greatly influenced by Ec and slightly by kn/ks; v is mainly affected by kn/ks; ��c is mostly related to ��n(��s), and ��ci/��c is primarily dependent of R��.
3) The relationship expression between the microscopic and macroscopic parameters is established by the actual uniform design table and the regression analysis, where the interactive term of Ec and kn/ks is taken into account for improving fitting precise. It has very simple form and high accuracy for calculating the PFC3D microscopic parameters conveniently and efficiently.
4) The PFC3D simulated stress-strain curves of the intact and pre-cracked rock specimens under uniaxial and triaxial compression have almostly the same deformation characteristics of linear, non-linear and failure. The simulated failure process of double-cracked specimen shows that the micro-cracks initiate and propagate at four crack tips simultaneously in the direction perpendicular to the original crack plane. The three tips of two cracks (the upper tip of inclined crack and two tips of horizontal crack) coalesce to failure under uniaxial compression, while four tips of two cracks (the left tip of horizontal crack and two tips of inclined crack, the right tip of horizontal crack and the upper tip of inclined crack) coalesce to failure under triaxial compression. The PFC3D simulated results agree well with the experimental results, which can verify the validity of the new established relationship expression of microscopic and macroscopic parameters by the uniform design method.
Contributors
RAO Qiu-hua provided the concept of manuscript and simulation calculation, and edited the draft of manuscript. LI Zhuo conducted the literature review, wrote the first draft of the manuscript and conducted the laboratory tests. All authors replied to reviewers��comments and revised the final version.
Conflict of interest
LI Zhuo and RAO Qiu-hua declare that they have no conflict of interest.
References
[1] DUAN K, KWOK C Y, THAM L G. Micromechanical analysis of the failure process of brittle rock [J]. International Journal for Numerical and Analytical Methods in Geomechanics, 2015, 39(6): 618-634. DOI: 10.1002/ nag.2329.
[2] HUANG Yan-hua, YANG Sheng-qi, ZHAO Jian. Three-dimensional numerical simulation on triaxial failure mechanical behavior of rock-like specimen containing two unparallel fissures [J]. Rock Mechanics and Rock Engineering, 2016, 49(12): 1-19. DOI: 10.1007/s00603- 016-1081-2.
[3] SARFARAZI V, HAERI H, SHEMIRANI A B, HEDAYAT A, HOSSEINI S S. Investigation of ratio of TBM disc spacing to penetration depth in rocks with different tensile strengths using PFC2D [J]. Computers and Concrete, 2017, 20(4): 429-437. DOI: 10.12989/cac.2017.20.4.429.
[4] CHEN S J, YIN D W, JIANG N, WANG F, GUO W J. Simulation study on effects of loading rate on uniaxial compression failure of composite rock-coal layer [J]. Geomechanics and Engineering, 2019, 17(4): 333-342. DOI: 10.12989/gae.2019.17.4.333.
[5] LIU Guang, SUN Wai-ching, LOWINGER S M, ZHANG Zhen-hua, HUANG Ming, PENG Jun. Coupled flow network and discrete element modeling of injection-induced crack propagation and coalescence in brittle rock [J]. Acta Geotechnica, 2019, 14(13): 843-868. DOI: 10.1007/s11440- 018-0682-1.
[6] YIN Peng-fei, YANG Sheng-qi. Discrete element modeling of strength and failure behavior of transversely isotropic rock under uniaxial compression [J]. Journal of the Geological Society of India, 2019, 93(2): 235-246. DOI: 10.1007/ s12594-019-1158-0.
[7] SAADAT M, TAHERI A. A numerical study to investigate the influence of surface roughness and boundary condition on the shear behaviour of rock joints [J]. Bulletin of Engineering Geology and the Environment, 2020, 19(5): 2483-2498. DOI: 10.1007/s10064-019-01710-z.
[8] CAO R H, CAO P, LIN H, PU C Z, OU K. Mechanical behavior of brittle rock-like specimens with pre-existing fissures under uniaxial loading: Experimental studies and particle mechanics approach [J]. Rock Mechanics and Rock Engineering, 2016, 49(3): 763-783. DOI: 10.1007/ s00603-015-0779-x.
[9] WU Shun-chuan, XU Xue-liang. A study of three intrinsic problems of the classic discrete element method using flat-joint model [J]. Rock Mechanics and Rock Engineering, 2016, 49(5): 1813-1830. DOI: 10.1007/s00603-015-0890-z.
[10] POTYONDY D O. The bonded-particle model as a tool for rock mechanics research and application: Current trends and future directions [J]. Geosystem Engineering, 2015, 18(1): 1-28. DOI: 10.1080/12269328.2014. 998346.
[11] HUANG Chen-chen, YANG Wen-dong, DUAN Kang, FANG Lin-dong, WANG Ling, BO Chun-jie. Mechanical behaviors of the brittle rock-like specimens with multi-non-persistent joints under uniaxial compression [J]. Construction and Building Materials, 2019, 220: 426-443. DOI: 10.1016/j.conbuildmat.2019.05.159.
[12] JU Yang, SUN Hua-fei , XING Ming-xu, WANG Xiao-fei, ZHENG Jiang-tao. Numerical analysis of the failure process of soil-rock mixtures through computed tomography and PFC3D models [J]. International Journal of Coal Science Technology, 2018, 5(2): 126-141. DOI: 10.1007/s40789- 018-0194-5.
[13] WANG Xiao, TIAN Long-gang. Mechanical and crack evolution characteristics of coal-rock under different fracture-hole conditions: A numerical study based on particle flow code [J]. Environmental Earth Sciences, 2018, 77(8): 1-10. DOI: 10.1007/s12665-018-7486-3.
[14] YANG S Q, TIAN W L, HUANG Y H, RANJITH P G, JU Y. An experimental and numerical study on cracking behavior of brittle sandstone containing two non-coplanar fissures under uniaxial compression [J]. Rock Mechanics and Rock Engineering, 2016, 49(4): 1497-1515. DOI: 10.1007/ s00603-015-0838-3.
[15] TAWADROUS A S, DEGAGNE D, PIERCE M, MAS IVARS D. Prediction of uniaxial compression PFC3D model micro-properties using artificial neural networks [J]. International Journal for Numerical and Analytical Methods in Geomechanics, 2009, 33(18): 1953-1962. DOI: 10.1002/nag.809.
[16] SUN M J, TANG H M, HU X L, GE Y F, LU S. Microparameter prediction for a triaxial compression PFC3D model of rock using full factorial designs and artificial neural networks [J]. Geotechnical and Geological Engineering, 2013, 31(4): 1249-1259. DOI: 10.1007/s10706-013-9647-1.
[17] CHEN Peng-yu. Effects of microparameters on macroparameters of flat-jointed bonded-particle materials and suggestions on trial-and-error method [J]. Geotechnical and Geological Engineering. 2017, 35(2): 663-677. DOI: 10.1007/s10706- 016-0132-5.
[18] CONG Yu, WANG Zai-quan, ZHENG Ying-ren, FENG Xia-ting. Experimental study on microscopic parameters of brittle materials based on particle flow theory [J]. Chinese Journal of Geotechnical Engineering, 2015, 37(6): 1031-1040. DOI: 10.11779/CJGE201506009. (in Chinese)
[19] PENG Xia, RAO Qiu-hua, LI Zhuo, ZHANG Jie. Quantitative determination method of mesoscopic parameters of discrete elements based on spherical symmetric design [J]. Journal of Central South University (Science and Technology), 2019(11): 2801-2812. DOI: 10.11817/j.issn. 1672-7207.2019.11.019. (in Chinese)
[20] YOON J. Application of experimental design and optimization to PFC model calibration in uniaxial compression simulation [J]. International Journal of Rock Mechanics and Mining Sciences, 2007, 44(6): 871-889. DOI: 10.1016/j.ijrmms.2007.01.004.
[21] FANG K T, MA C, WINKER P, ZHANG Y. Uniform design: Theory and application [J]. Technometrics. 2000, 42(3): 237-248. DOI: 10.1080/00401706.2000.10486045.
[22] WANG Yun-teng, ZHOU Xiao-ping, XU Xiao. Numerical simulation of propagation and coalescence of flaws in rock materials under compressive loads using the extended non-ordinary state-based peridynamics [J]. Engineering Fracture Mechanics, 2016, 163: 248-273. DOI: 10.1016/ j.engfracmech.2016.06.013.
[23] WANG Yun-teng, ZHOU Xiao-ping, KOU Miao-miao. Three-dimensional numerical study on the failure characteristics of intermittent fissures under compressive- shear loads [J]. Acta Geotechnica, 2019, 14(4): 1161-1193. DOI: 10.1007/s11440-018-0709-7.
[24] POTYONDY D O, CUNDALL P A. A bonded-particle model for rock [J]. International Journal of Rock Mechanics and Mining Sciences, 2004, 41(8): 1329-1364. DOI: 10.1016/ j.ijrmms.2004.09.011.
[25] DING X, ZHANG L, ZHU H, ZHANG Q. Effect of model scale and particle size distribution on PFC3D simulation results [J]. Rock Mechanics and Rock Engineering, 2014, 47(6): 2139-2156. DOI: 10.1007/s00603-013-0533-1.
[26] Institute of Water Resources and Hydropower Reseach, General Institute of Water Resources and Hydropower Planning and Design, Institute of Water Conservancy and Electric Power Information. The manual of rock mechanics parameters [M]. Beijing: China Water Power Press, 1991.
[27] FANG K T. Uniform design and uniform design table [M]. Beijing: Science Press, 1994.
[28] BRACE W F, PAULDING B W Jr, SCHOLZ C. Dilatancy in the fracture of crystalline rocks [J]. Journal of Geophysical Research, 1966, 71(16): 3939-3953. DOI: 10.1029/ JZ071i016p03939.
[29] MARTIN C D. The strength of massive Lac du Bonnet granite around underground openings [D]. Manitoba: University of Manitoba, 1993.
[30] ALBER M, HAUPTFLEISCH U. Generation and visualization of microfractures in Carrara marble for estimating fracture toughness, fracture shear and fracture normal stiffness [J]. International Journal of Rock Mechanics and Mining Sciences, 1999, 36(8): 1065-1071. DOI: 10.1016/S1365-1609(99)00069-6.
[31] YOON Y K. The effect of the loading condition and rock joint roughness on the hydraulic characteristics of rocks [D]. Seoul: Seoul National University, 1992.
[32] CHANG S H. Characterization of stress-induced damage in rock and its application on the analysis of rock damaged zone around a deep tunnel [D]. Seoul: School of Civil, Urban and Geosystem Eng, Seoul National University, 2002.
[33] HUANG Yan-hua, YANG Sheng-qi, ZENG Wei. Experimental and numerical study on loading rate effects of rock-like material specimens containing two unparallel fissures [J]. Journal of Central South University, 2016, 23(6): 1474-1485. DOI: 10.1007/s11771-016-3200-3.
[34] BOBET A. The initiation of secondary cracks in compression [J]. Engineering Fracture Mechanics, 2000, 66(2): 187-219. DOI: 10.1016/S0013-7944(00)00009-6.
(Edited by ZHENG Yu-tong)
���ĵ���
����ȷ��PFC3Dϸ�۲���
ժҪ��ϸ�۲����ı궨����Ӧ��PFC�о���ʯ���ϵ���ѧ���Ժ��ƻ�����������Ҫ���塣�����״β��þ�����Ƶķ�����ȷ����ά��ɢԪ������������ƽ��ճ��ģ�͵�ϸ�۲�����ͨ������ϸ�۲����Ժ�۲���(����ģ��E�����ɱ�v�����Όѹǿ�Ȧ�c������Ӧ���뵥�Όѹǿ�ȱȦ�ci/��c)��Ӱ����ɣ��õ�ϸ�۲����ı仯��Χ���Ӷ�������ϸ�۲���������Ʊ���ͨ��������Ʊ��ͻع��������������ʯ����ϸ�۲������۲����ļ��㹫ʽ���Ӷ����Զ���ȷ��PFC3Dϸ�۲�����������ʯ�Լ���Ԥ��������ʯ�Լ��ڵ��������ѹ���µ�PFC3Dģ����(���������ѧ������Ӧ��Ӧ�����ߺ��ƻ�����)��ʵ�����ǺϽϺã���֤�˸�ϸ�۲������۲������㹫ʽ����Ч�ԡ�
�ؼ��ʣ���-ϸ�۲���������ϵ��������Ʒ�������ά������(PFC3D)����ʯ
Foundation item: Projects(51474251, 51874351) supported by the National Natural Science Foundation, China
Received date: 2020-09-21; Accepted date: 2021-01-25
Corresponding author: RAO Qiu-hua, PhD, Professor; Tel: +86-13787265488; E-mail: raoqh@csu.edu.cn; ORCID: https://orcid.org/ 0000-0003-1171-647X
Abstract: It is important to calibrate micro-parameters for applying partied flow code (PFC) to study mechanical characteristics and failure mechanism of rock materials. Uniform design method is firstly adopted to determine the microscopic parameters of parallel-bonded particle model for three-dimensional discrete element particle flow code (PFC3D). Variation ranges of microscopic of the microscopic parameters are created by analyzing the effects of microscopic parameters on macroscopic parameters (elastic modulus E, Poisson ratio v, uniaxial compressive strength ��c, and ratio of crack initial stress to uniaxial compressive strength ��ci/��c) in order to obtain the actual uniform design talbe. The calculation equations of the microscopic and macroscopic parameters of rock materials can be established by the actual uniform design table and the regression analysis and thus the PFC3D microscopic parameters can be quantitatively determined. The PFC3D simulated results of the intact and pre-cracked rock specimens under uniaxial and triaxial compressions (including the macroscopic mechanical parameters, stress-strain curves and failure process) are in good agreement with experimental results, which can prove the validity of the calculation equations of microscopic and macroscopic parameters.
